Base price models are currently the industry standard in dynamic pricing for short-term rentals. The primary reason this model is so popular is that it is simple and scalable. It is simple regarding the math involved in setting the price, there are no probabilities or advanced statistics required to get the price. They are also scalable in regards to the data input, which is widely available market data.
“Base price model” is not common parlance in the industry to describe this method of price setting, at least not yet. We use the term to describe any model that requires a “base price” to be input or managed by a user. There are a few reasons these models don’t have a name. First, a lot of models in revenue management get their names from academia. Since they are not price optimization models, they are difficult to study. Second, this model seems ubiquitous in the industry, so for a long time there were no other competing models.
Data for Base Price Models
Doing dynamic pricing requires some data inputs and the primary data source that feeds these base price models is scraped off the OTA’s. This is data on the other short-term rental properties in a specific area.
If you have never heard of data scraping before, here is a brief explanation. Imagine you are looking for data on a certain market, like Atlanta. One way to do this would be to go to Airbnb, click on a property in Atlanta, and look at the pricing and availability. You could record this data in a spreadsheet, and then look at another one, and another one, etc. Eventually, you get some data on pricing and availability in Atlanta. Imagine now, you replace yourself with a robot and your spreadsheet with a database. That is the scraper. You can purchase this data or you can build a robot that will get it for you.
Using the Scraped data
The model now has the inputs, let’s see how the data is structured for use in pricing. First, the pricing data is aggregated for the city or region that your property is in. For each future date, there are hundreds or thousands of observations that have been collected. Those prices all get condensed into one “Market Average” price for each calendar date. The table below shows the aggregated pricing for each day into the future for our market.

There are many peaks and troughs in the market pricing. The reason they exist is that many of the managers of those properties, your competitors, have variable pricing. The peaks occur on certain days of the week, like Friday and Saturday. They also have higher rates in certain periods of the year, like summer. The very high peaks occur on holidays and events like Christmas or the Super Bowl. The base price model works by copying those market trends and applying them to your price.
Converting Currencies to Percentages
To be able to map that trend to your property, the model needs to convert the changes observed in the pricing to a percentage. I will explain why shortly.
What the model calculates next is, for each day into the future, what percentage up or down is that price compared to the average price? So, we start by calculating the average of the entire dataset and plotting that on the chart:

In this example, the average of the dataset is $213. For each day into the future, we now have an observation for the average market price and the average of the entire dataset. To convert that into a percentage, we just find how far away the observation is from the average, $213 and then get a percentage. This table displays the percentage and will be used to calculate the price in the base price model:

You will observe that the chart has the same exact shape as the one above, it now just represents percentages. The graph says: that at any day into the future, the market price is either up or down a certain percentage when compared to the average price of the entire market.
Converting Percentages to your Price
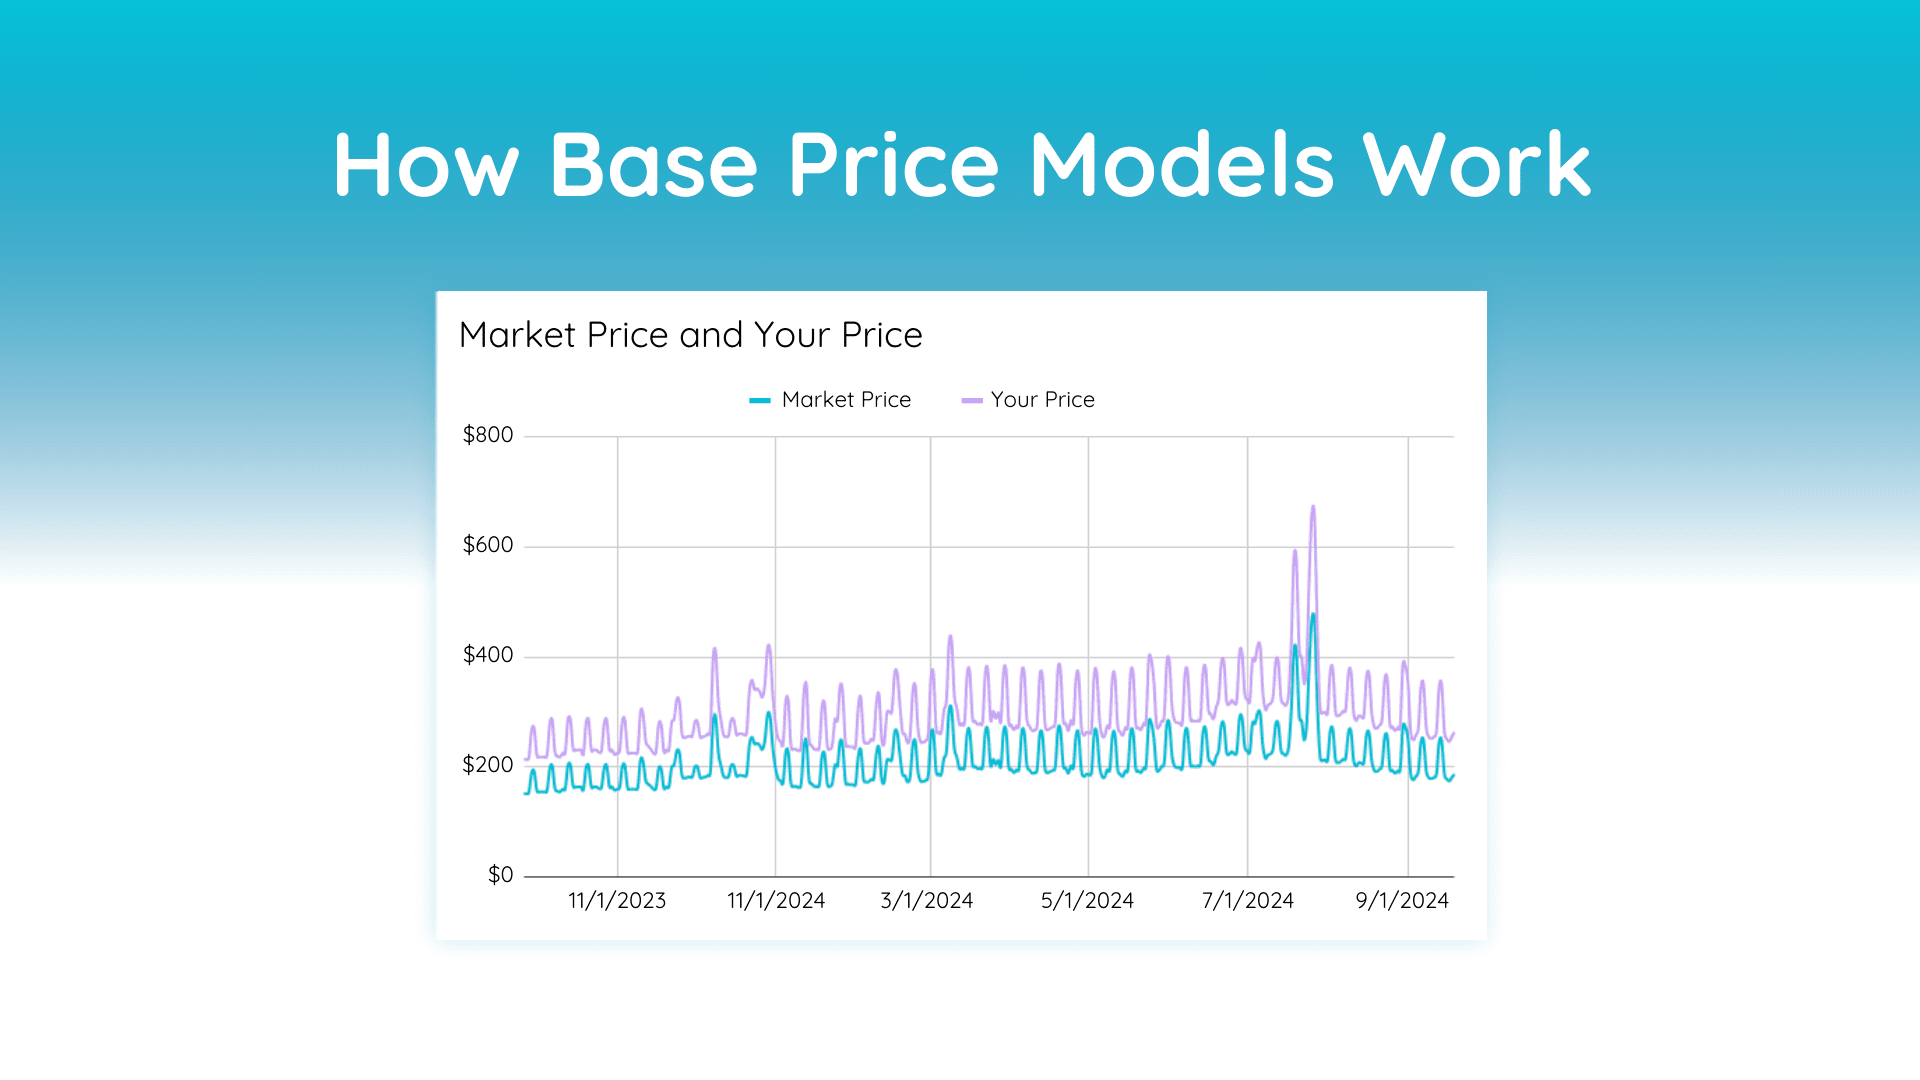
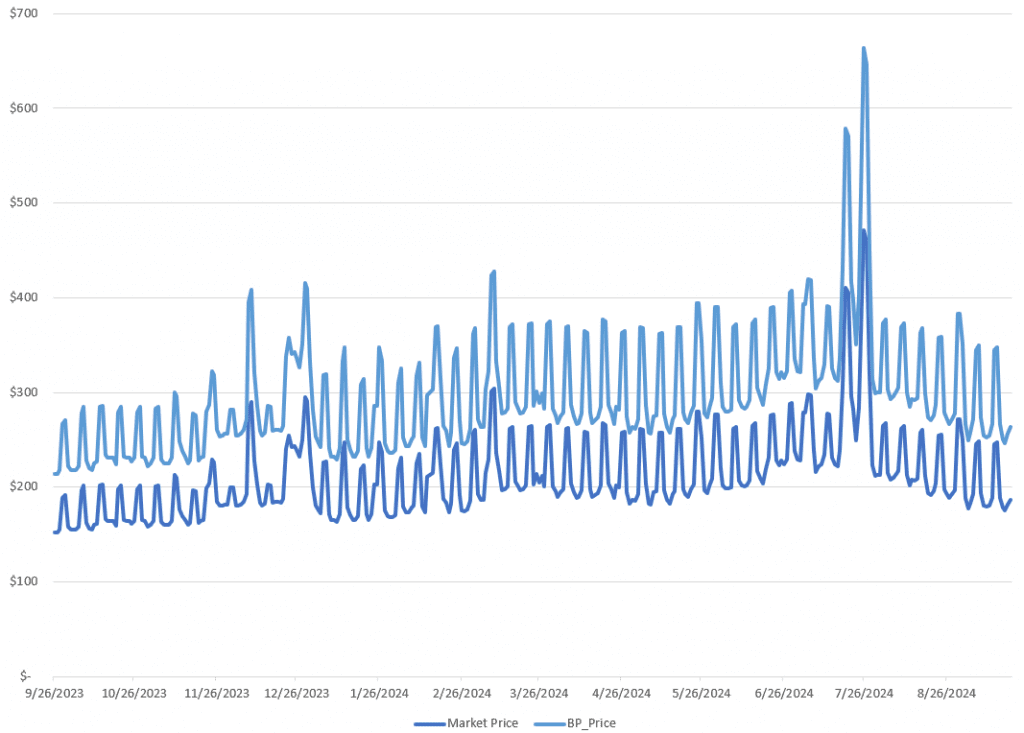
Base price models require a base price. This is the starting point for the model as it does its calculations. It is meant to be the average price or median price that the manager is expecting that the property will command. Let’s say I have a nice 3 bedroom house in Atlanta and I think it will command $300 per night on average. That is the value I will set as my base price. The model then takes my $300 base price and multiplies it by the market factor determined by the percentage chart for each day:

The trend of this pricing line matches the trend in the market because the model uses the market trend to set the price. If we chart the market line next to the price of the base price model, they look like the same line, but one just has a different starting point:
What makes the model dynamic?
The base price model by itself is not dynamic, it becomes dynamic by the frequency of running it. But, the model won’t change pricing unless the inputs change. The inputs here are the data that comes from the scraper. When the scraper runs again, it will pick up the changes that your neighbors in your market have made to their pricing since the last scrape. These changes in the market cause the model to update your pricing.
Normally, these price changes on a day-over-day period are pretty small. There are 2 reasons for this. First, the amount of properties that are scraped to create the price curve is normally in the hundreds or thousands. This makes it hard to move the average. Second, revenue managers are normally making small pricing changes to their strategies. Big changes normally indicate some type of error.
“The base price model by itself is not dynamic, it becomes dynamic by the frequency of running it. But, the model won’t change pricing unless the inputs change.”
Seasonality and Events
This model picks up seasonal fluctuations and events from the scraped data. When the scraped properties have higher rates on the weekends than on the weekdays, it is visible in the scraped data. This causes rates to be increased on the weekends. The same is true for broader time periods, like summer. If your competitors have set higher rates for the summer period, this model can see that and increase your rates. Events are detected in the same way. If the Superbowl is announced to take place in a certain city, your neighbors will raise their rates for that weekend of the game. After they raise their prices, the scraper picks them up the next day. When it calculates the percentage factor that the price is up on that weekend, it will see a spike which causes your price to increase.
Benefits of Base Price Modeling
The biggest benefit to a model like this is the simplicity. They do not require any historical data, and almost all other revenue management models need historical data. You can take a brand new property without any previous booking data, give the model a base price and it will run. It is incredibly scalable.
Getting the data to power the model is also accessible to almost every market in the world. You can either buy the data or build a data scraper to get it.
Lastly, they are pretty easy to understand if you are a property manager. More complicated models require dedicated revenue management professionals with a strong background in statistics and economics.
Costs of Base Price Modeling
The biggest criticism of this model is that it doesn’t actually “optimize” revenue in the revenue management sense of the word. Optimization is a mathematical process that finds the price that generates the highest revenue. It is a specific function that uses probabilities to estimate a revenue-maximizing price. Base price models do not use this process.
Base price models start with a static price, then look at market trends to find out how much to adjust that price up or down. The model does not know or care what the base price is, it is just trying to determine how much to adjust it up or down.
💎 Summary
Another way to think about the base price model is as a “follow your neighbor” model. It is taking the pricing guidance from your neighbors and trying to follow what they are doing. If your neighbors are doing a good job with their pricing, this model can perform well. If you don’t trust that your neighbors are good at pricing, then you should invest in an optimization model.

