What is Portfolio Analytics and how to use it?
What’s on this page:
Portfolio Analytics is a tool designed to provide you with in-depth insights into the overall performance of your properties.
Accessing Portfolio Analytics:
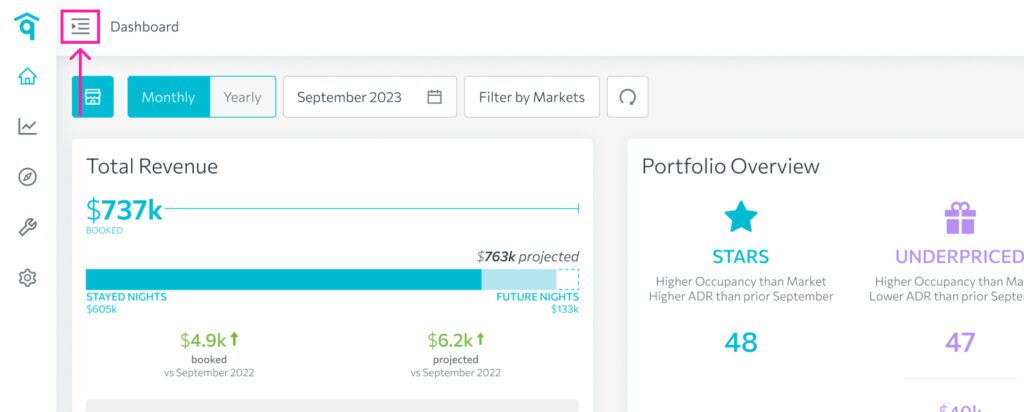
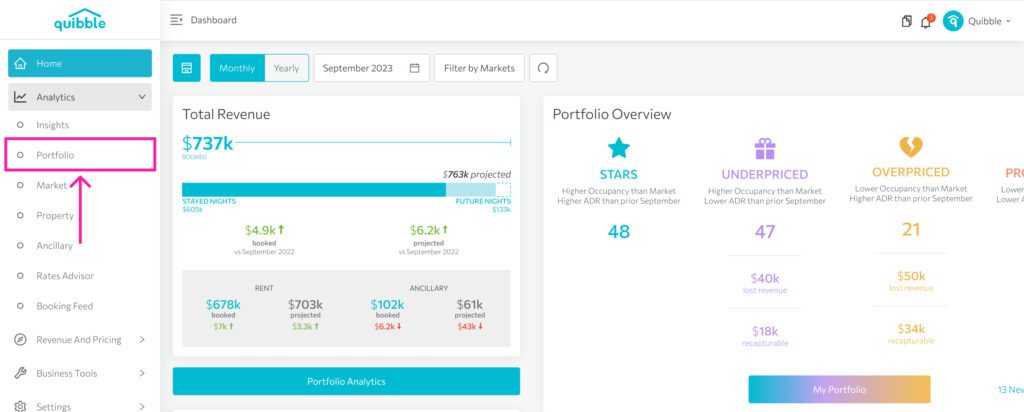
1. Navigate to the left-side menu bar.
2. Click on the “Analytics” dropdown.
3. Select “Portfolio.”
Key Metrics Video
Key Metrics
The Portfolio Analytics section is where you can gain valuable insights into the performance of your overall properties at the portfolio level. Dive into seven essential metrics, each providing a unique perspective on your yearly data.
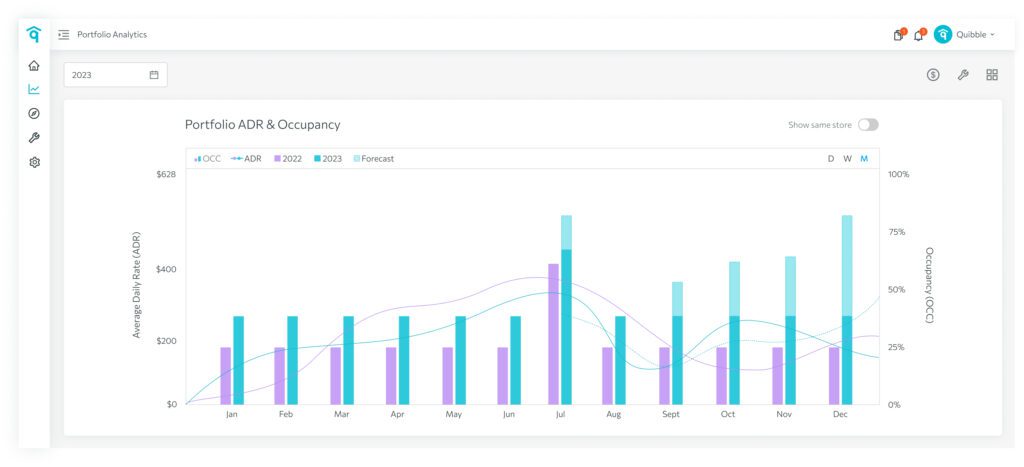
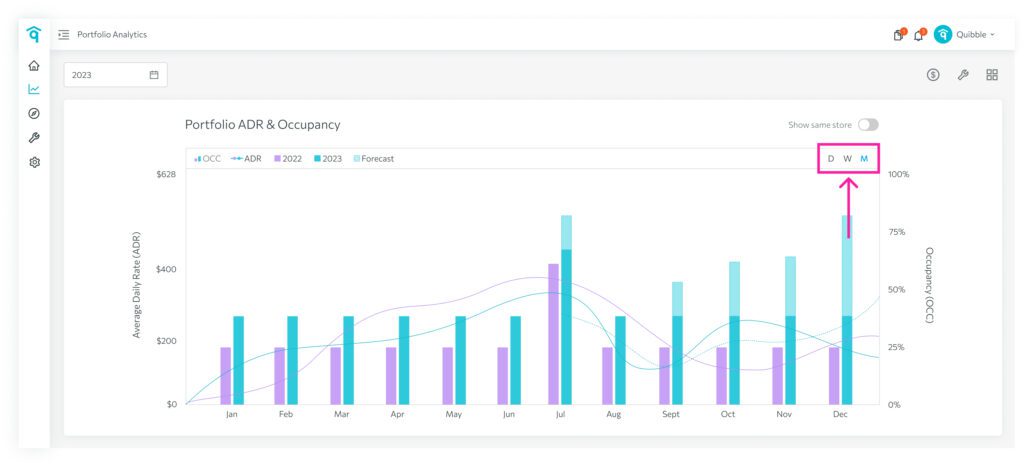
1. ADR & Occupancy – understand Average Daily Rate (ADR) and Occupancy, crucial indicators of your portfolio’s revenue and occupancy levels.
- Forecast – this is the predicted value that will materialize at the end of the period based on historical trended data.
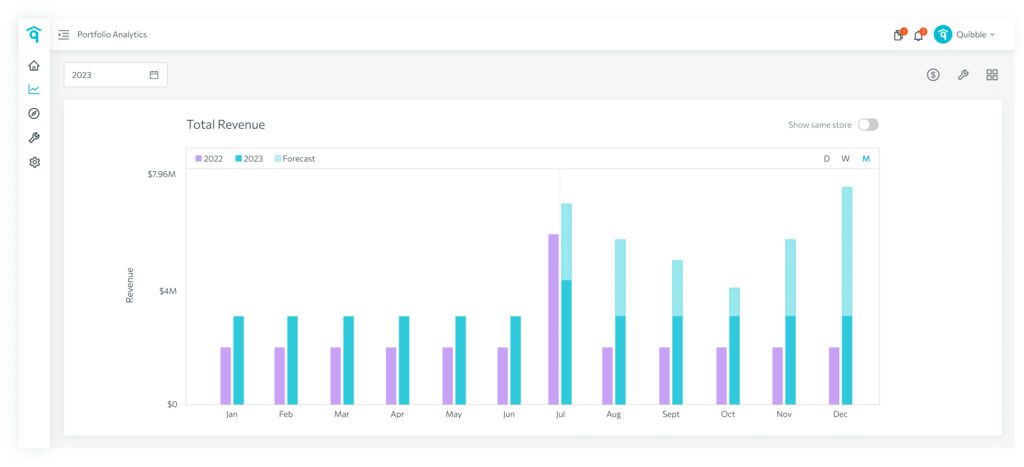
2. Total Revenue – track the overall revenue generated by your portfolio to gauge its financial health. Revenue includes Rent and Ancillary fees.
3. Bookings (Reservations) – monitor the number of bookings or reservations made within the selected year.
4. Length of Stay – explore the average length of stay for guests to optimize booking strategies.
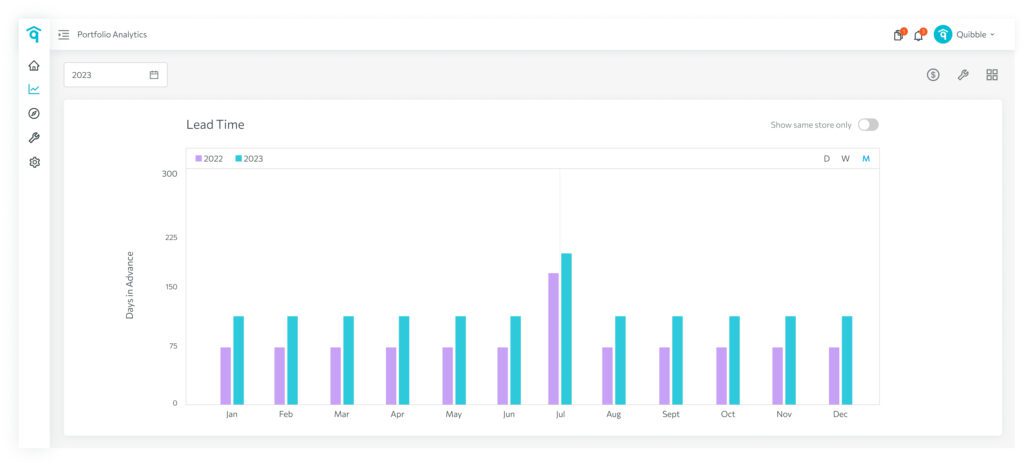
5. Lead Time – understand the time gap between booking and check-in with the Lead Time metric.
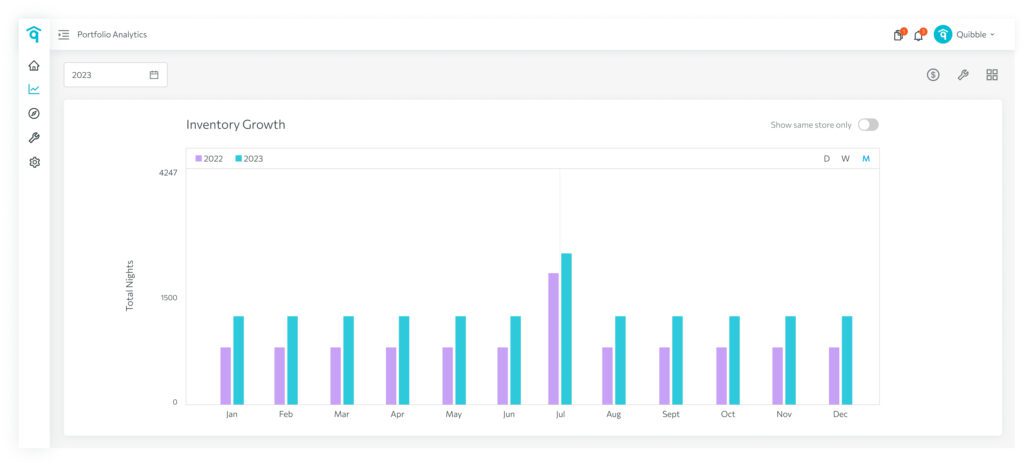
6. Inventory Growth – track the growth of your property inventory to assess expansion and performance.
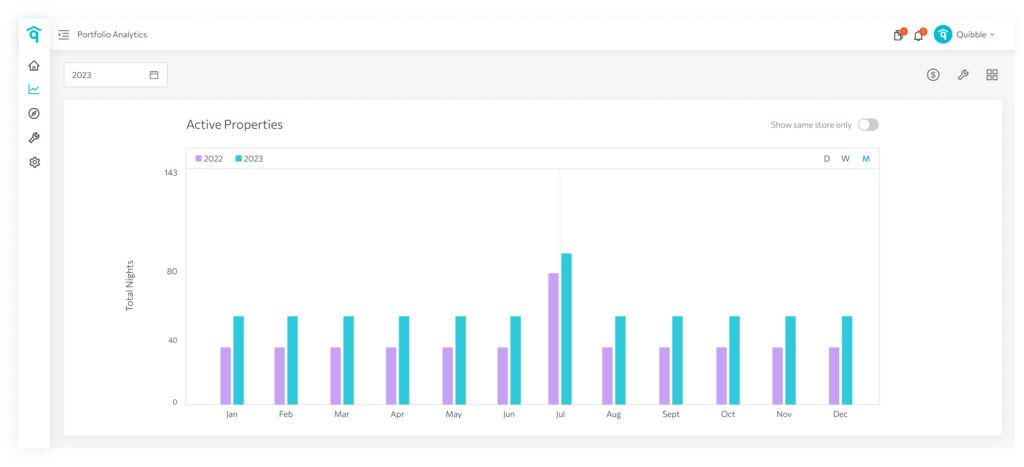
7. Active Properties – stay informed about the number of active properties in your portfolio.
Enhanced Focus with “Show Same Store Only” Toggle:
Refine your view further by toggling on the “Show Same Store Only” filter, allowing you to concentrate specifically on the properties that were in your portfolio last year and are in the portfolio this year. This gives a year over year view that is less affected by inventory change.
Explore the Portfolio Analytics section with these tools at your disposal, and gain a comprehensive understanding of your portfolio’s performance.
Portfolio Buttons and Settings Video

