What’s on this page:
Introduction
When prices go up, people buy less. This is such a fundamental concept in economics that there is a special name for goods that don’t behave this way, they are called Giffen Goods and Veblen Goods. There are so few cases where this occurs that there are special places in econ textbooks dedicated to understanding them.
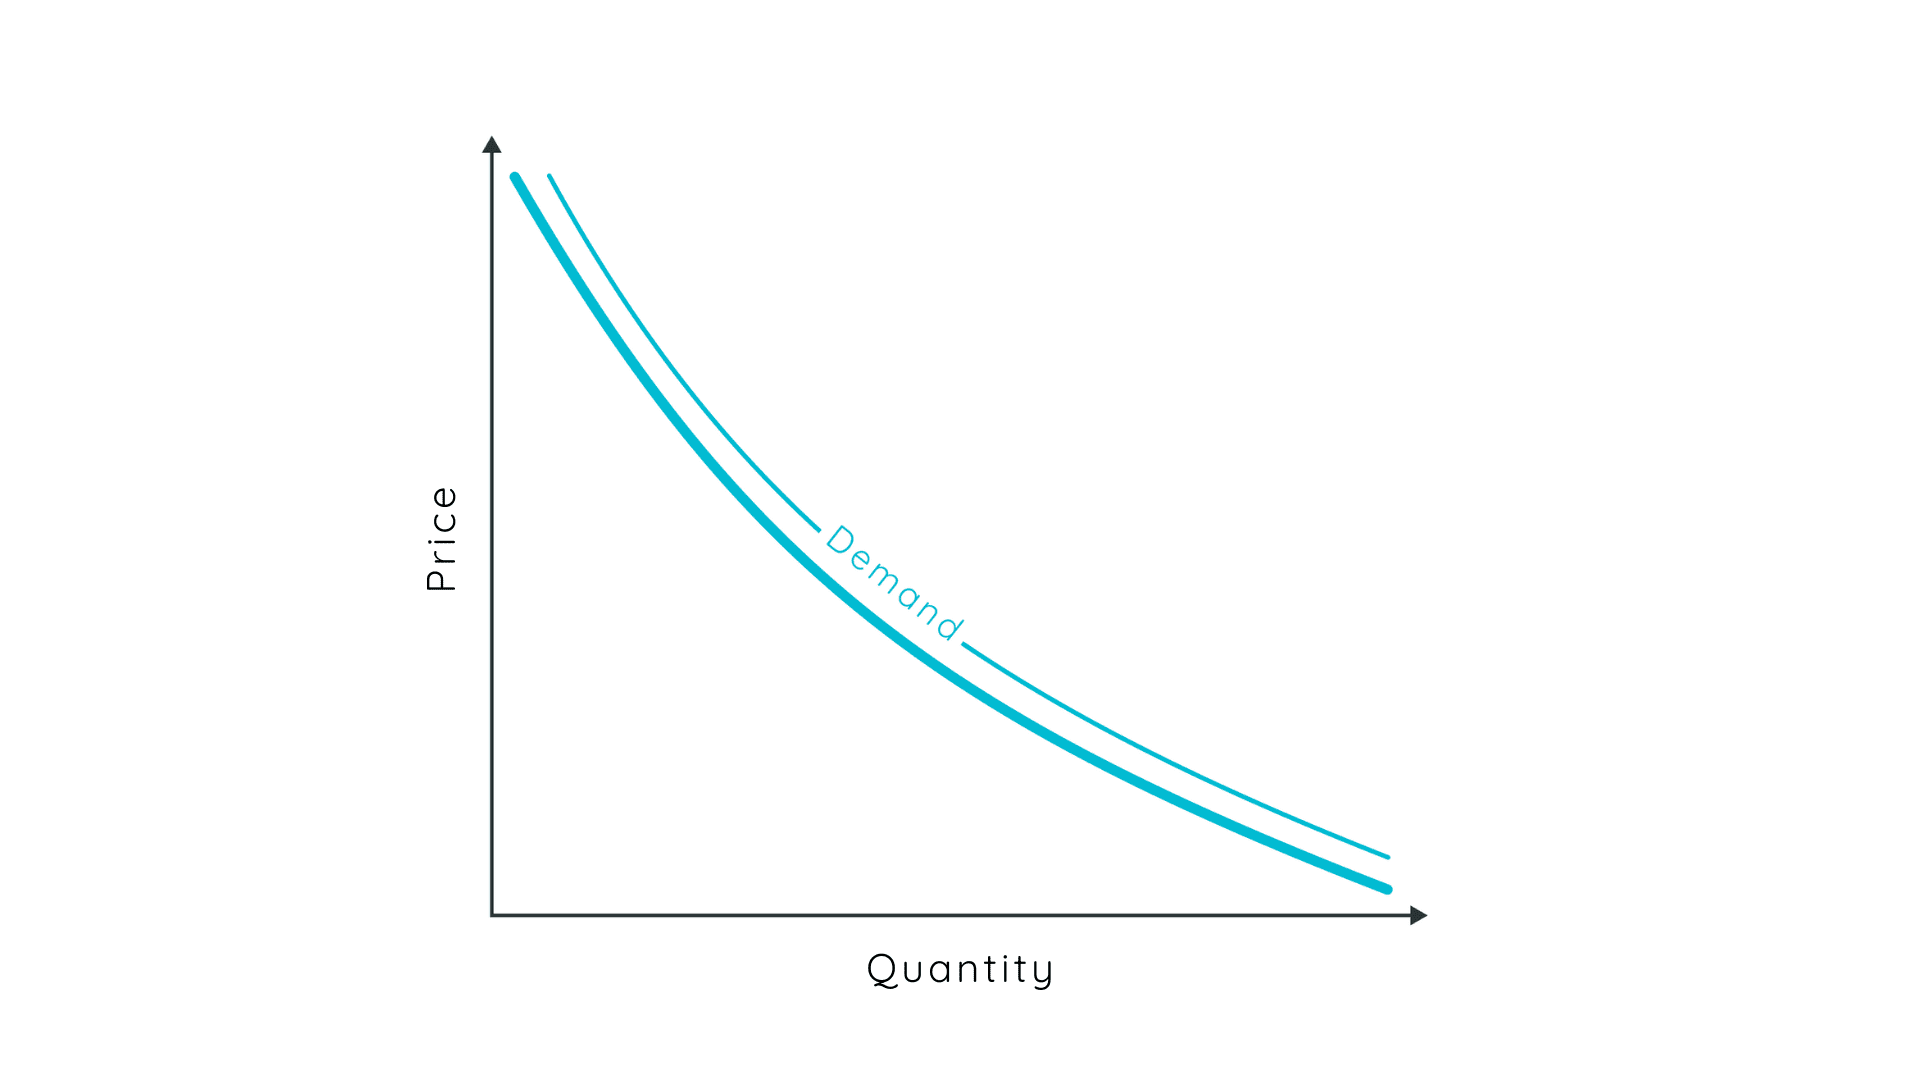
Short-term rentals are not Giffen Goods or Veblen Goods, when the price of a room night goes up people will buy less of it. To be more specific, there will be fewer people willing to purchase it. This is pretty simply explained by a downward-sloping demand curve.
Price Elasticity of Demand
The direction and downward slope of the demand curve indicates the basic concept that people buy less when things are more expensive. What business owners and pricing professionals need to know is, how much less. How much does a price increase reduce demand? This question moves out of the theoretical and into the mathematical. If you do a search for the demand curve and go to the images, half of those images will not have numerical values on either axis. That is largely because demand curves represent a concept, not observational data. Economics textbooks are the same way until you get into econometrics.
When you move into more advanced economics and pricing models, you need to know how much a price change will impact your demand. This is specifically true for optimization-based pricing models, like what we do at quibble.
This measurement is referred to in economics as the Price Elasticity of Demand:
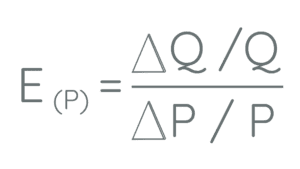
In basic terms, it measures the impact of a price change on the quantity demanded. It can also be described as the slope of the demand curve.
Inelastic Demand and Elastic Demand
There are different types of goods and services that can be bucketed by their price elasticity. These categories are Inelastic and Elastic demand.
Inelastic demand refers to products or services that don’t see a big drop in demand when price increases. The textbook example of a product with inelastic demand is cigarettes. When prices increase for cigarettes people will continue to buy them at a similar rate. They will buy less, just not that much less. The price change has to be pretty substantial to observe a drop in demand. Gasoline prices are similar, as prices go up consumers will not drop the amount they buy that much. For people who commute to work in a car, it takes awhile to find an alternative.
The opposite of this is elastic demand, which means even a small price change will be followed by a significant drop in demand. An interesting example of this is Shell Gasoline. Gasoline as a whole is Inelastic, but if a certain station were to increase its prices consumers would choose to go to a different station. I have always found it humorous when people are willing to go out of their way to get a 2-cent discount per gallon of gasoline. If they are filling up a 15-gallon tank, that is a savings of 30 cents.
STR Demand Type: Elastic or Inelastic
As a pricing manager, knowing what type of demand you are dealing with informs you how to adjust your prices in a chaotic market. Similarly, if you are using a pricing model to set your rates, the model needs to know this value to properly set the price. If you do not know what type of demand you have for your listing, you may end up discounting a property and losing money. Or you could keep prices too high and spoil your inventory. You need to know if your listing is more like cigarettes or Shell gasoline.
At quibble we have been able to turn economic theory into pricing science, by actually measuring the price elasticity of demand for the STR market. The answer to the question of whether STR demands inelastic or elastic……is: Yes.
Segmentation
When we first created the quibble optimization model, we observed large-scale shopping and purchasing data to estimate the price elasticity of demand for STR properties. Then we programmed this into the pricing model and started to optimize rates. The results were pretty good, but just like the decision we made to incorporate our computer vision model, we knew we could do better.

The model seemed to work better for a certain segment of the properties in the market. That segment had certain key attributes in common when we observed price, images, location, etc. We observed that there were different price elasticities for different property segments that we could identify in the data. After we further sliced the data, we ended up with seven unique market segments that all have different price elasticities. Some of these segments have very high elasticity, where a small price change will shut off bookings completely. Other segments have inelastic demand, and price matters much less than quality.
This makes sense when you think about the different types of segments of properties and the buyer’s profiles. If you have a 10-bedroom luxury beach house, it may rent for $1,000 per night. If you increase the price from $1,000 to $1,010 the quantity of demand (potential renters) might not change very much. But, if you have a studio apartment that normally rents for $70 a night, a $10 change will be much more impactful to demand.
When you make pricing adjustments or the pricing model you have selected makes pricing adjustments, the price elasticity should be an important variable to include in your decision.
Results
When we step back and look at the results and what we discovered about the price elasticity, it has some logical implications. The STR market is full of very unique properties in unique regions at varying prices. It makes sense that the demand function is not linear across all of these segments.
The way this works technically in the quibble model is that the price elasticity gets assigned when the property is brought onto the platform. We have an onboarding process that automatically assigns a customized comp set to each property that we optimize. In this process, we evaluate the property’s attributes to find its best competitors, the ones that are most likely to appear on the screen next to the property in search. It is in this process that we can determine the right price elasticity to assign the property.
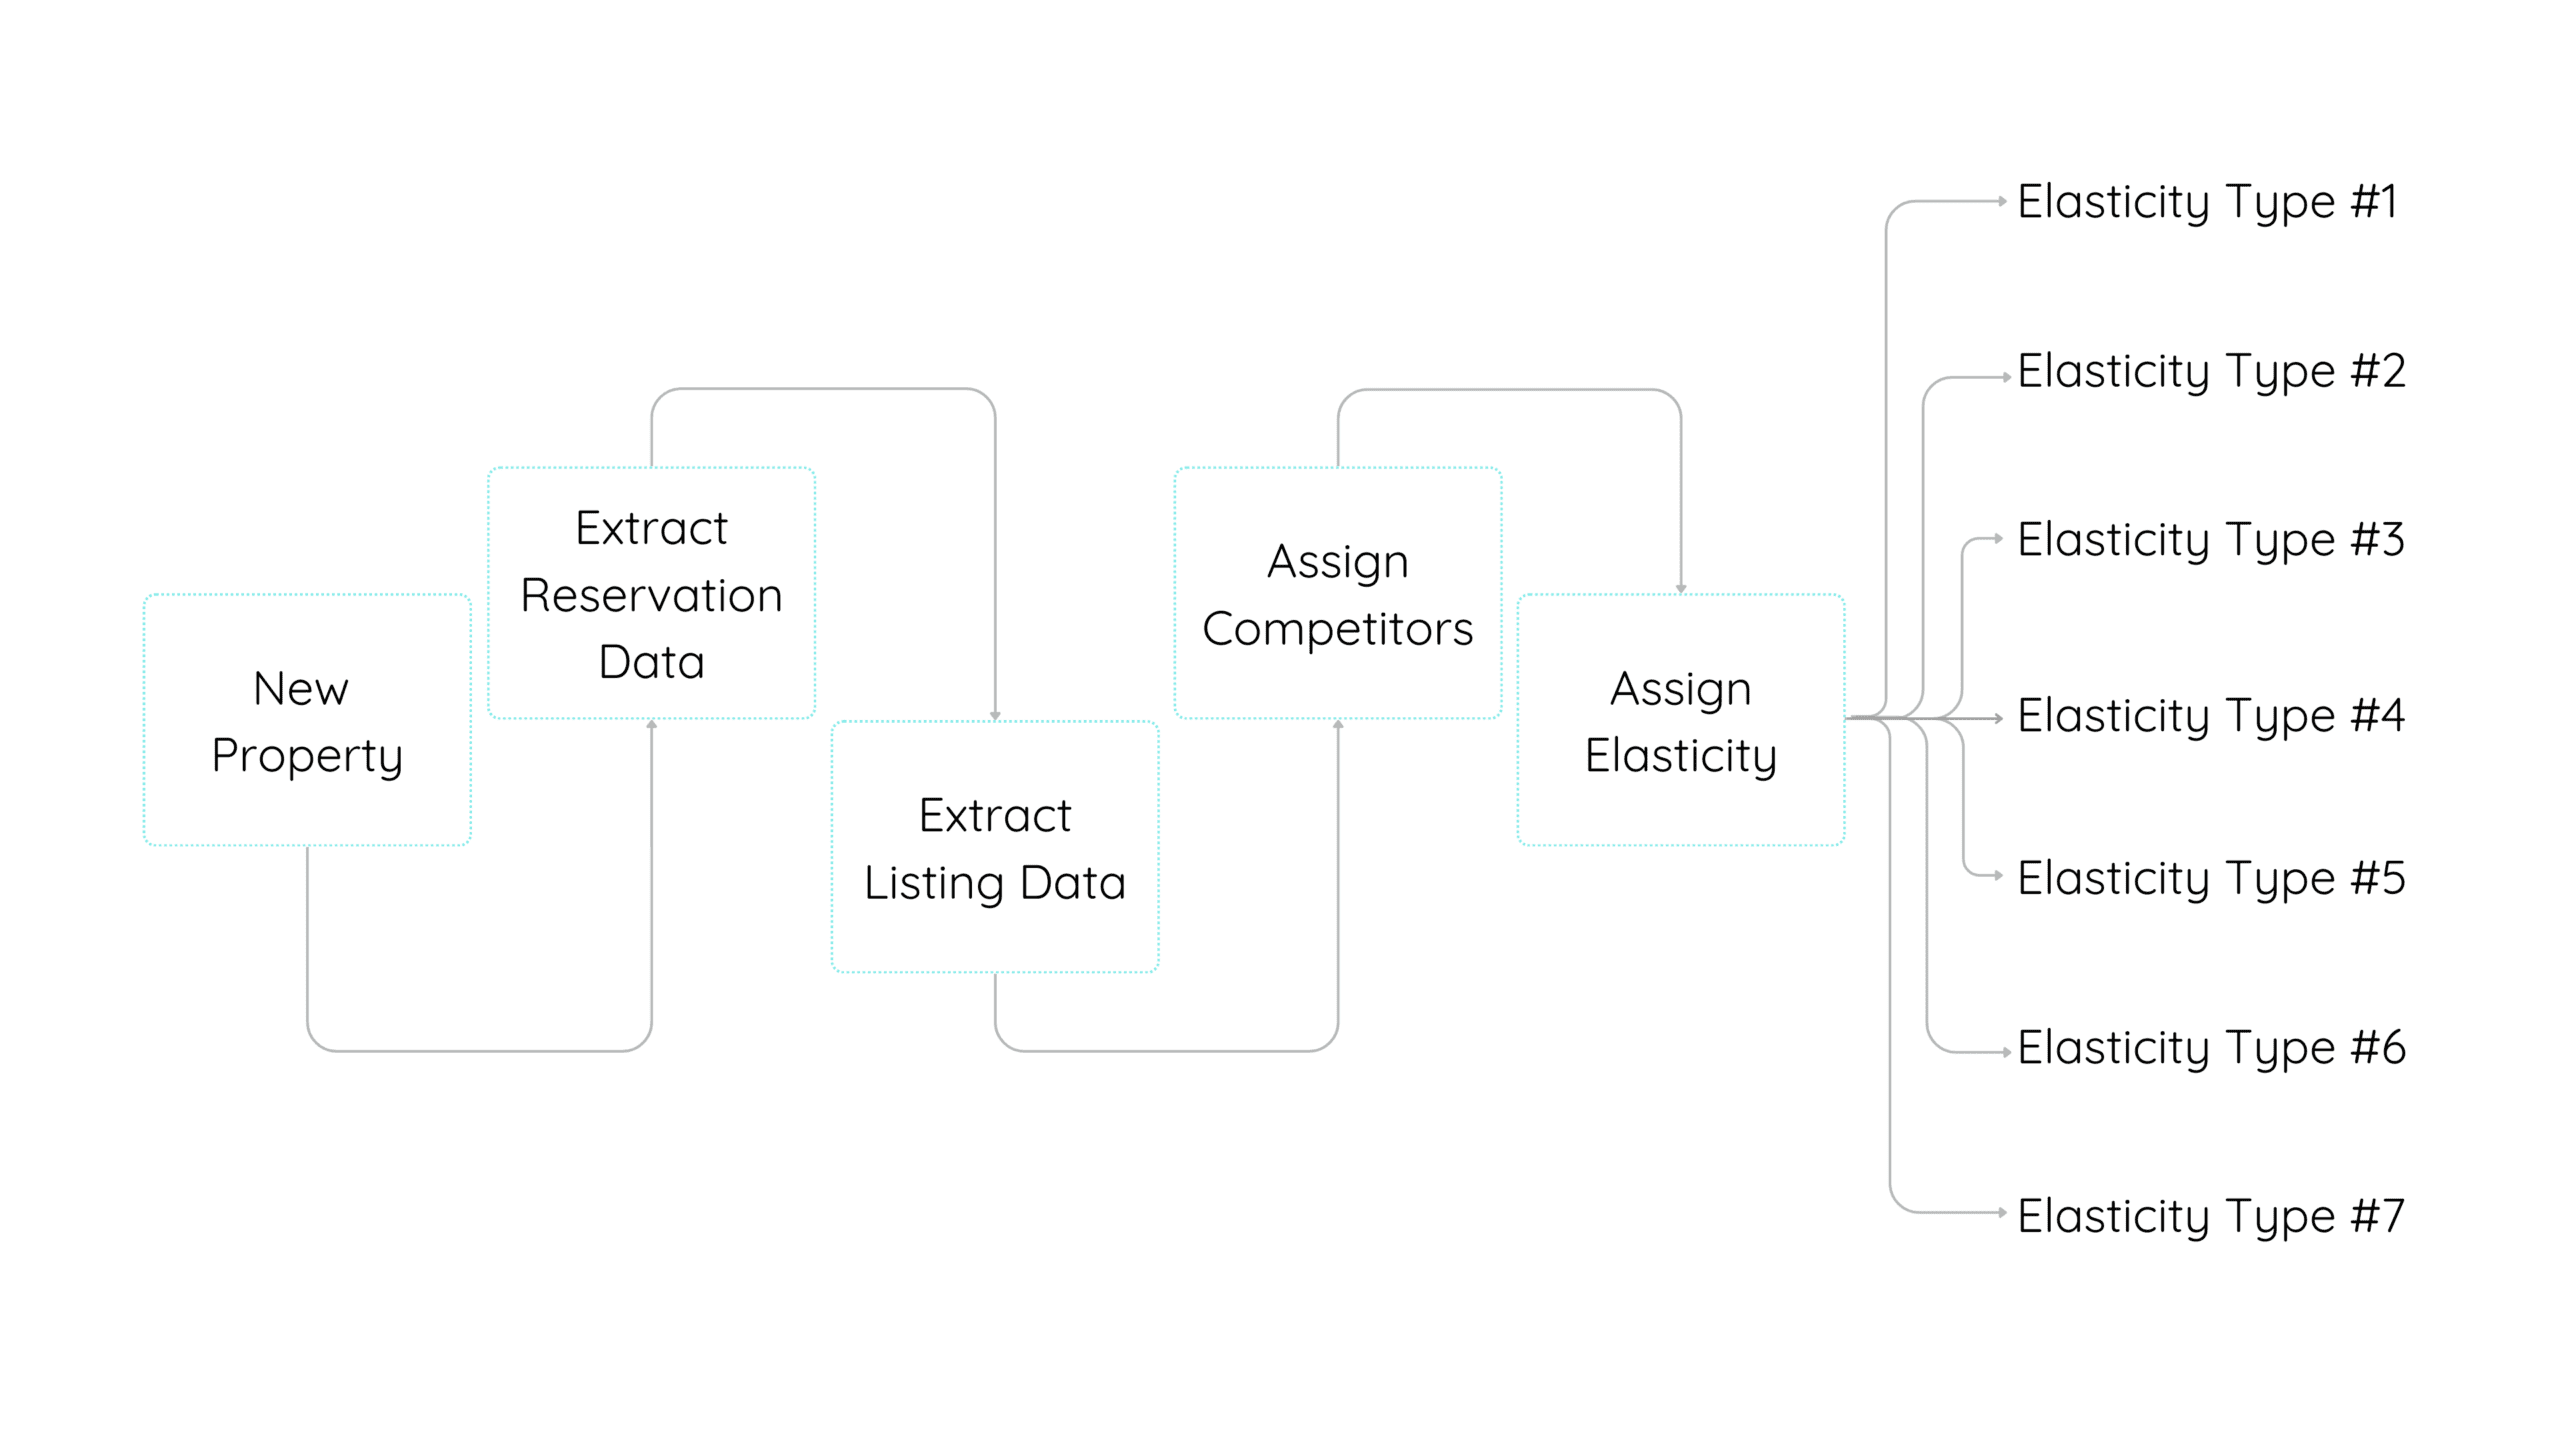
The quibble pricing model is constantly being improved. As new properties come onto the platform we identify what property segment they belong to and assign the property elasticity for that listing. The better job the model can do at understanding price elasticity, the better job it can do optimizing the nightly rates. We found seven unique segments so far, but as we continue to expand into different regions the segments too could expand.
💎 Recommendations
Quibble has released the only price optimization software available to the STR property manager. This model is setting a new standard for our industry. A large difference between the quibble model and the rest of the market is that optimization models use probability and prediction to set prices. To be a good revenue manager, you need to think in terms of probabilities.
If you are considering upgrading to the quibble optimization model you will need to account for the fact that optimization models are more complex and there are switching costs involved in the cutover. The advantages far outweigh the costs, but there is an investment needed if you want to capture additional revenue. Calculating and assigning the price elasticity of demand will be done behind the scenes, but the concept is important for you and your team to understand when launching this type of model.
“The advantages far outweigh the costs, but there is an investment needed if you want to capture additional revenue.”