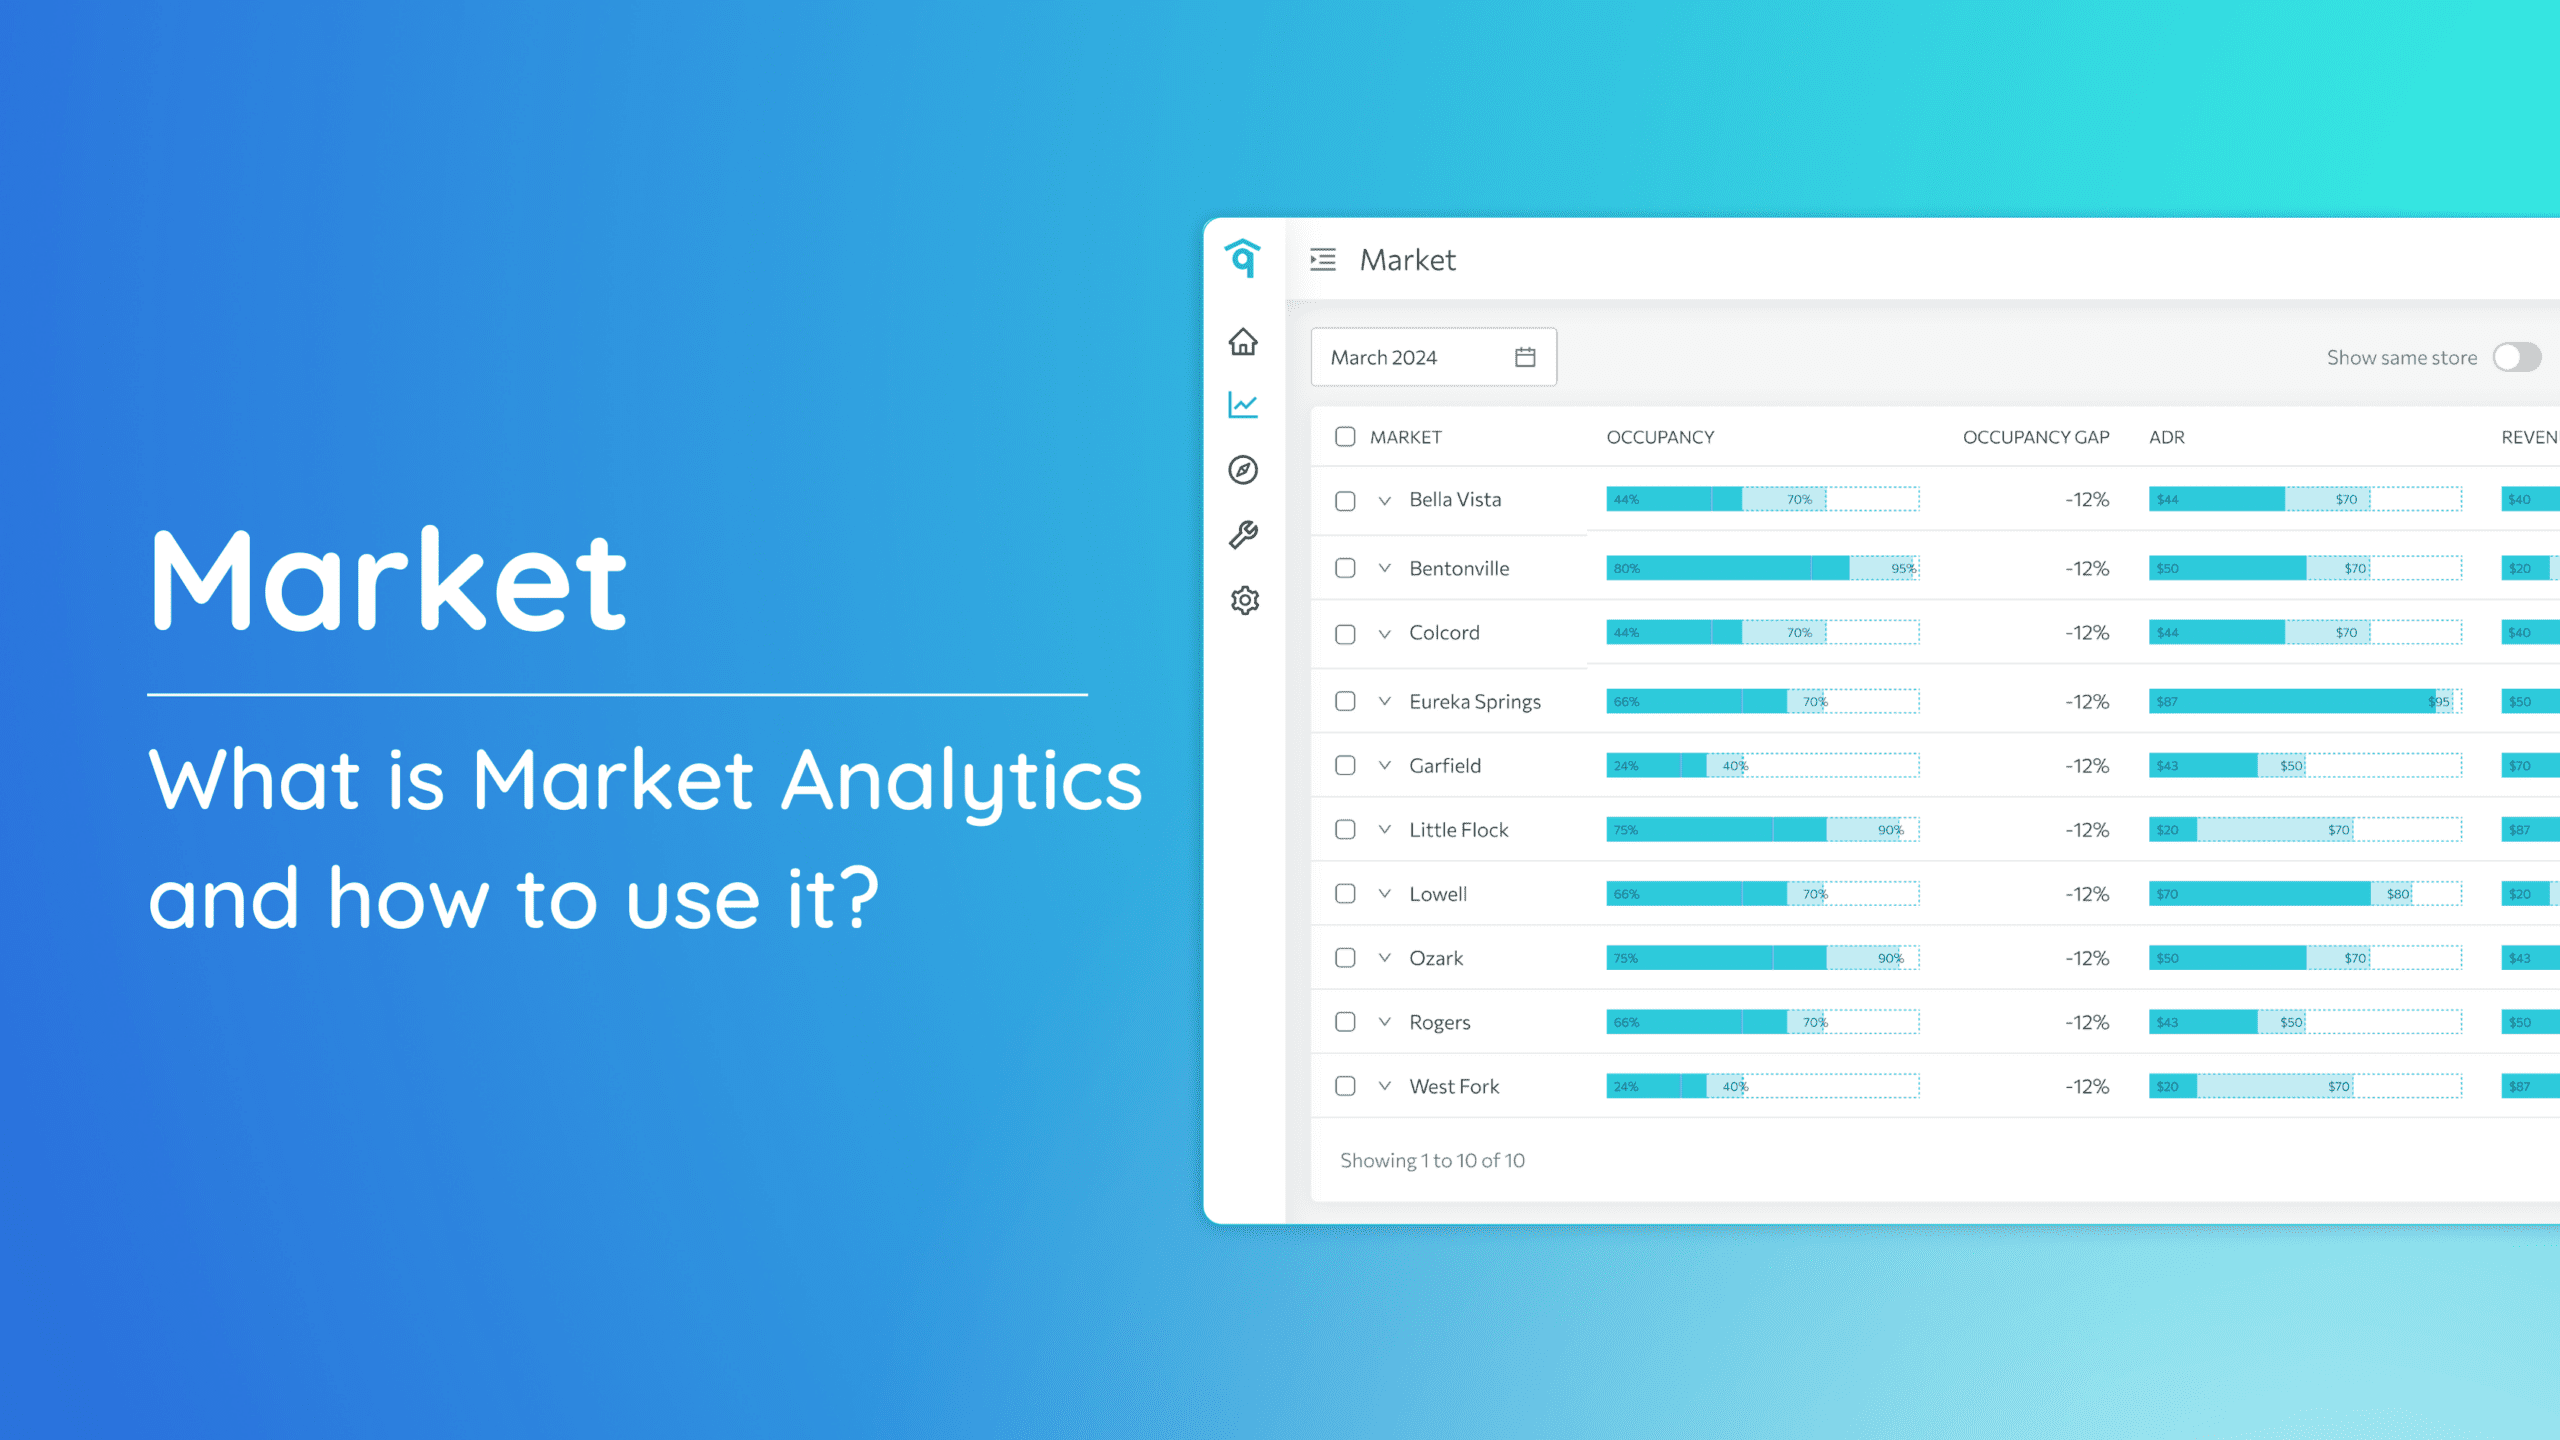
Property Analytics serves as a dynamic tool empowering users to effortlessly track key metrics like occupancy rate, gap, ADR (Average Daily Rate), revenue, and blocked days at a property level. This feature provides the ability to make precise price adjustments for optimizing each property’s performance.
Accessing Property Analytics:
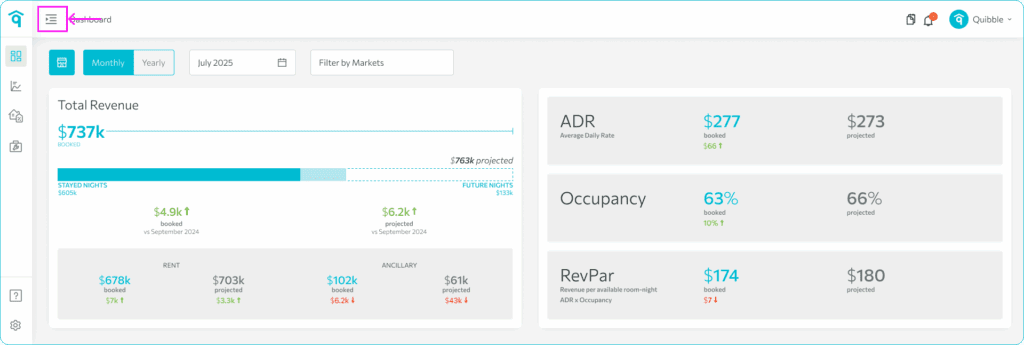
- Navigate to the left-side menu bar.
2. Click on the “Analytics” dropdown and select “Property”.
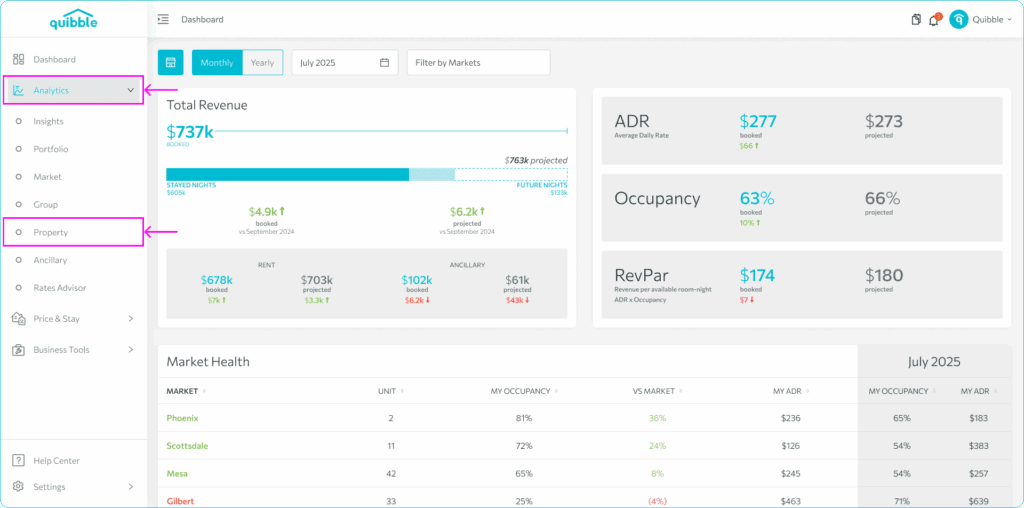
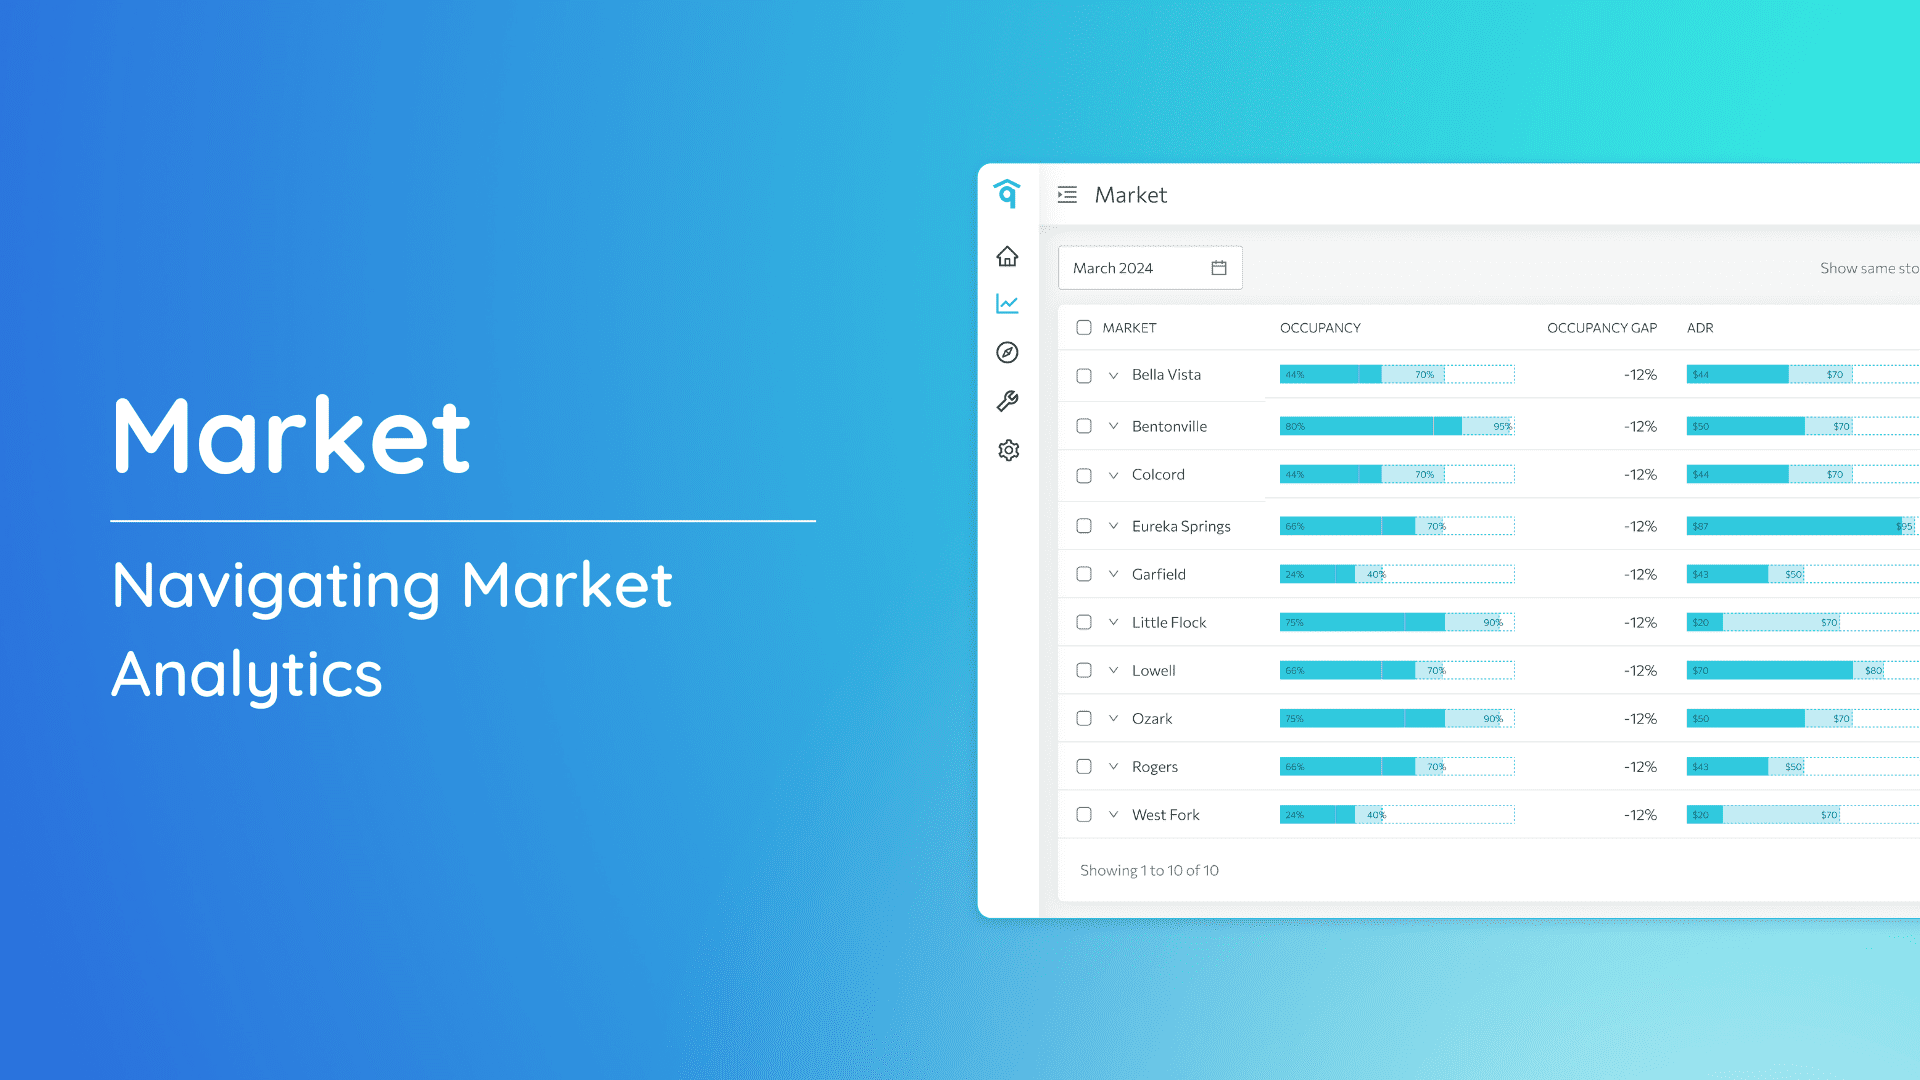
NAVIGATING
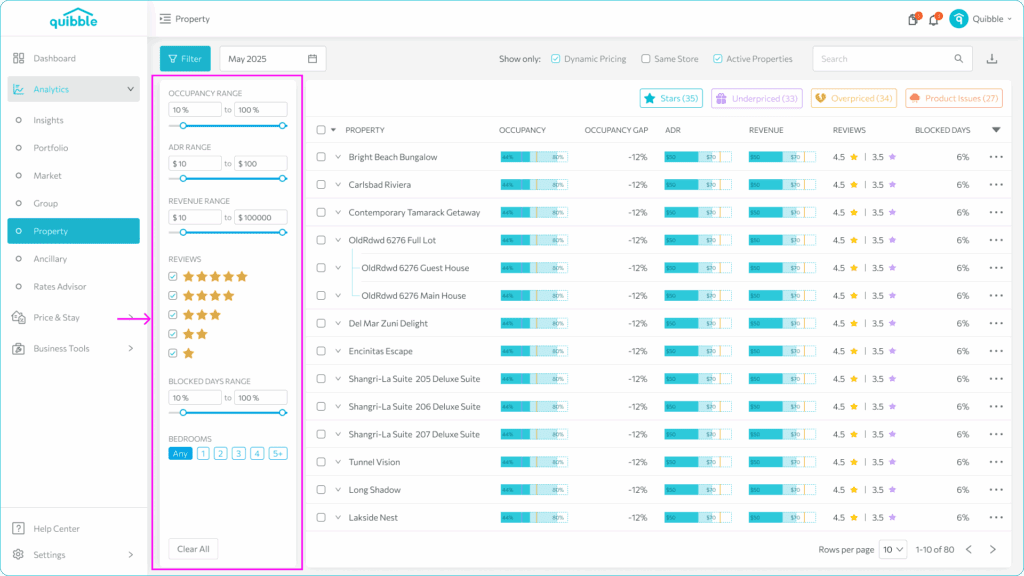
Key Metrics Filter
This additional filter option allows you to view property analytics more precisely. By clicking the “Filter” button on the upper right of the Property page, you can filter key metrics such as the following:
- Occupancy Range
- ADR Range
- Revenue Range
- Blocked Days Range
- Number of Bedrooms
Dynamic Pricing
Filters the properties enabled for Dynamic Pricing

Utilizing Show Same store
Same store is designed to reduce the impact of inventory change on the comparative metrics. This filters to only the properties that existed last year AND still exist this year. New and less mature properties will be excluded when this filter is selected.

Understanding “Active Properties Only”
This filter removes any inactive properties from the analytics.

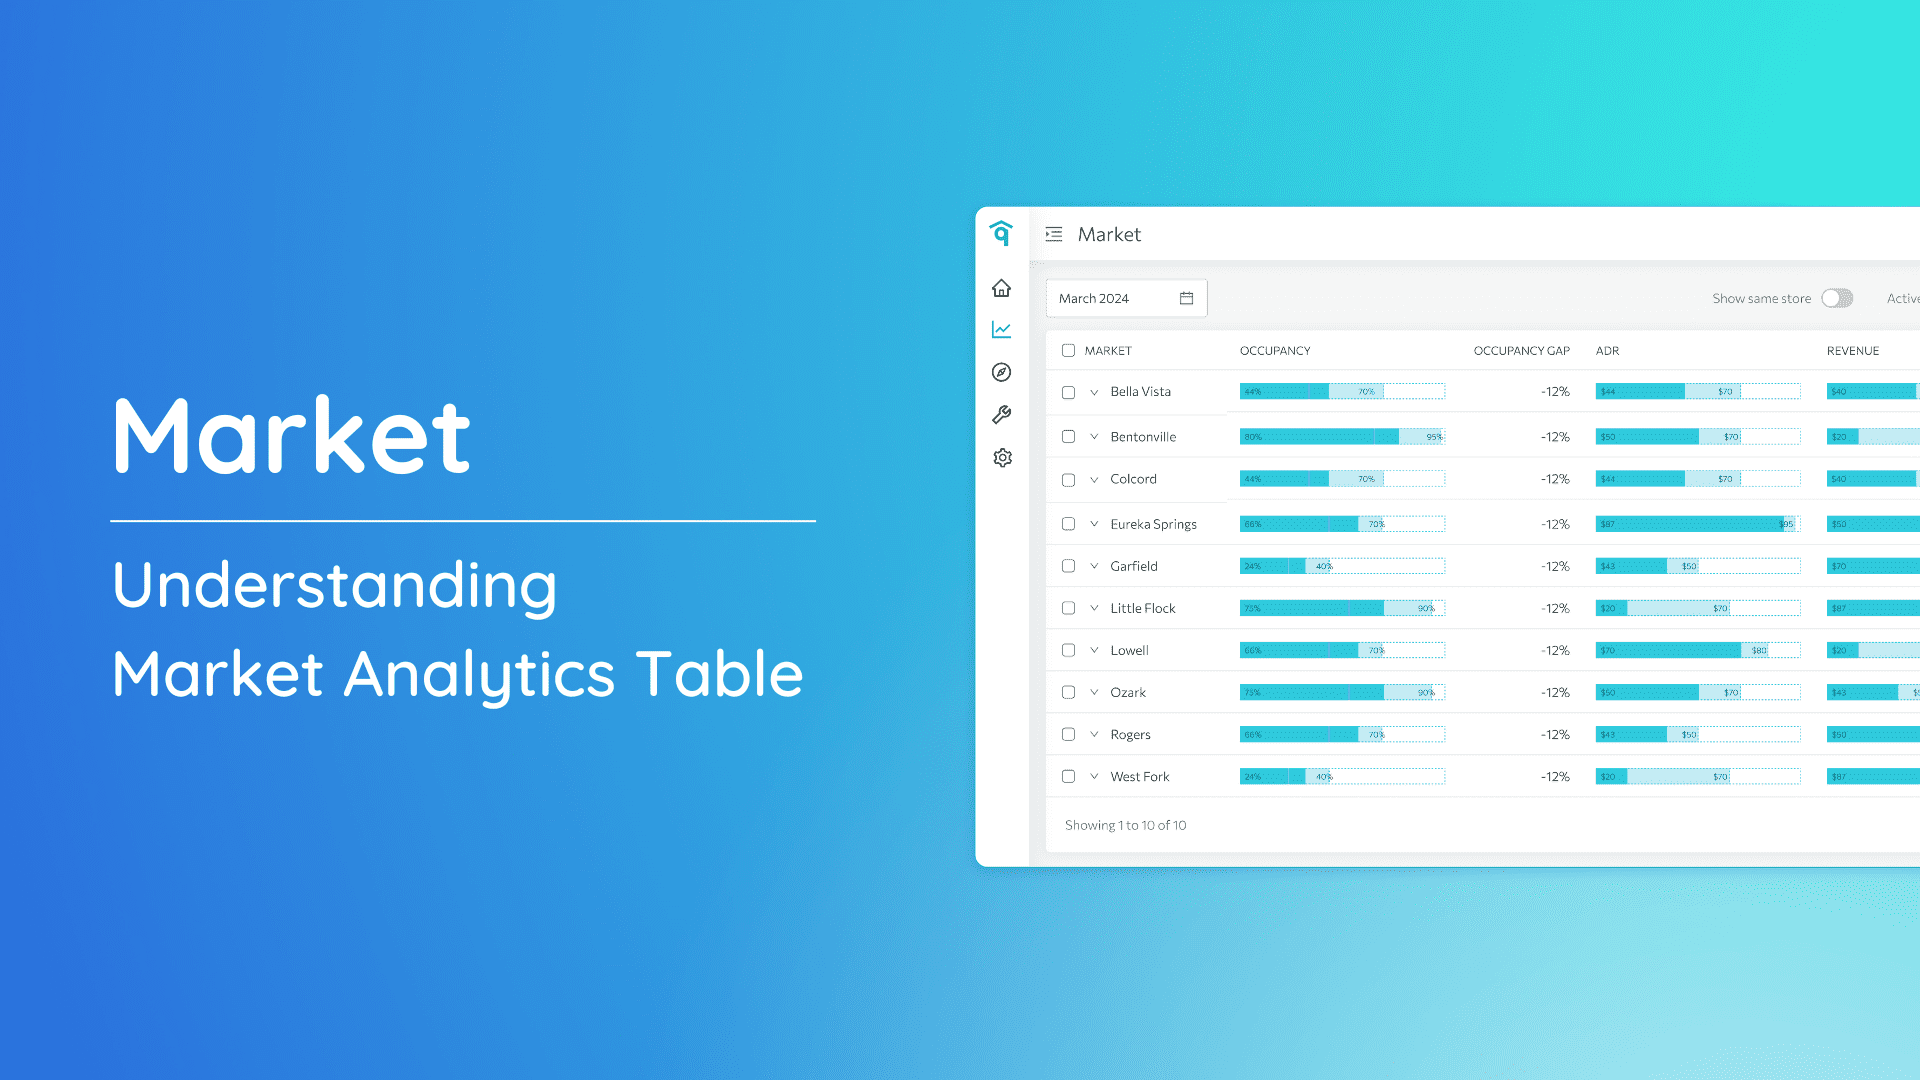
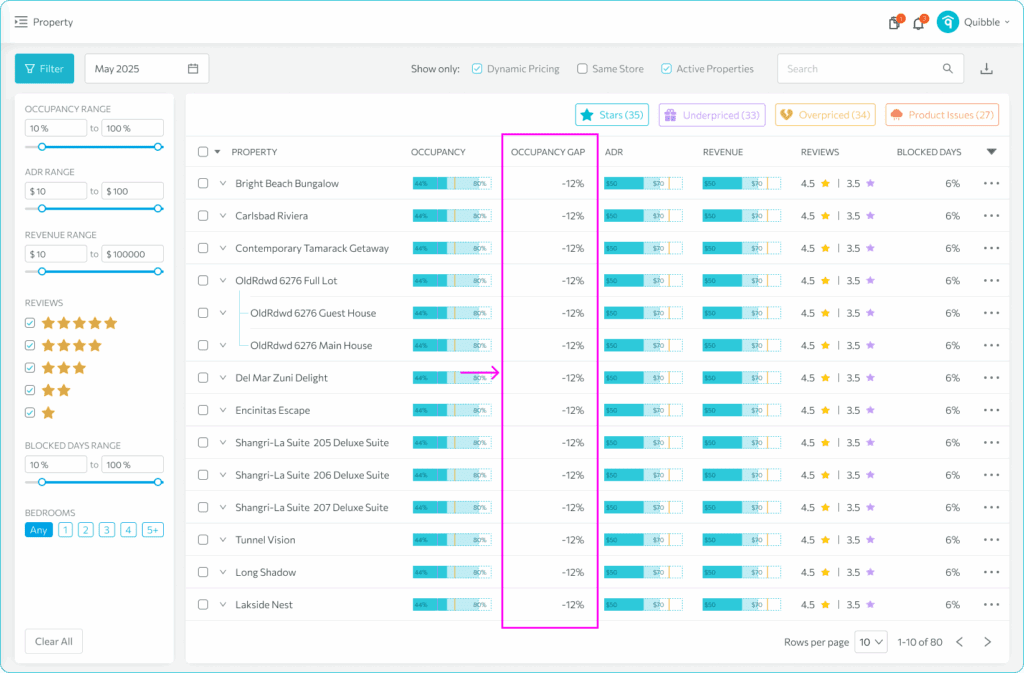
What is the Occupancy Gap?
The Occupancy Gap is a comparison of the current value, compared to that same value last year at the same point in time. Another way to describe this would be like this: our current occupancy is 45%. Last year, at this time, we were booked to 40%. The Occupancy Gap would be 5 because we are 5 points ahead of last year.
What are Reviews?
These are the review scores collected from the OTA channels. The first value is for the managed properties. The second value is for the surrounding market.
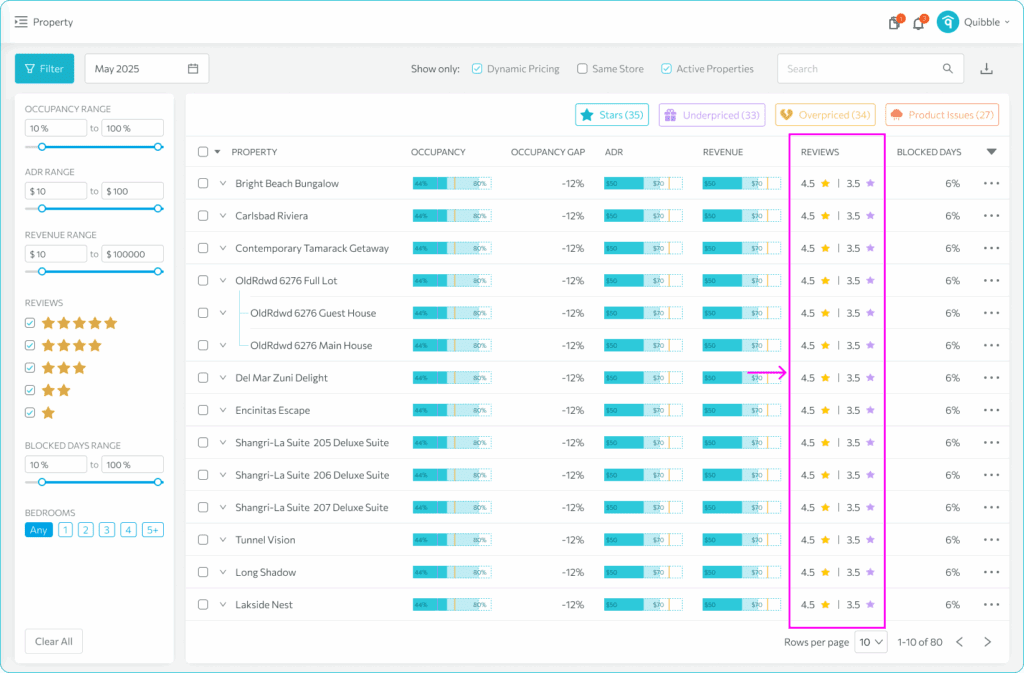
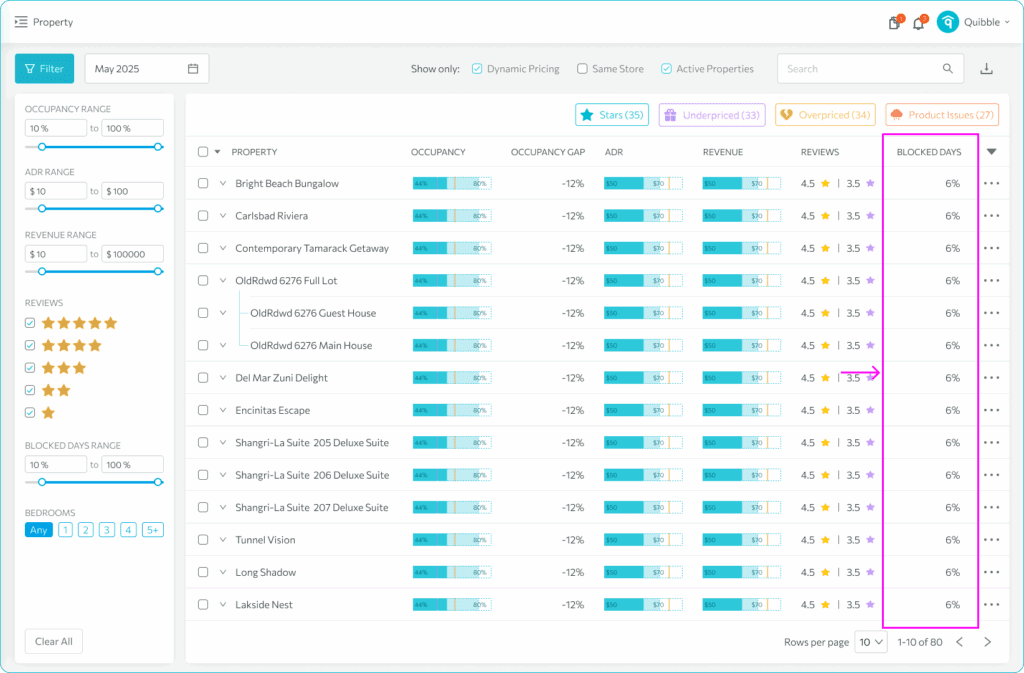
What are Blocked Days?
Blocked Days are specific days when the property is neither reserved nor available. Typically, owners block off these days for private use or maintenance purposes. It’s a way to manage the property’s availability and ensure it aligns with the owner’s personal or maintenance schedule.
These days are excluded from the Occupancy calculation.
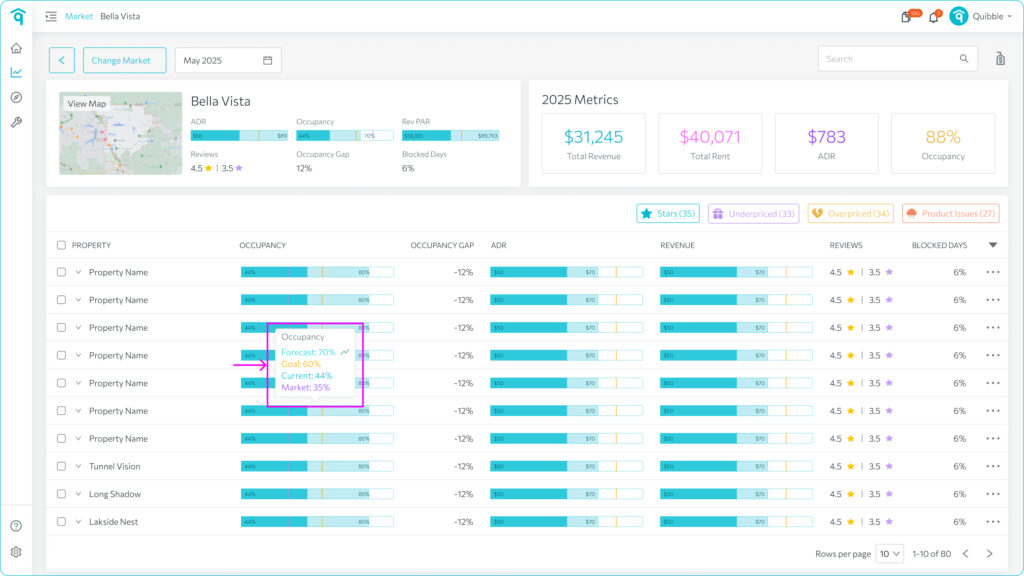
Checking Forecasted Occupancy, ADR, and Revenue:
On the Property page, simply hover over the graph to observe current, forecasted and market data. This offers a quick and easy method to evaluate whether expected occupancy, ADR, and revenue goals will be met.
Current – this is the current value for everything booked in the selected period.
Forecast – the projected final position of this metric based on historical trends.
Market – the current position of the surrounding market for the selected period.
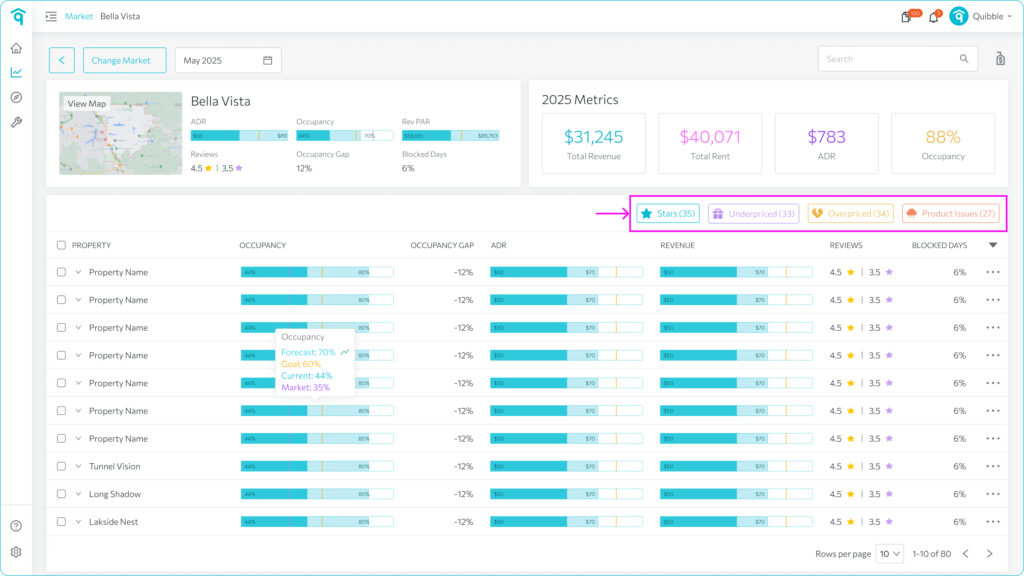
Filter options
Effortlessly target pertinent property data using our user-friendly filter options. These filters, including Stars, Underpriced, Overpriced, and Product Issues, empower you to make well-informed decisions for your pricing strategies.
Stars – Identify markets with higher occupancy than the market average and higher ADR compared to the previous month.
Underpriced – Locate markets with higher occupancy than the market average but lower ADR than the previous month.
Overpriced – Find markets with lower occupancy than the market average but higher ADR than the previous month.
Product Issues – Review markets with lower occupancy than the market average and lower ADR than the previous month.
Join our newsletter
Dominate the short-term rental market with cutting-edge trends


Join our newsletter
Dominate the short-term rental market with cutting-edge trends