What is Group Analytics and how to use it?
The Group Analytics Page provides a centralized view of performance metrics for all properties within a group. In addition to reviewing data like occupancy, ADR, and booking trends, you can also make real-time pricing adjustments.
Accessing Group Analytics:
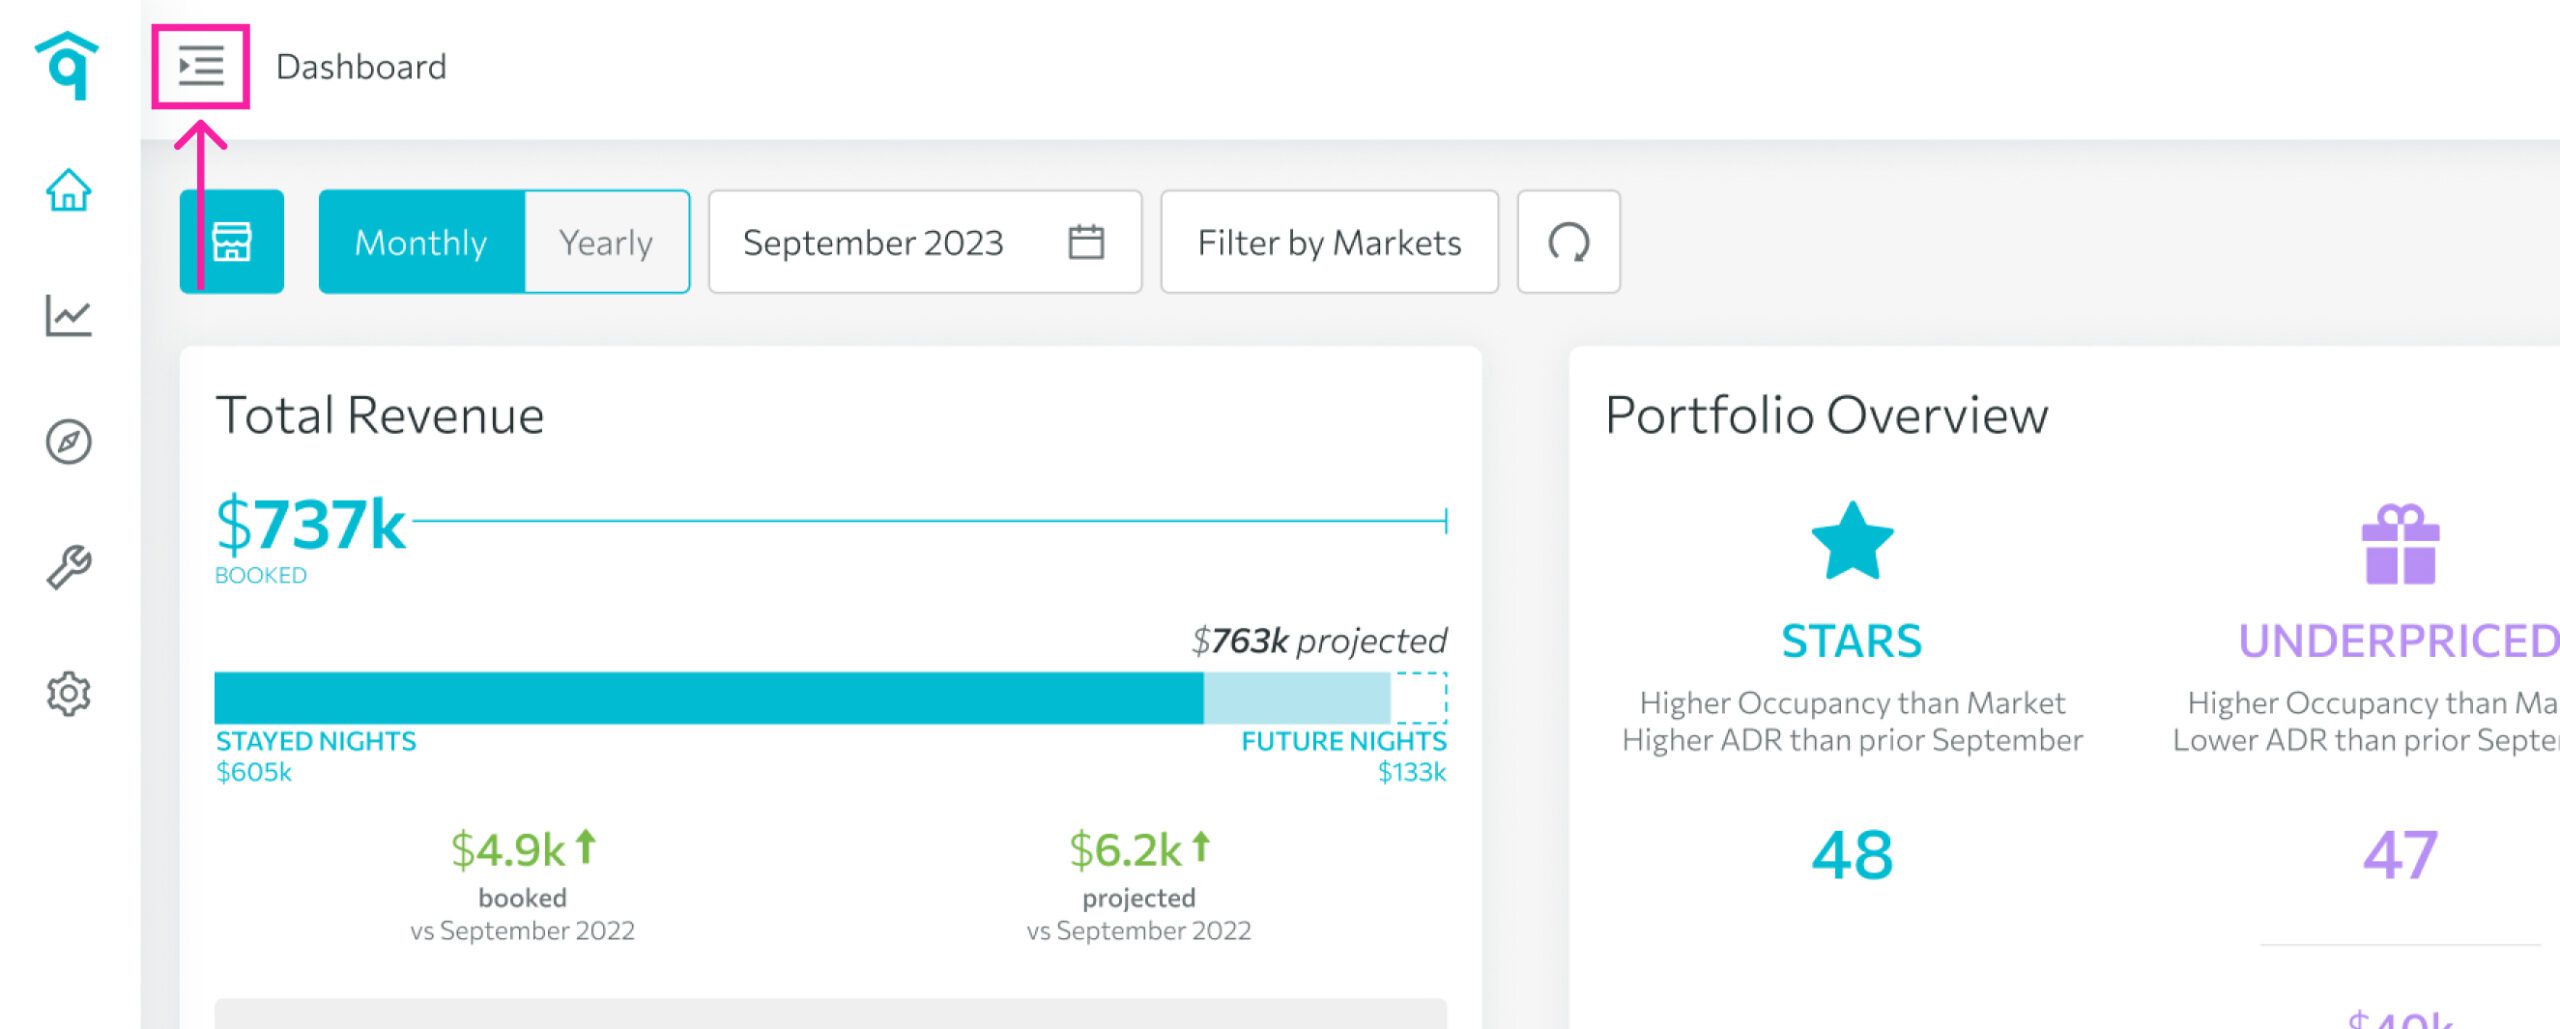
- To access the Group Analytics page, click the left-hand side menu.
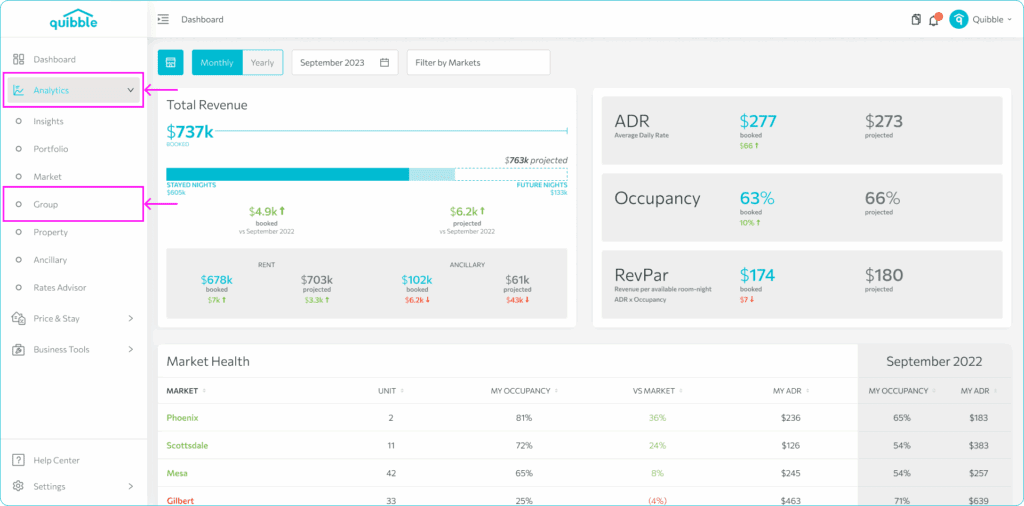
2. Select Analytics and click Group.
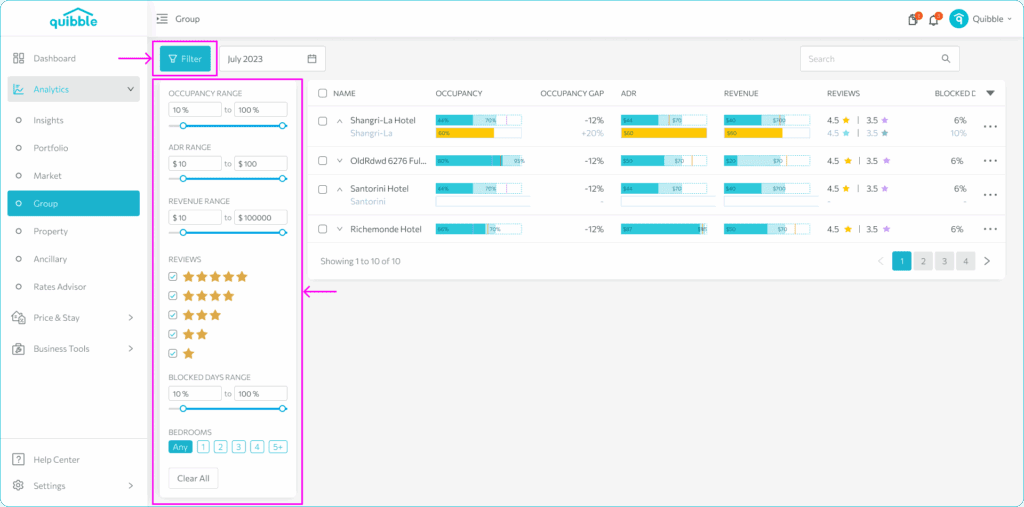
3. On the Group Analytics page, the Filter button gives you options how to filter the data you wish to be displayed.
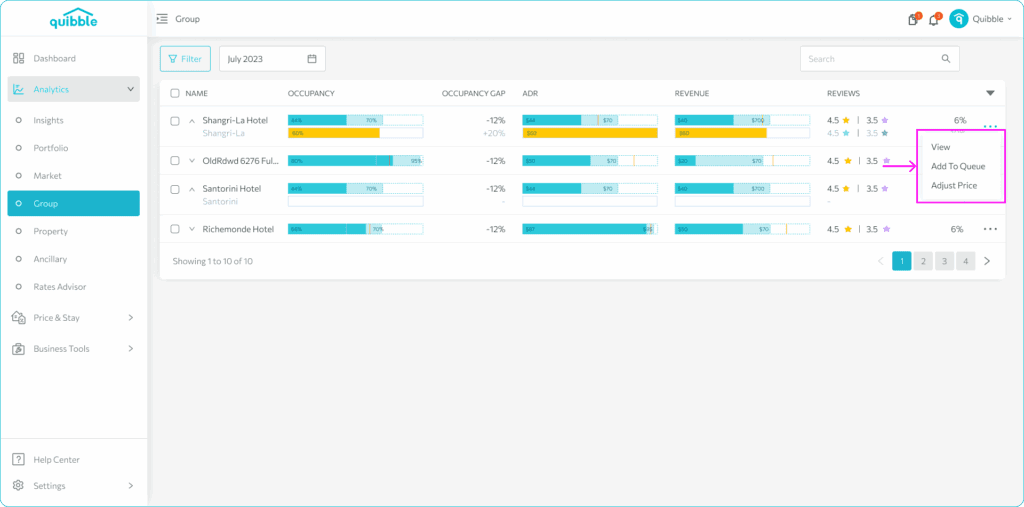
4. Clicking the three dot icon to the right of a specific group gives you options to either View the group details page, adjust pricing for the group or Add to Queue.
Similar to the Markets Analytics view, the Group Analytics page shows the key metric trends but this time for each of the specific groups you have customized. On this page, you will be able to see the group’s performance and trends, and hovering on the table shows the actual values.
Feel free to visit the help article on managing Property Groups for more information.
Join our newsletter
Dominate the short-term rental market with cutting-edge trends


Join our newsletter
Dominate the short-term rental market with cutting-edge trends