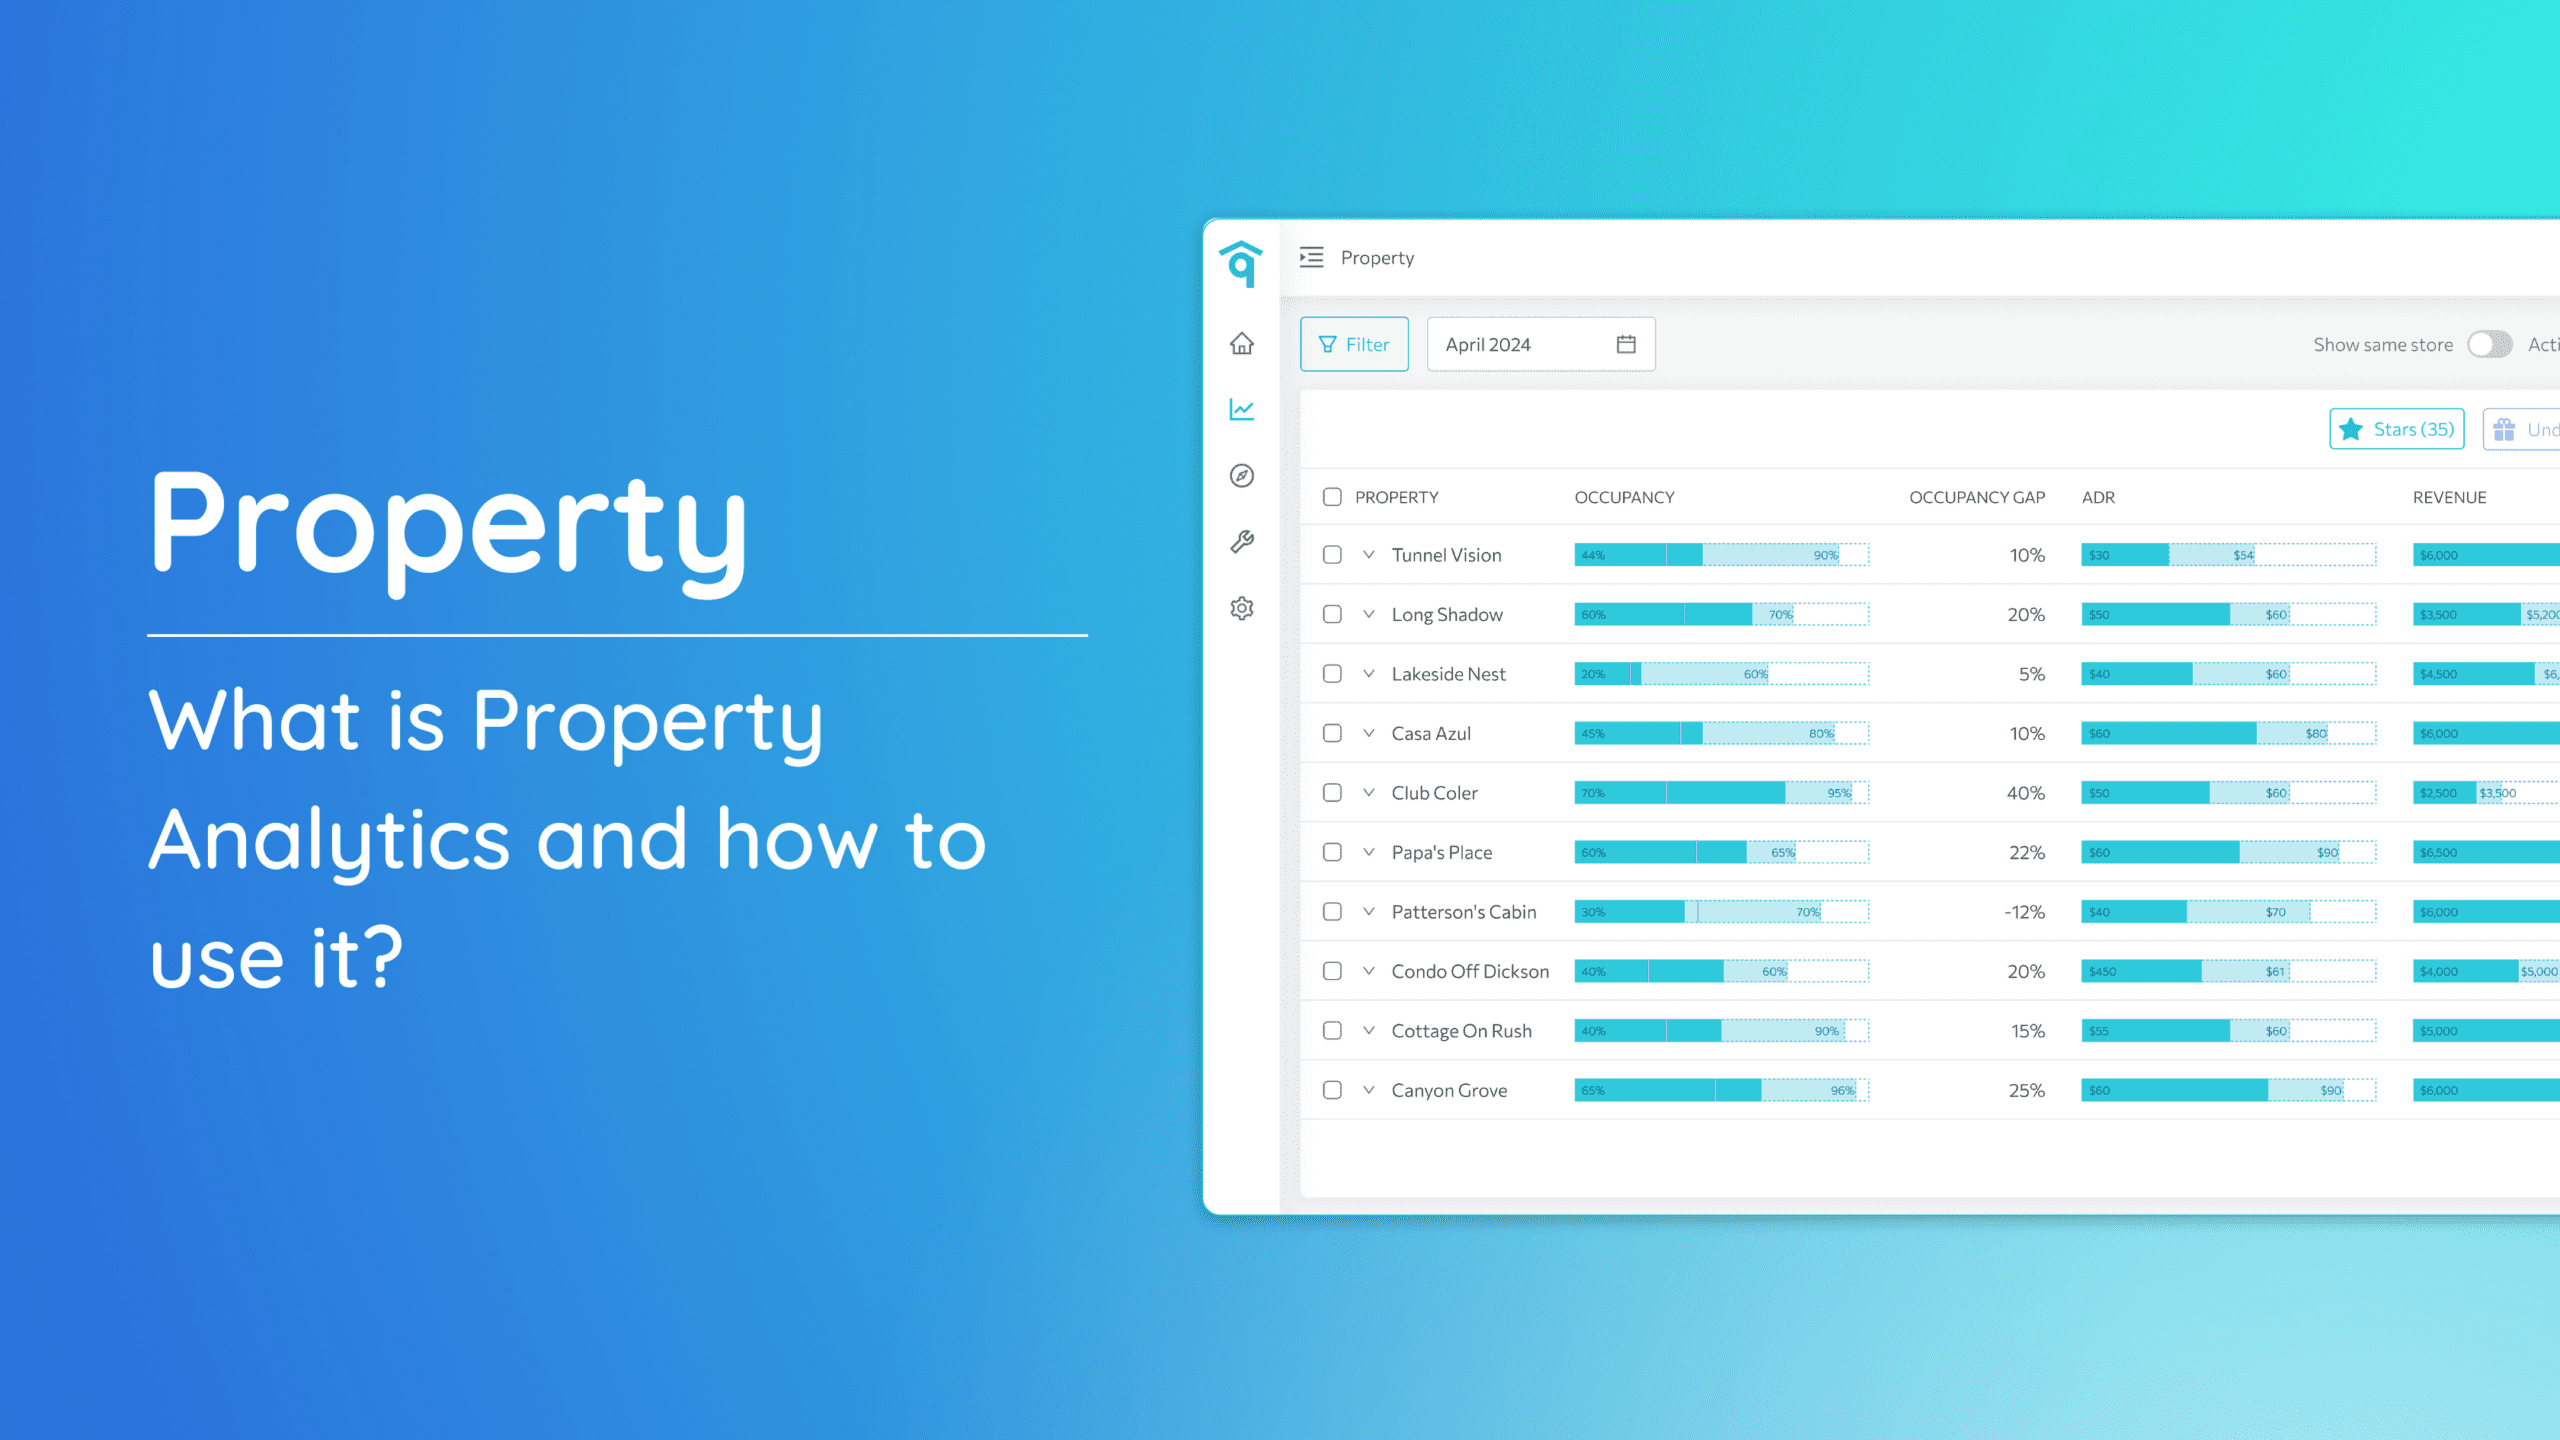
The Portfolio Analytics page is where you can gain valuable insights into the performance of your overall properties at the portfolio level. Dive into seven essential metrics, each providing a unique perspective on your yearly data.
Customizing your portfolio charts is a powerful way to monitor the performance of your short-term rental properties. By selecting the metrics most relevant to your goals—like occupancy rate, ADR, or revenue—you can create a tailored view that highlights key insights. This guide will walk you through the simple steps to configure your portfolio charts and take a more strategic approach to your data analysis.
Configuring the Charts:
- On the Portfolio Analytics page, look for a wrench icon on the upper-right corner and select which key metrics you want to view, such as occupancy rate, average daily rate (ADR), revenue, bookings, and other relevant metrics.
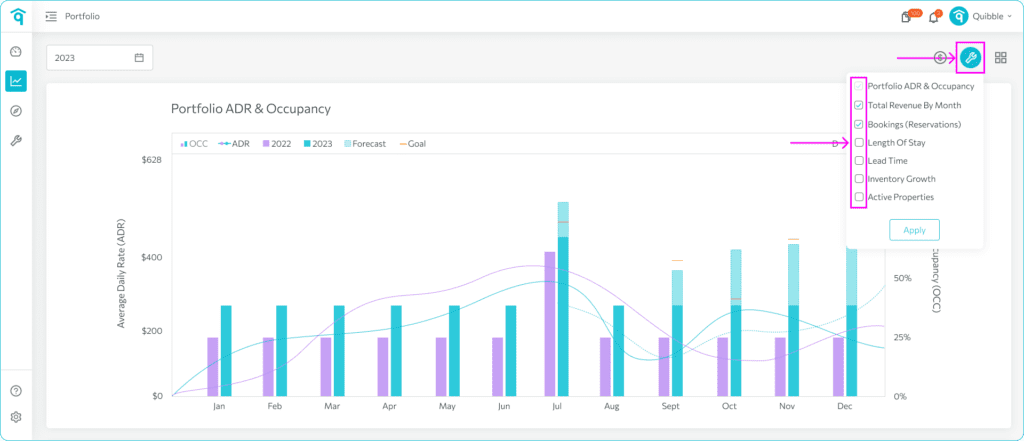
2. The first chart you will see is Portfolio ADR & Occupancy. This chart allows you to understand the Average Daily Rate (ADR) and Occupancy which are crucial indicators of your portfolio’s revenue and occupancy levels.
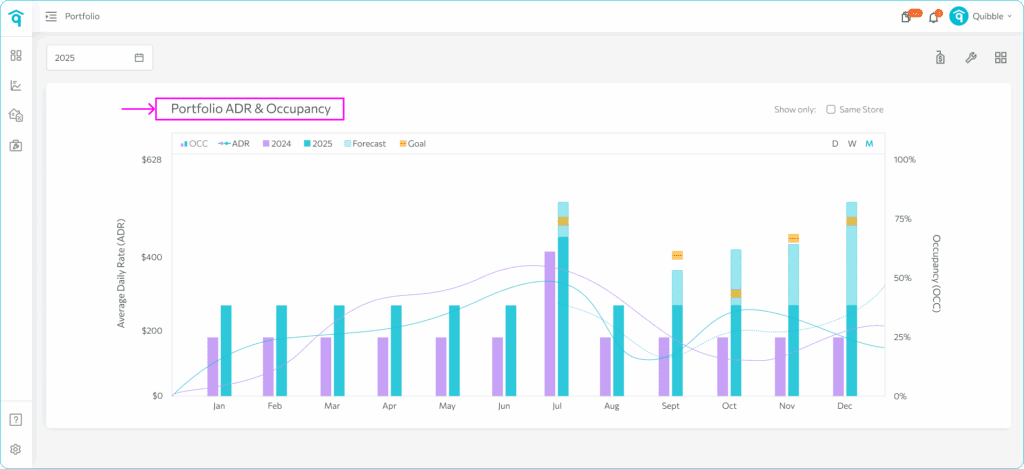
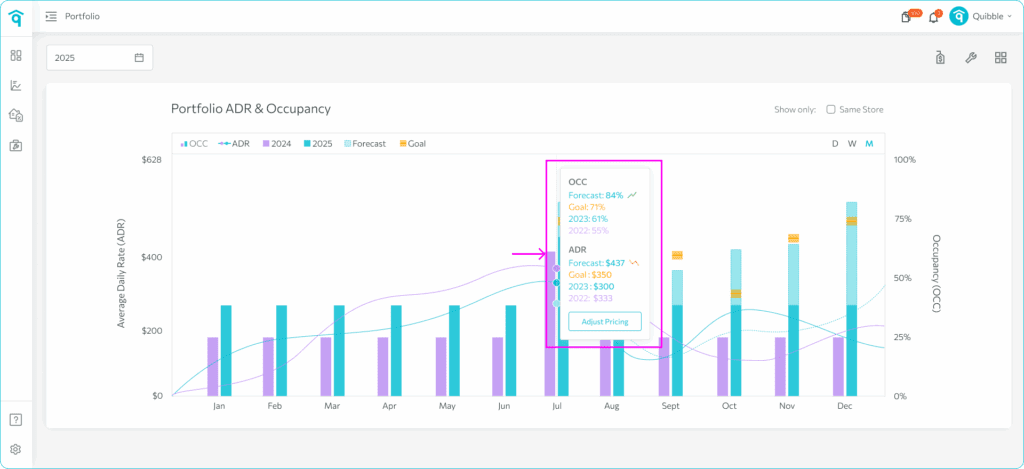
3. The chart shows the comparison lines which indicates the average daily rate, comparing it to last year’s data. Hovering on the graph will show the exact ADR and occupancy values. Forecast is a predicted value generalized from historical trended data.
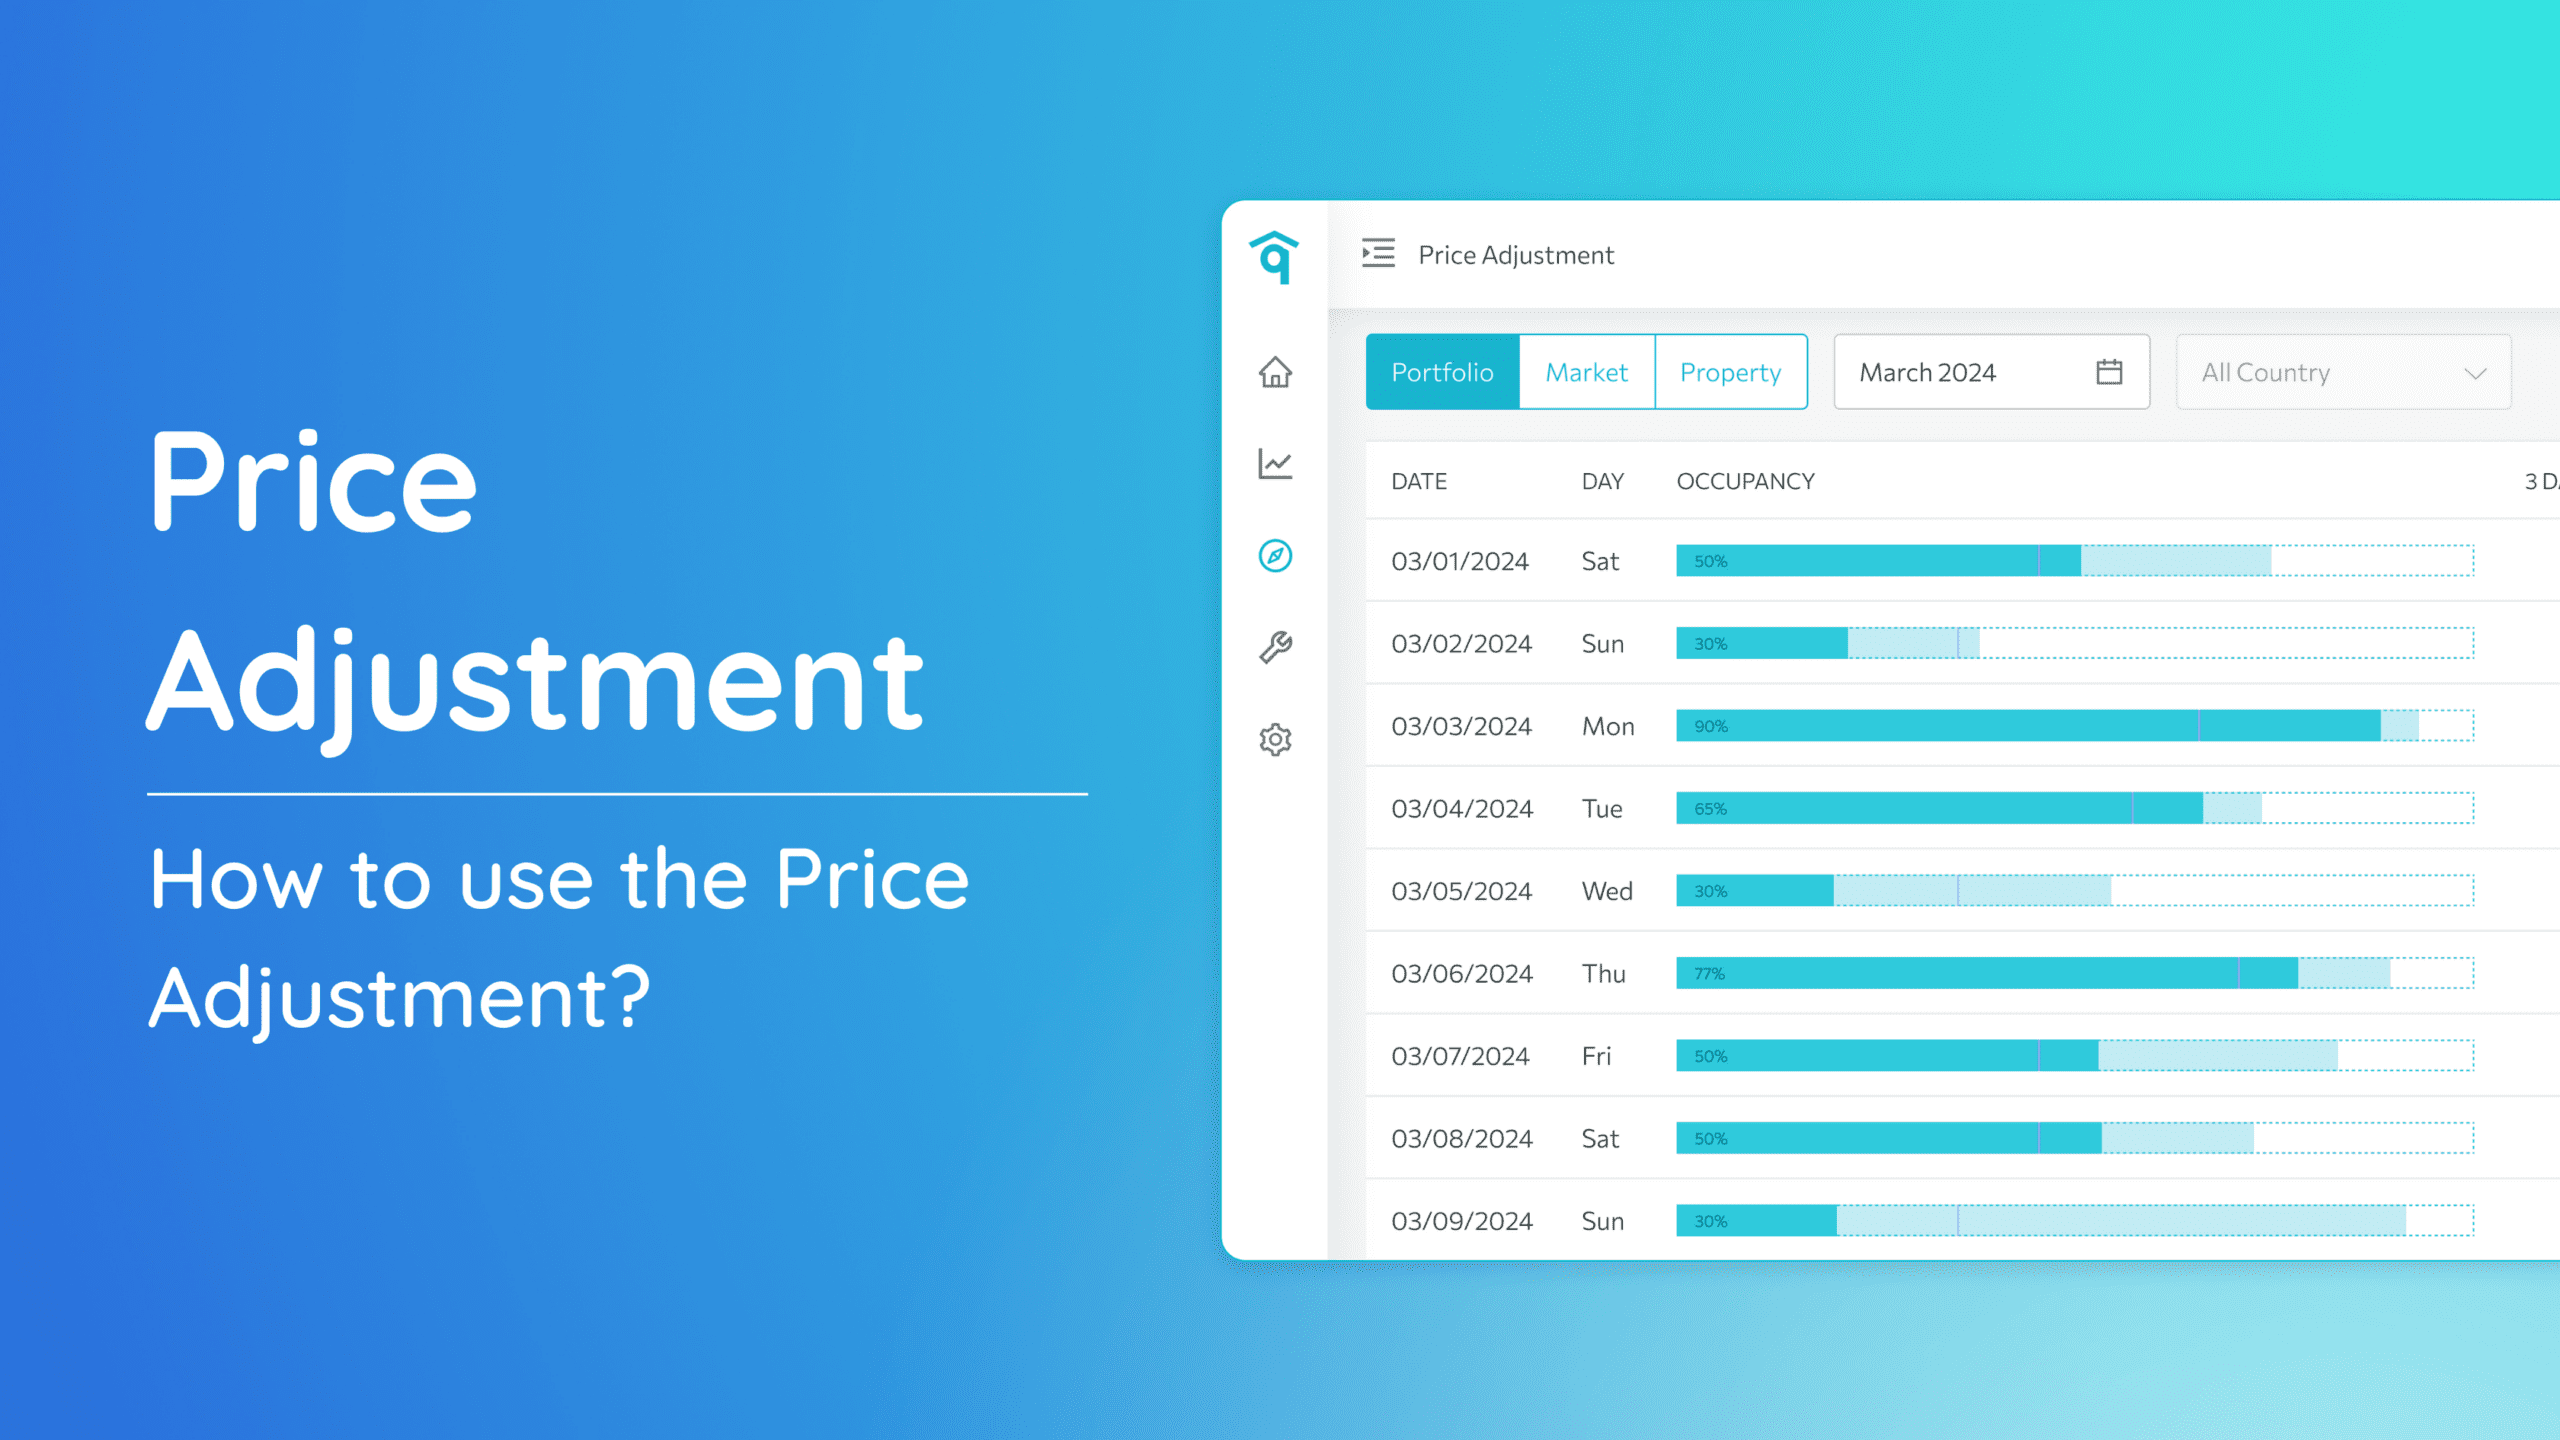
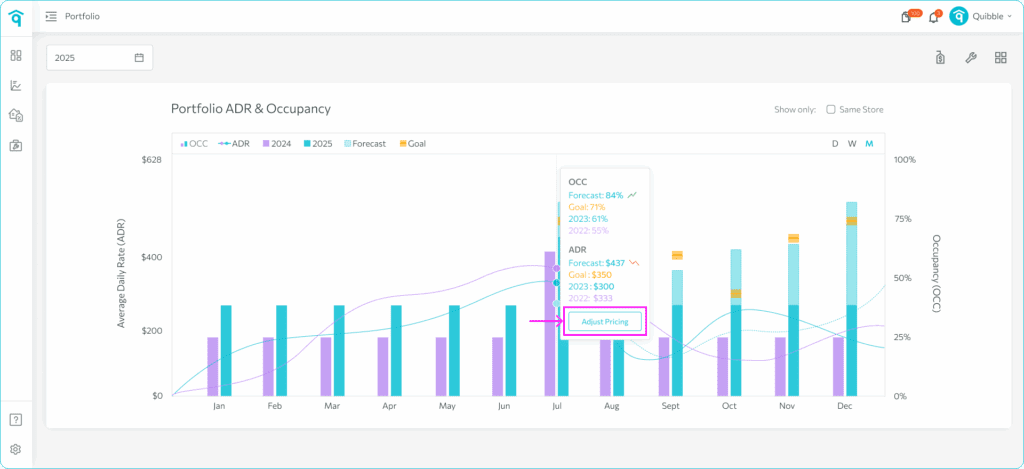
4. You also have the option to adjust pricing by clicking the Adjust Pricing button which redirects you to the pricing adjustment page.
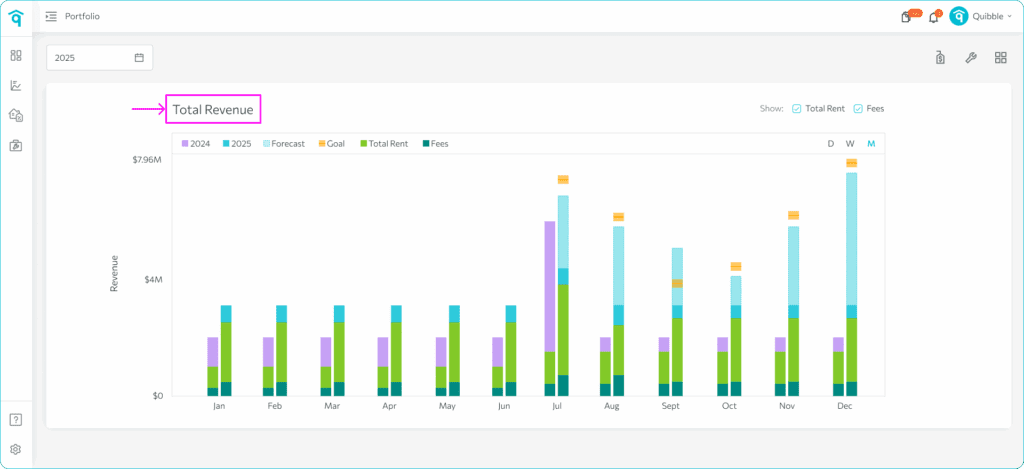
5. Next is the Total Revenue chart, which tracks the overall revenue generated by your portfolio to gauge its financial health. Revenue includes the Rent and Ancillary fees.
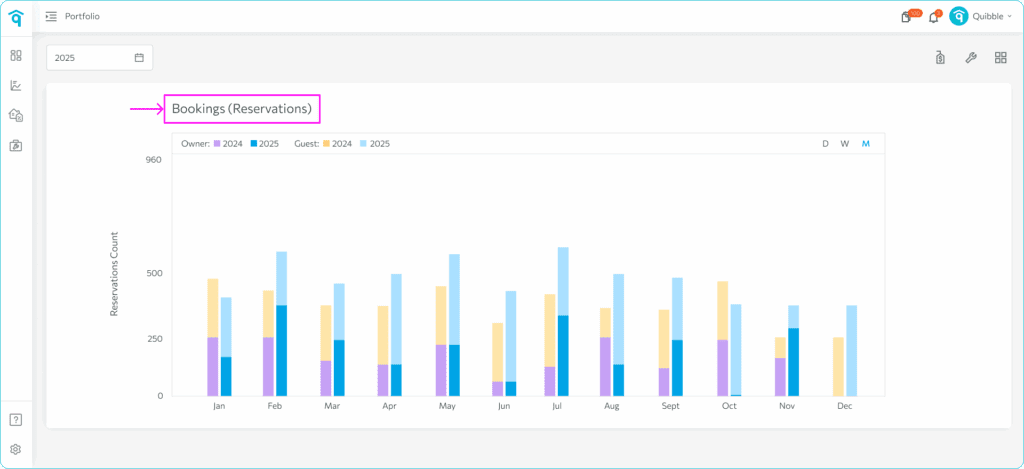
6. Following this is the Bookings/Reservations chart, which helps you monitor the number of bookings or reservations made within the selected year. The data displayed are also categorized by owner or guest bookings per year.
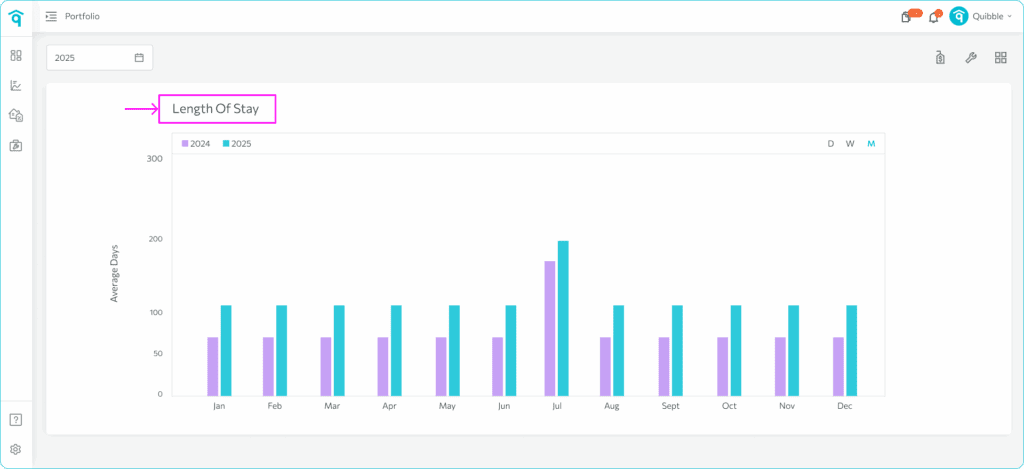
7. You will also find the Length of Stay chart. It helps you explore the average length of stay for guests, which is crucial for optimizing booking strategies.
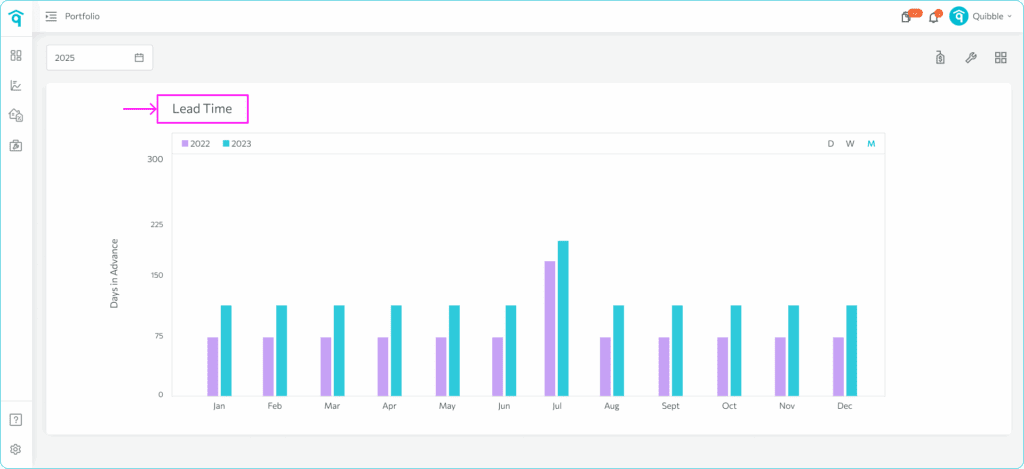
8. The Lead Time chart helps you understand the time gap between booking and check-in, offering insights through the lead time platform.
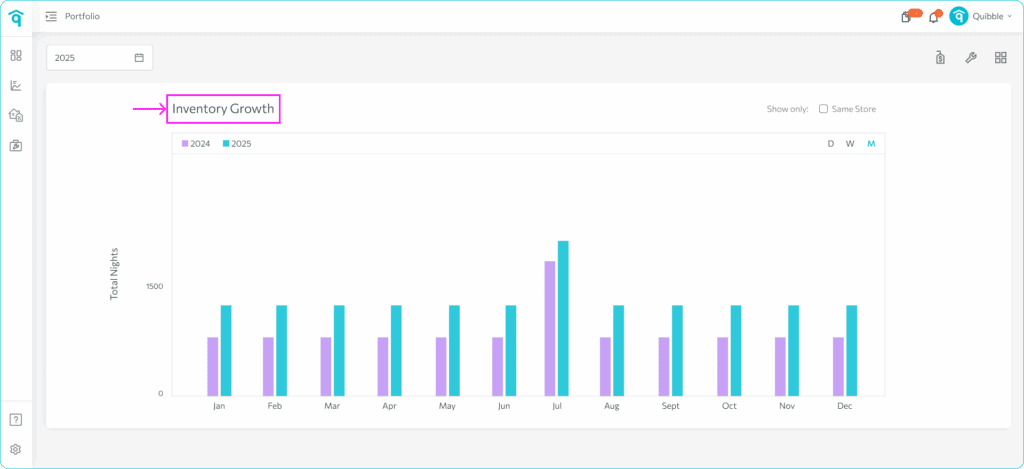
9. Inventory Growth are tracked to assess expansion and performance of your property inventory, factoring in rents and price variability.
10. Lastly, the Active Properties chart shows the number of active properties in your portfolio. This helps you stay informed about the number of active properties and monitor booking activities.

Explore the Portfolio Analytics section with these tools at your disposal, and gain a comprehensive understanding of your portfolio’s performance.