🏁 Let’s start with Revenue Management
Revenue Management is both a science and a practice of price discrimination, the economics term for charging different prices for the same product. It can be applied to many industries but gets most rigorously applied to enterprises with fixed capacity products that will spoil if not unused. In this sense, spoilage does not just refer to apples and oranges but a hotel room or rental property or airline seat that goes empty. After a day passes with the property going un-booked, a property manager has lost the opportunity to earn rent from that night. Contrast that with a retailer that sells bicycles. The bike shop manager leaves all the unsold inventory in the store and starts the next day again. The empty room night is spoiled inventory, and the property manager cannot store it for sale later. It is gone forever.
“The empty room at night is spoiled inventory, and the property manager cannot store it for sale later. It is gone forever. ”
Industries with a fixed capacity are also ideal for applying revenue management. For example, a hotel may sell the first 20 of its 100 rooms at a discount rate. Then it will increase the price for the following 20 rooms and then increase the price again for the next 20 rooms until the hotel gets fully booked. The hotel has a fixed capacity of 100 rooms, and if the hotelier has a good demand forecast, they may not sell any discounts and still sell out the hotel on a high-demand night.
There are two fundamental steps in setting the optimal price in revenue management. The first step is forecasting demand. Demand is a measure of how many consumers want to buy your product. For example, when forecasting short-term rentals, we forecast consumer demand for nights that guests wish to stay at a property. After knowing how much demand exists for each property, we can set the price, which is the second step.
✅ Challenges of Forecasting
The reason events like Covid-19 present a significant challenge for revenue management is because it makes it difficult to forecast demand. The forecasting process relies on historical data, which are events that occurred in the past. We hope to find trends in the past that will repeat themselves in the future. The result of coronavirus and the policies enacted to mitigate the spread of the disease had a significant impact on travel demand. The effect on the vacation homes market was not homogeneous throughout the United States or the global market.
Lockdowns, stay-at-home orders, curfews, vaccine requirements, and quarantines happened at different times in other states and different counties. They all had an impact on travel and travel demand. There were also seasonal fluctuations in the spread of the disease that were regional, complicating the matter even further.

Forecasting future demand relies on this year’s demand, being similar to last year’s demand and the seasonal pattern of the previous year to repeat itself. In normal operating conditions, this is a reasonable assumption. We can find reliable seasonal patterns in reservation data and use them to predict the future. But the past few years have not been standard. That is the major criticism for using traditional forecasting and optimization processes in revenue management during abnormal events. The uniqueness of these travel patterns will likely NOT repeat itself.
📊 How to Use Data even during COVID-19
It is tempting to discard all of the data from the affected period, stop forecasting, and set prices manually until things are back to normal. That is a logical consideration given the challenges of forecasting and predicting when the demand has not behaved normally. But even demand data from abnormal booking periods can tell a story and help you understand your revenue, especially if you are aware of the nuances of the historical data.

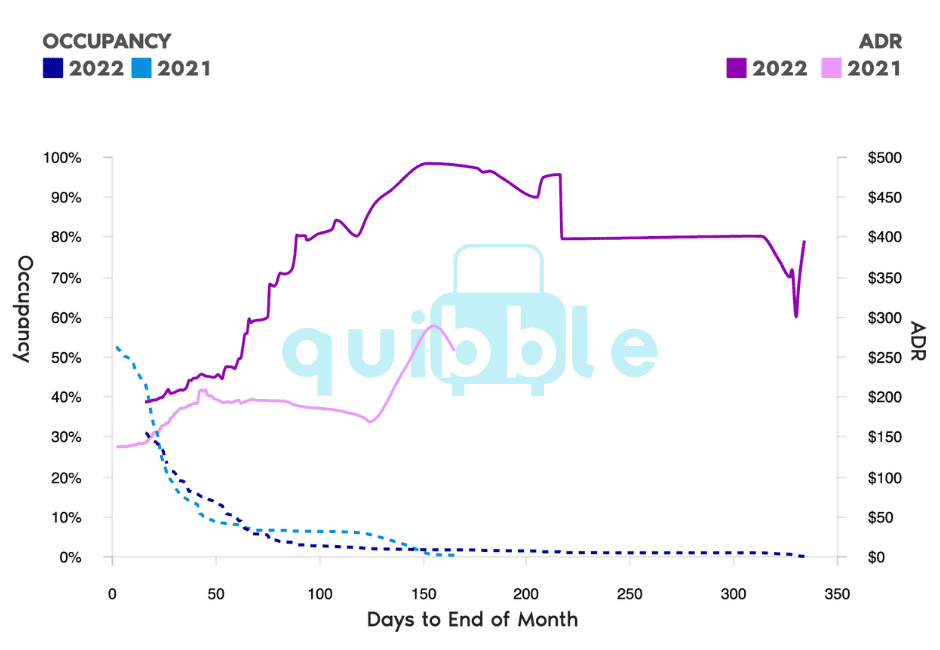
The data in this chart is Occupancy and ADR data from January 2021 and 2022. This data shows that this property set was booked to 54% occupancy for the portfolio in January 2021. We will use this demand comparison data from the previous year’s data and the current demand snapshot data to forecast January 2022. At this December 16th snapshot, the current year’s occupancy was 6 points ahead of the previous year. This position tells the property manager and the revenue manager several things. First, the demand is higher this year compared to last year. Second, the forecasted occupancy for this year for January is about 60%. Both of those are good indicators for 2022.
“But even demand data from abnormal booking periods can tell a story and help you understand your revenue, especially if you are aware of the nuances of the historical data.”
Critics of traditional revenue management practices are wary that last year’s data in this evaluation is not a good benchmark. Specifically, in this case, the impact of SARS-CoV-2 and its surrounding policies have made the data from last year useless. But that is if the analyst does not know the context and understand the previous year’s results. For example, January 2021 occurred during a peak in COVID cases in the United States (USA). Confirmed COVID cases in 2021 started rising in October and peaked on the 12th of January. Understanding that travel demand got suppressed last year due to this effect is critical to this year’s revenue managers’ decisions.
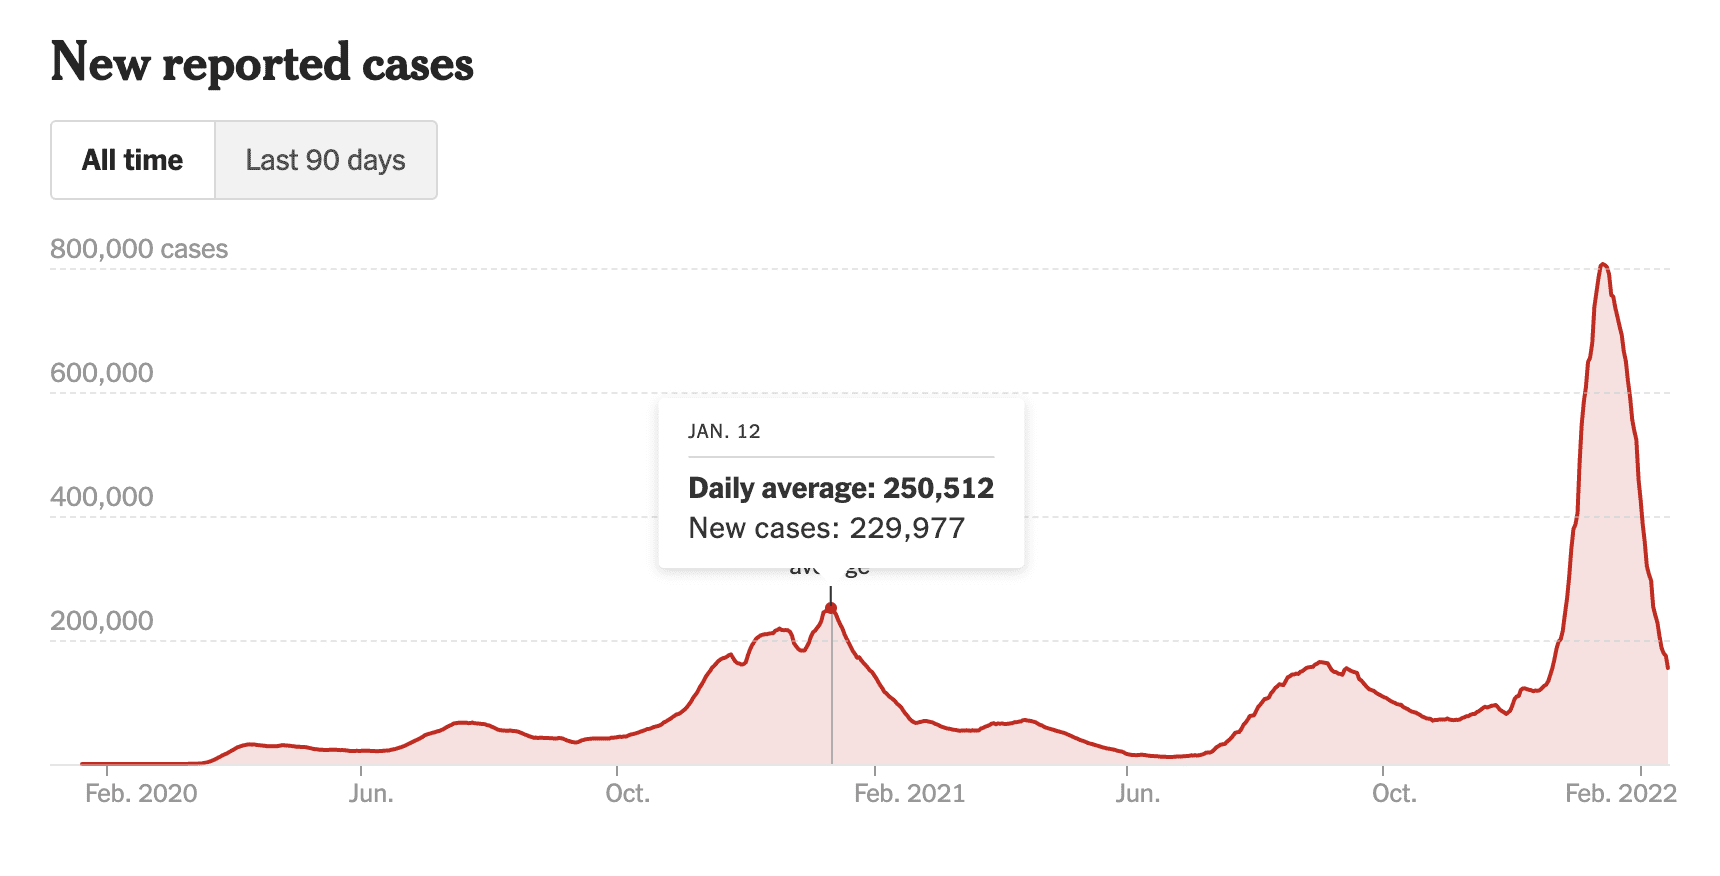
Source: New York Times - Coronavirus in the U.S.: Latest Map and Case Count
Since last year’s demand got suppressed, the demand for January 2022 should be positive. That assumption holds if the same negative impact from a rise in cases the year before does not repeat in 2022. In October of 2022, coronavirus cases in the U.S. were on the decline. New confirmed cases remained relatively flat for November and half of December. Then, on the 19th of December, cases started rising at unforeseen levels since the pandemic’s beginning. The increased rate of spread was primarily due to the new coronavirus variant named Omicron.
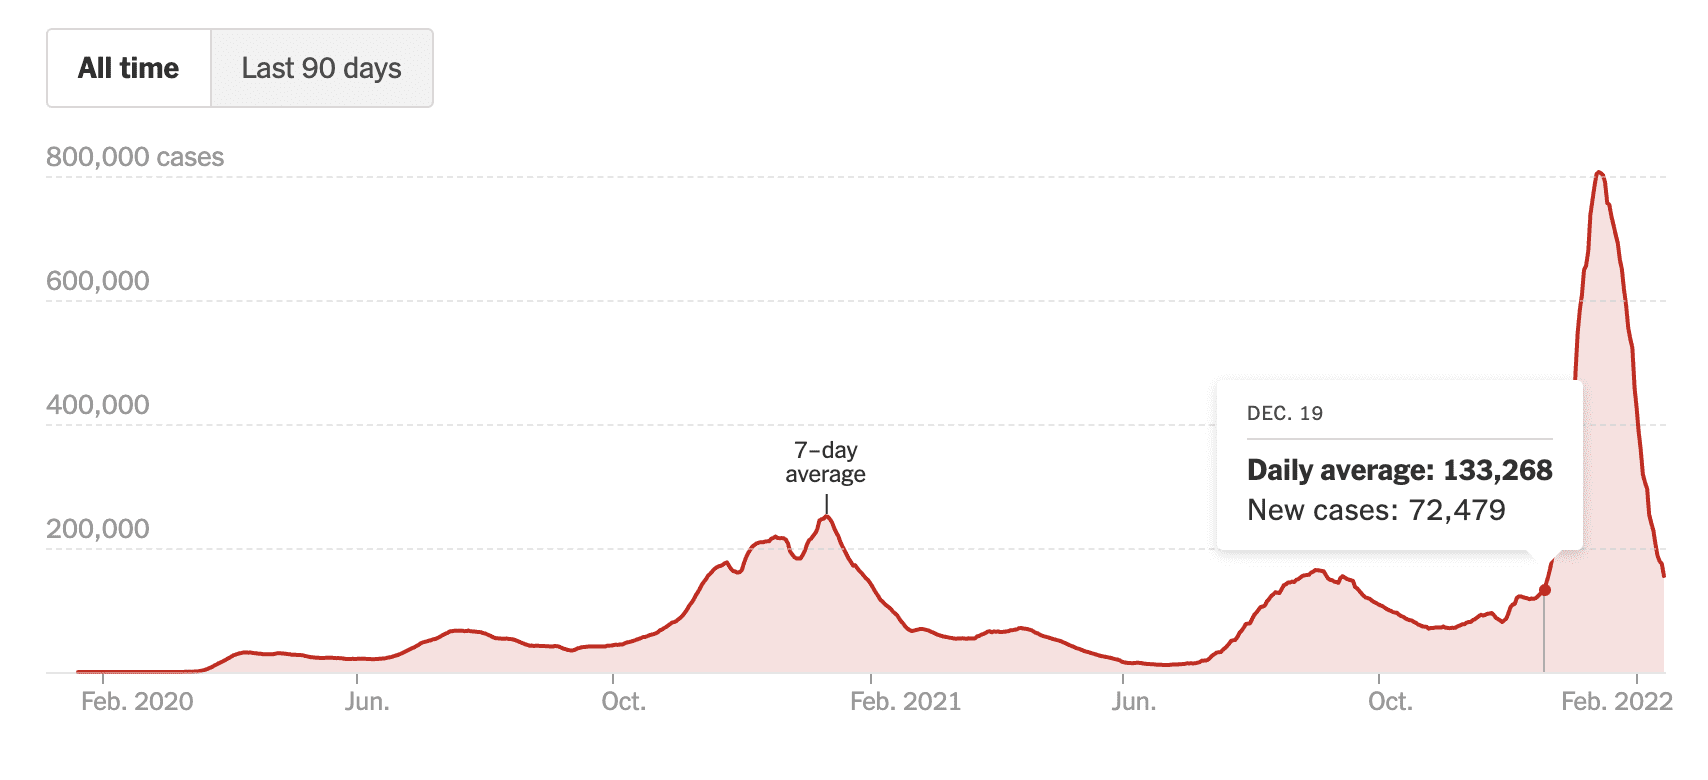
Source: New York Times - Coronavirus in the U.S.: Latest Map and Case Count
Our 6-point occupancy gap started to disappear at that exact point in time. The snapshot date of the data below is the 1st of January. Consumer confidence in travel eroded in many parts of the country because of the rise of COVID cases in the last two weeks of December. Cancellations due to active cases were numerous. Others decided to postpone travel until cases had dropped to previous levels. As a result, our 6-point gap turned into a -1-point gap over those two weeks.
🎯 Mind the Gap
The chart below charts the occupancy gap for January. The occupancy gap describes the difference in occupancy on a year-over-year basis at the same point in time. The gap was between 5 and 7 points from mid-December to the 6th of January, meaning it was ahead of the previous year.

Generally speaking, that indicates stronger demand this year. However, the gap abruptly closed about one week after the cases rose. Just two weeks later, the gap was negative, indicating a weaker demand environment on a year-over-year basis. The negative correlation between the occupancy gap and covid new daily cases is consistent with a lack of confidence in travel due to the case rise. In 2021 the case increase was much more gradual and had a lower peak. On the other hand, COVID cases rose much faster in 2022, and the impact on demand was sharp.
🚀 Reacting to the Data
The closure of the occupancy gap, a measure of demand, is a crucial indicator for the revenue management team to react. The most direct lever that the manager has to stimulate demand is the price. In this case, the ADR (Average Daily Rate), which is the measure of price, is higher on a year-over-year basis for January, indicated by the two purple lines in the OCC/ADR chart above. Therefore, the revenue manager can sacrifice the ADR gap, which is the increase in price year over year, by lowering the pricing of the properties. A less direct price reduction method is to ease any booking restrictions that apply to reservation requests, and the primary restriction is minimum night stay requirements. Another option is to try to stimulate demand for the properties with a marketing campaign targeting stays in January.
“A less direct price reduction method is to ease any booking restrictions that apply to reservation requests, and the primary restriction is minimum night stay requirements.”
Keep all these options as considerations when reacting to the data. But, equally important is responding to the data in a timely fashion. That is why Quibble provides an Occupancy, ADR, Revenue, and RevPAR forecast for all of our analytics customers. These forecasts get updated in real-time based on streaming reservation data. When the forecast starts to drop, the analyst learns about it in real-time so they can react in real-time.
Even though this data is from 2 periods impacted by the coronavirus pandemic, it still tells a story about what is happening in the market. There is a precise point when the data converges and alerts the manager to take action.
💎 Conclusion
Forecast-based revenue management has received a lot of criticism for not correctly reacting and adjusting to demand shocks like COVID-19. The basis of forecasting relies on events and patterns that repeat themselves. Covid has dramatically impacted the standard seasonal patterns of demand for travel, which makes forecasting more challenging.
The demand for STR’s in January 2022 was very different from the year before. Covid cases were also very different on a year-over-year basis. Even with those differences, the science and principles of revenue management practices guided the decisions to optimize revenue for the data shown here.
“Even with those differences, the science and principles of revenue management practices guided the decisions to optimize revenue for the data shown here. “
The data here could easily get misconstrued if the observer had not been aware of the context. When comparing data on a year-over-year basis, one must have a value assessment of the last year’s data. The analyst must understand that COVID impacted the 2021 data. This context allows them to understand the occupancy and ADR gap and react accordingly. Even though both periods occur during a peak in the COVID case counts, the data is instrumental.
Join our newsletter
Dominate the short-term rental market with cutting-edge trends