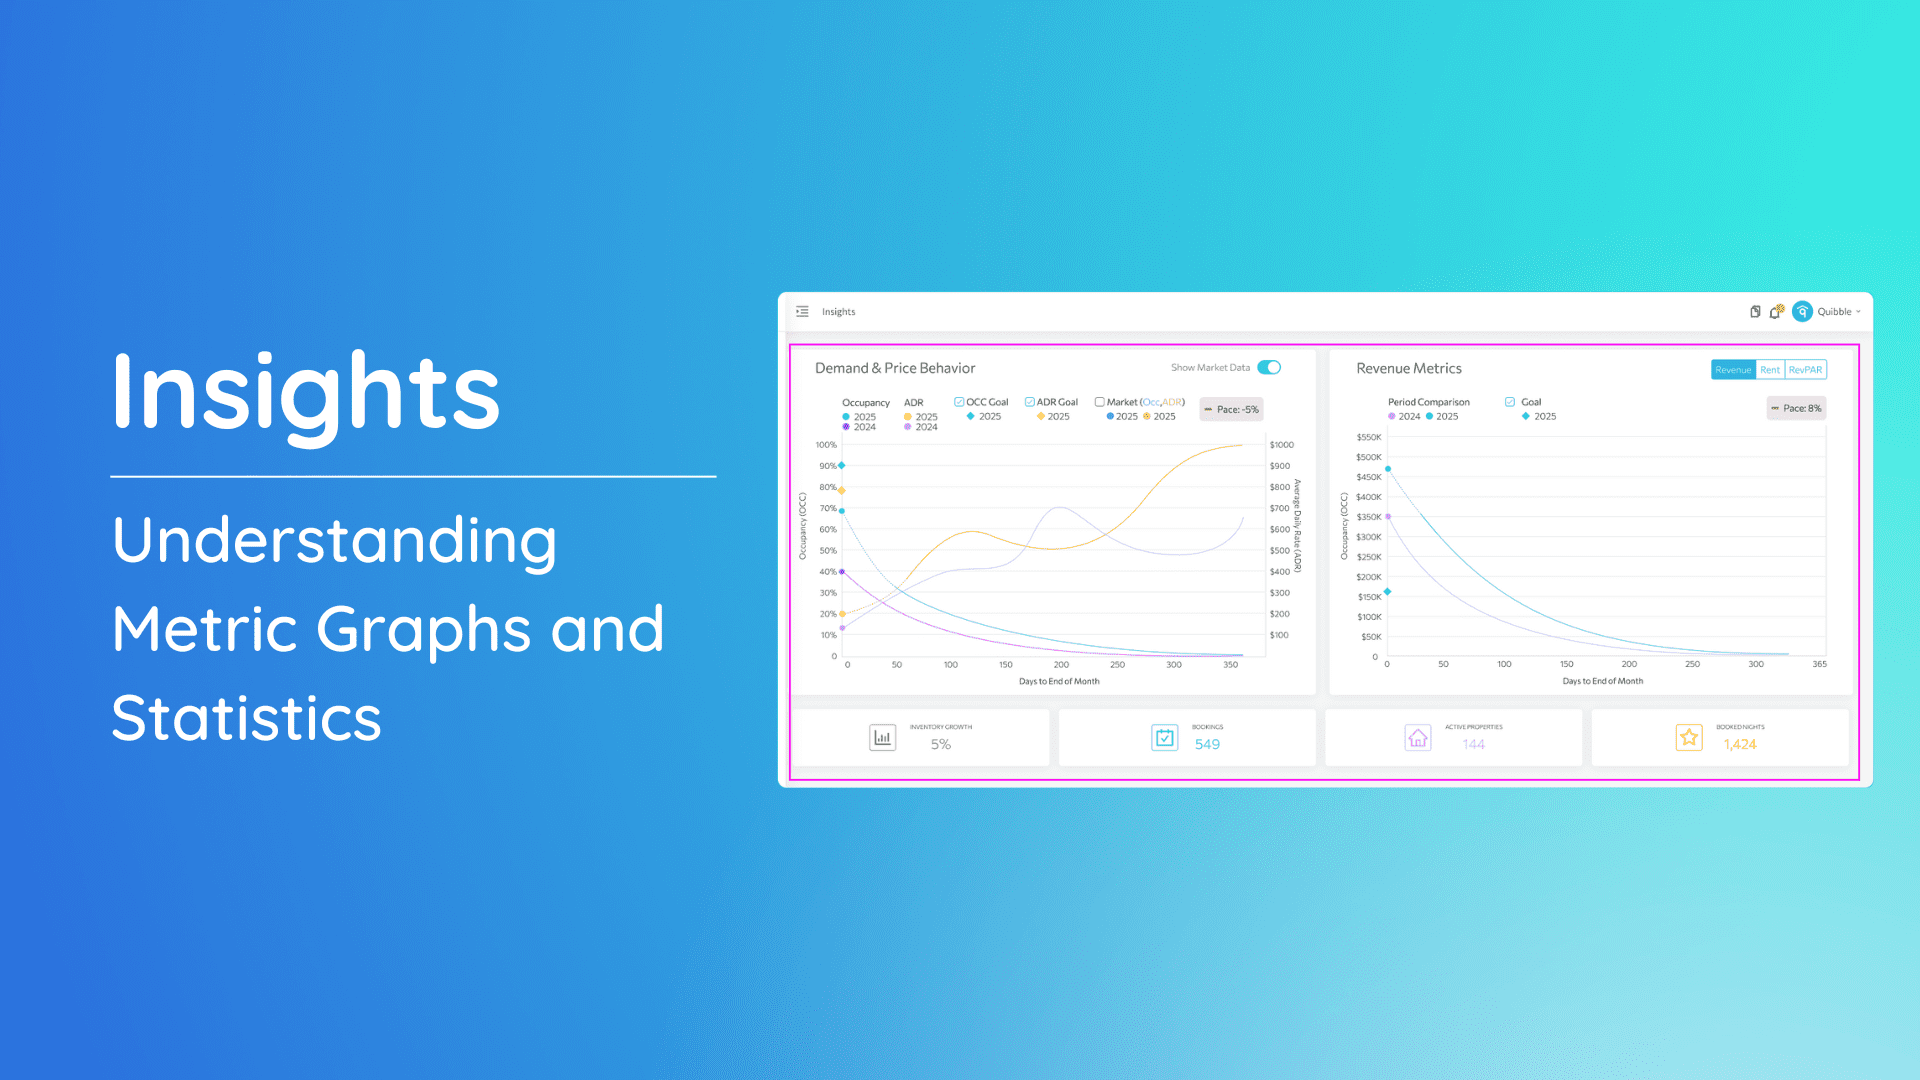
Adjusting prices from the Analytics page allows you to fine-tune your pricing strategy using advanced insights and easy-to-use tools. This guide will walk you through the key steps to access price adjustment settings, understand essential metrics, and apply pricing changes effectively.
Accessing Price Adjustment
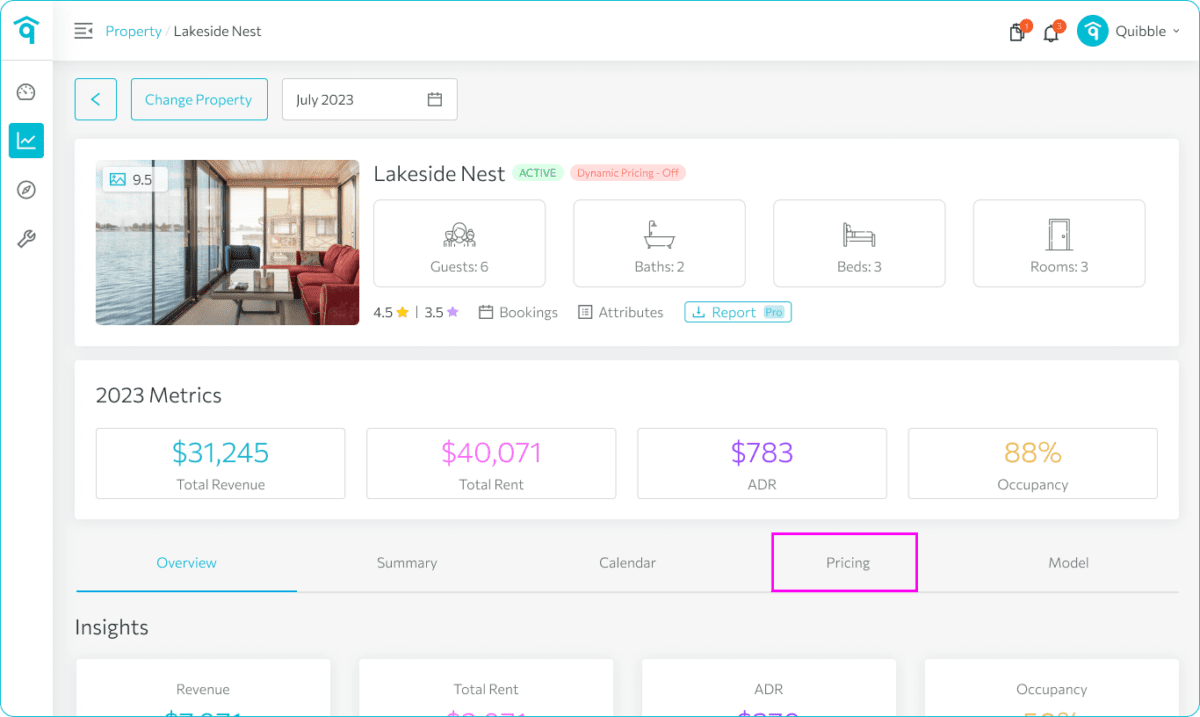
To get started, you’ll need to navigate to the correct property and pricing settings within the Analytics page. Follow these steps:
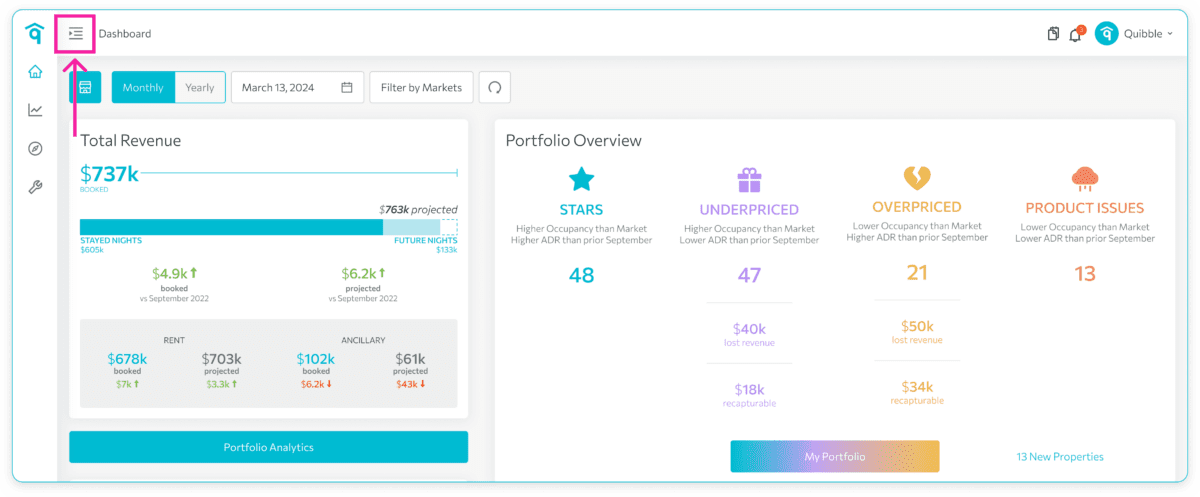
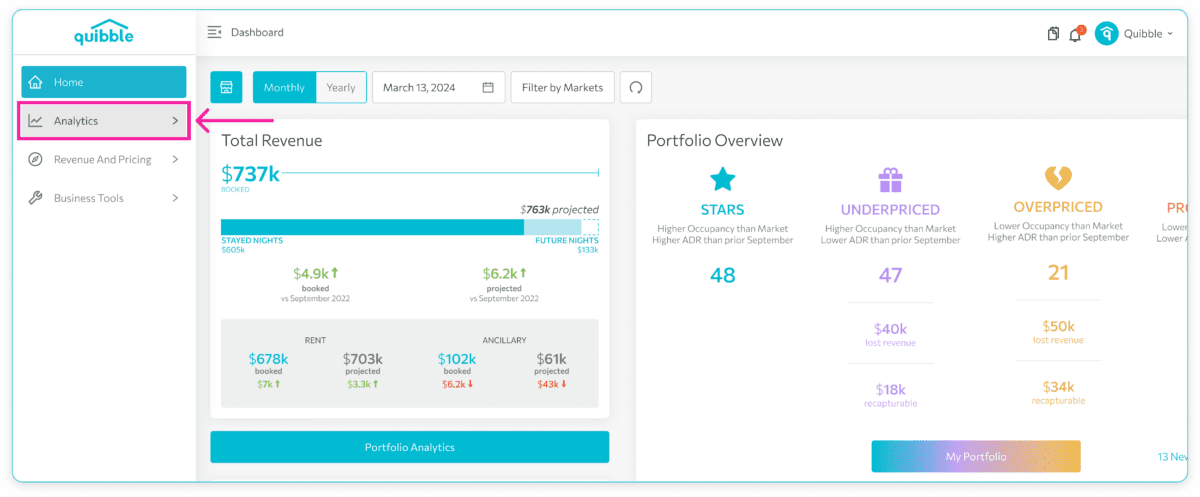
1. Head to the left-side menu bar.
2. Click “Analytics.”
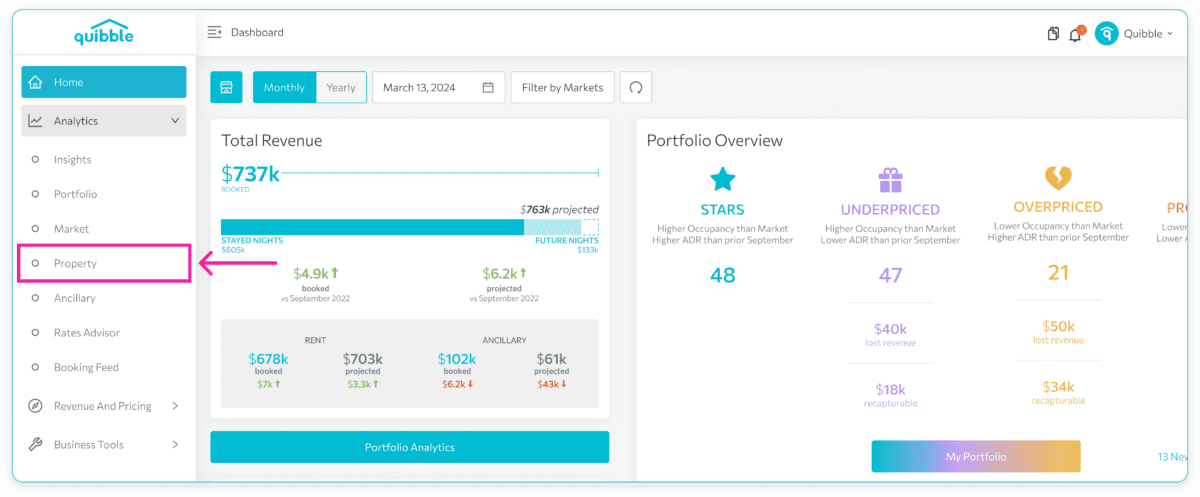
3. Select “Property.”
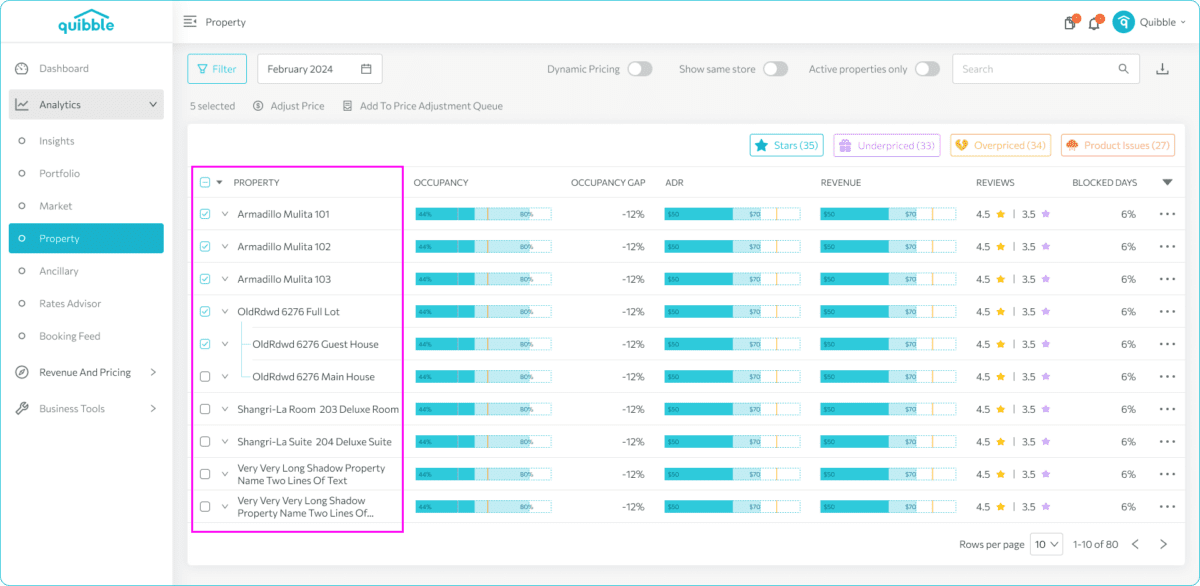
4. Choose the property you want to adjust pricing for.
5. Go to the “Pricing” tab.
How to View the Key Metrics
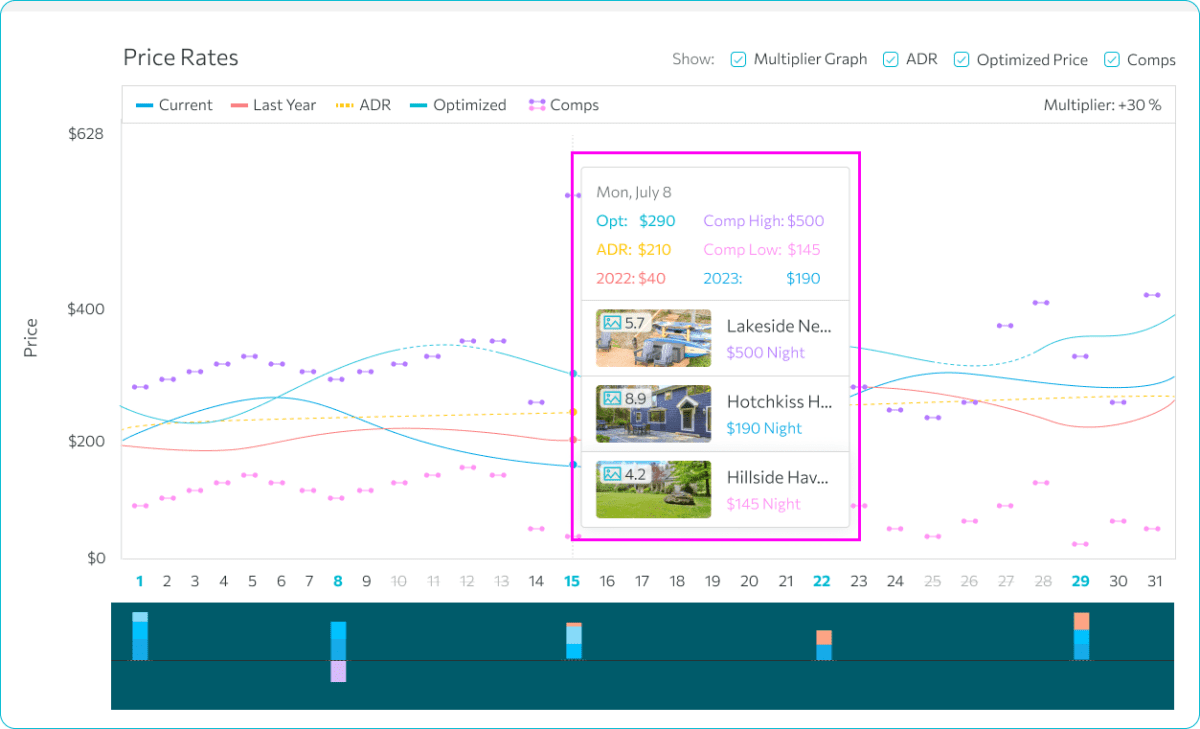
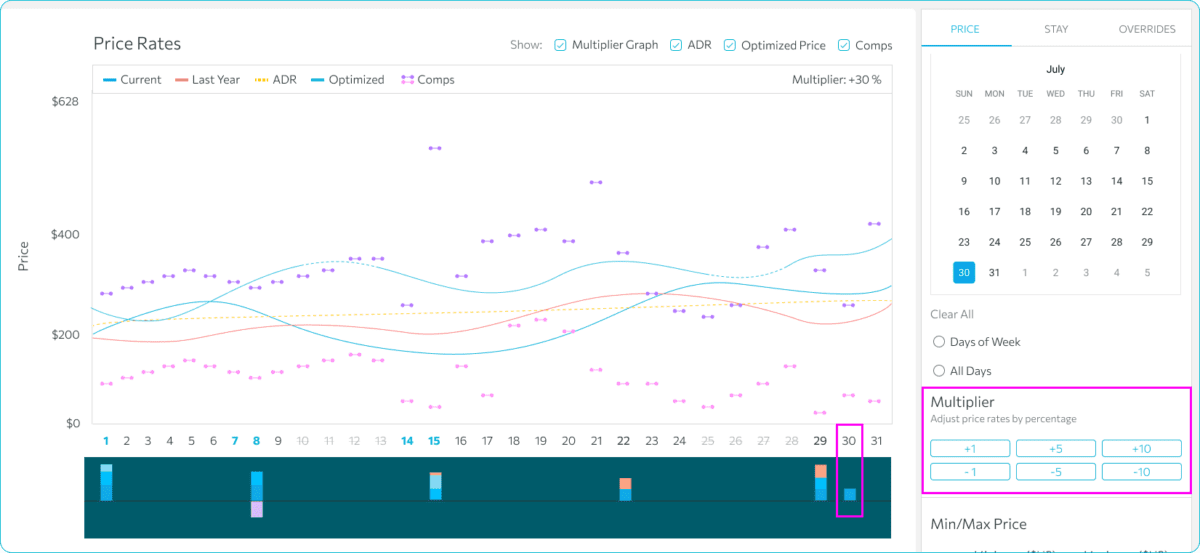
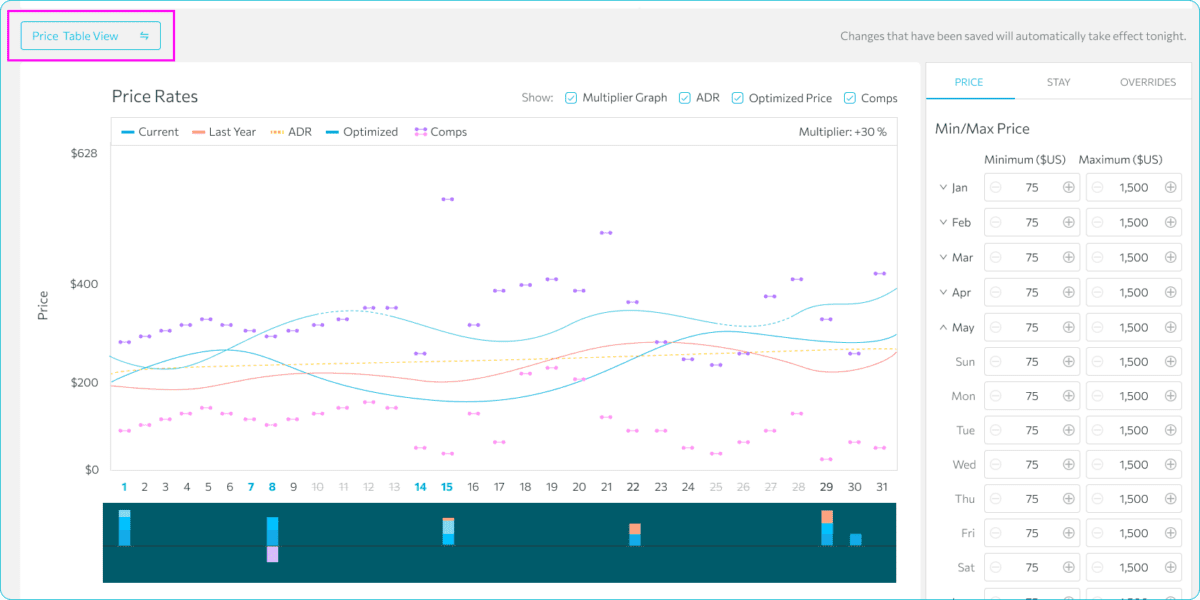
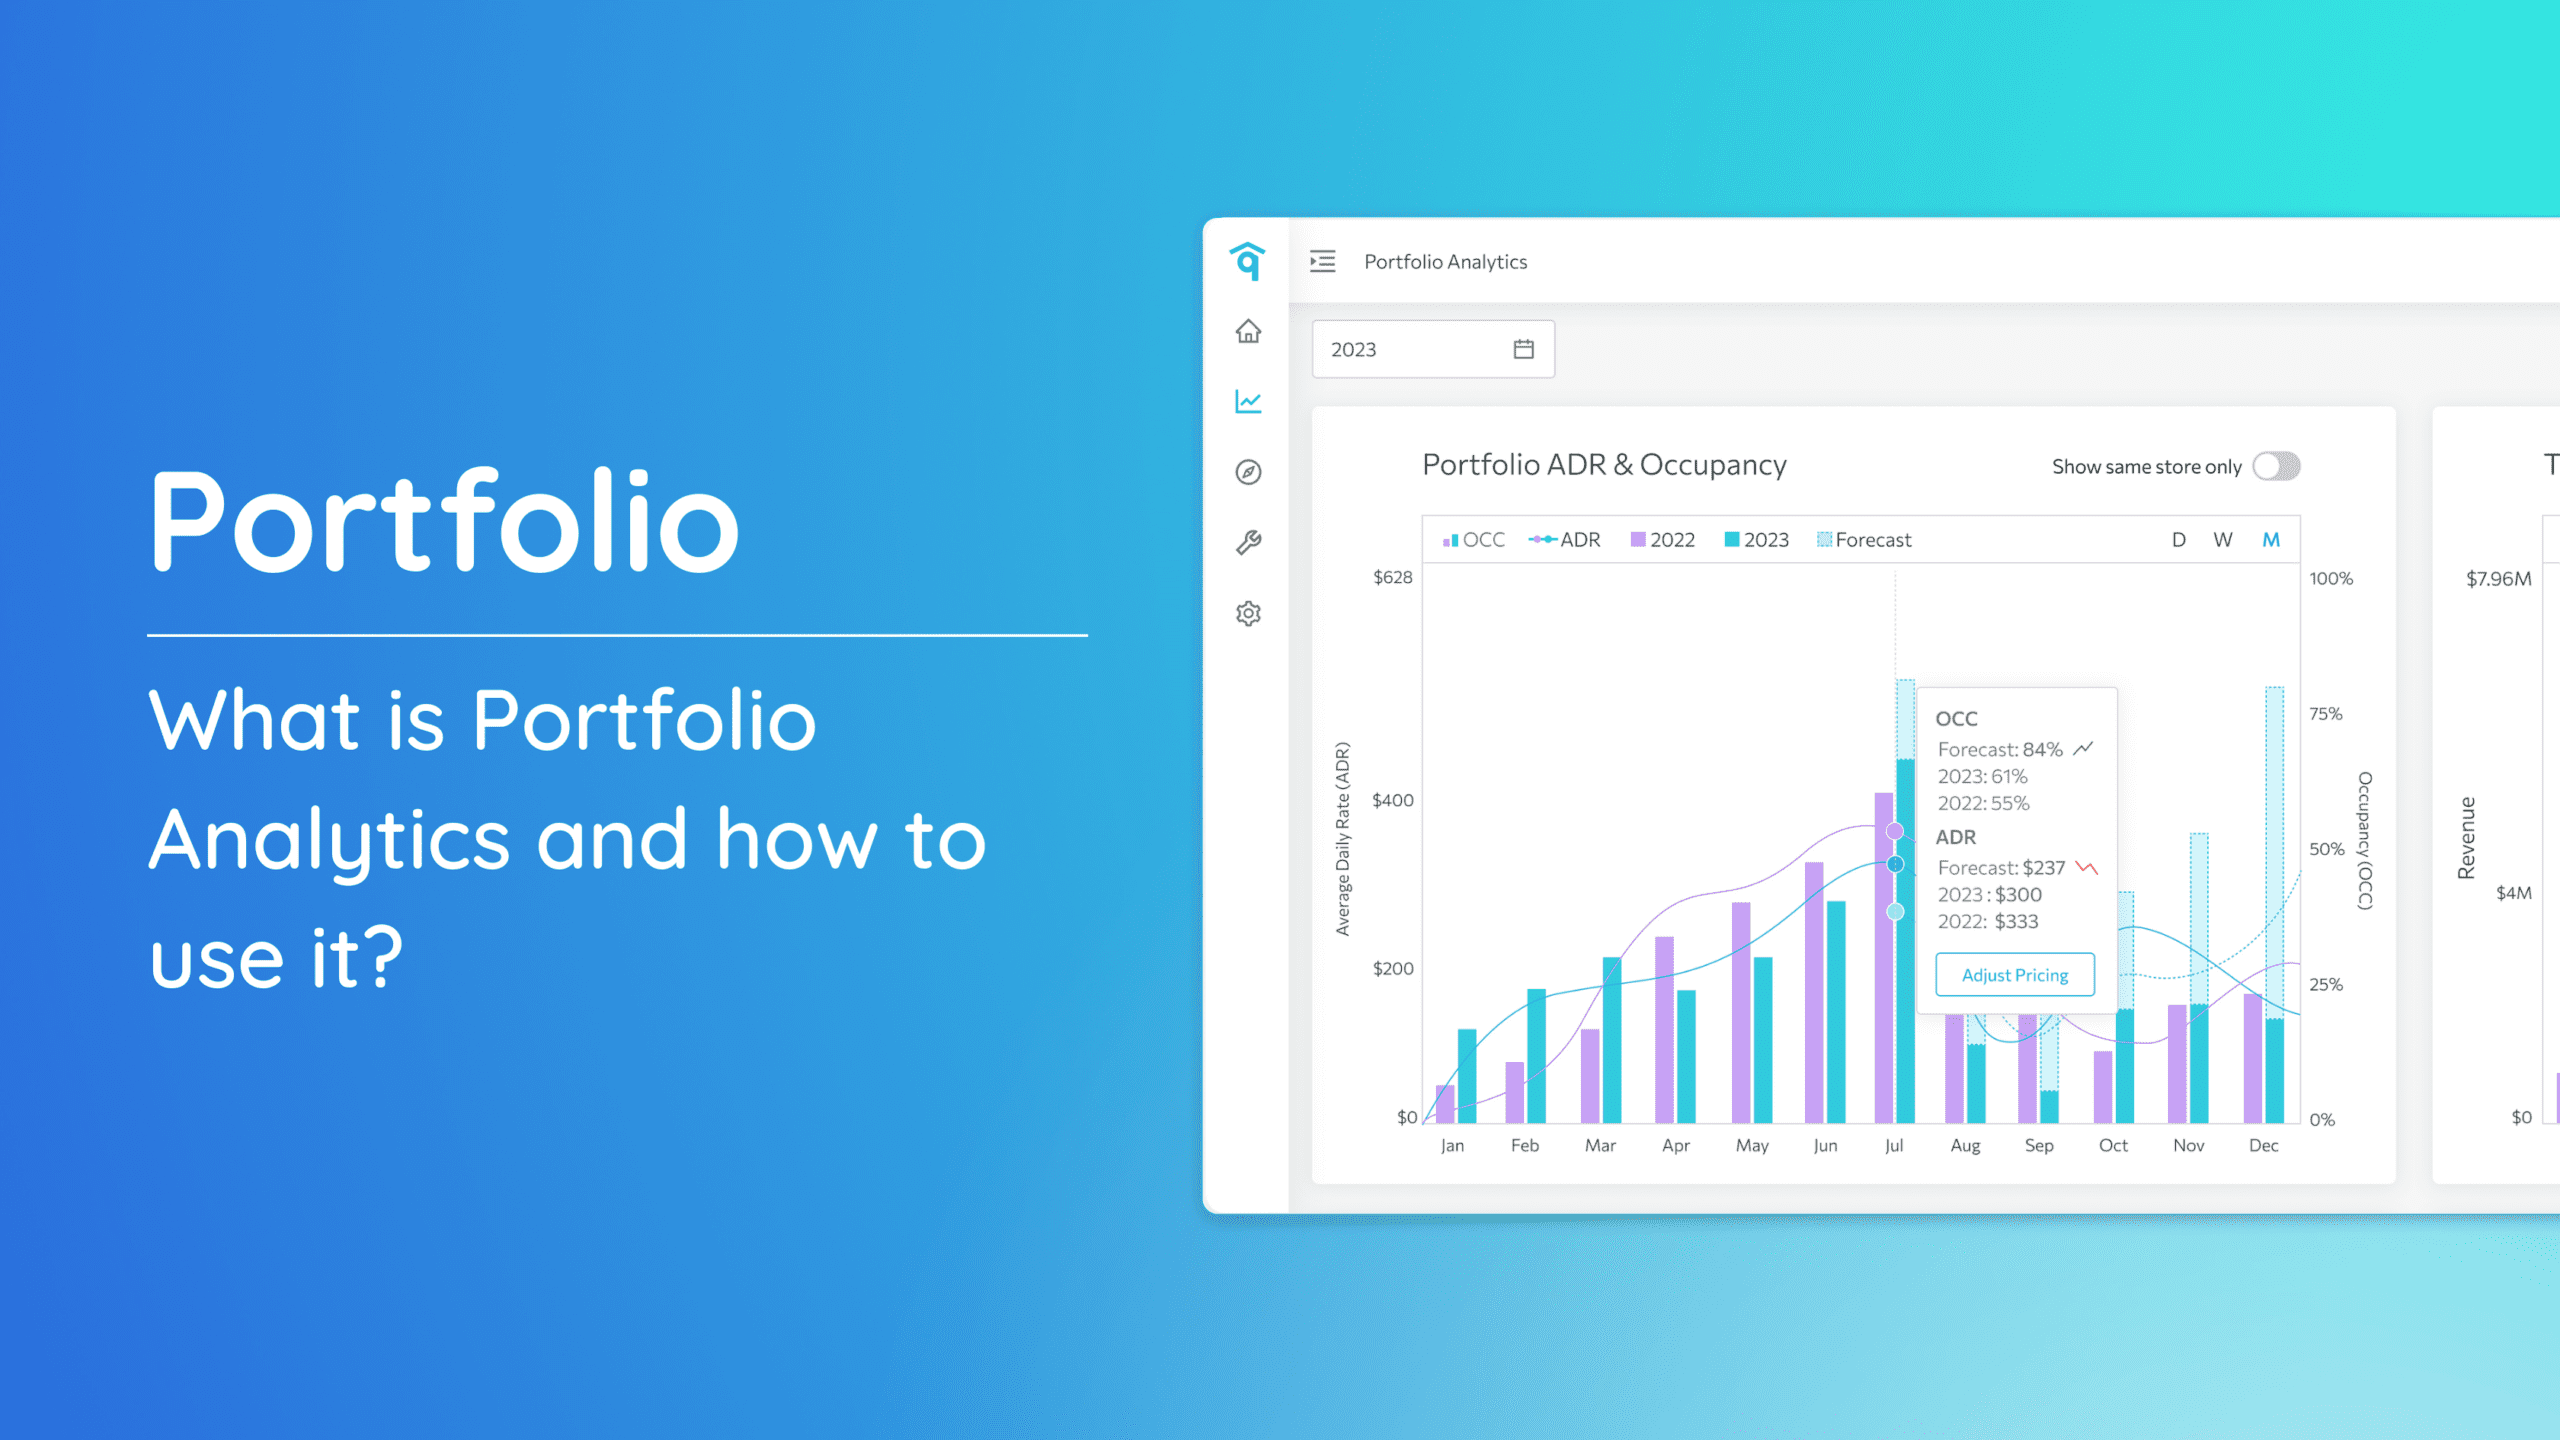
Understanding your data is the foundation of effective pricing adjustments. The Analytics page provides key metrics like the Multiplier Graph, ADR (Average Daily Rate), Optimized Price, and Competitors.
To view the details:
- Hover over the lines on the chart to reveal the data points for each metric.
Show or Hide a Key Metric
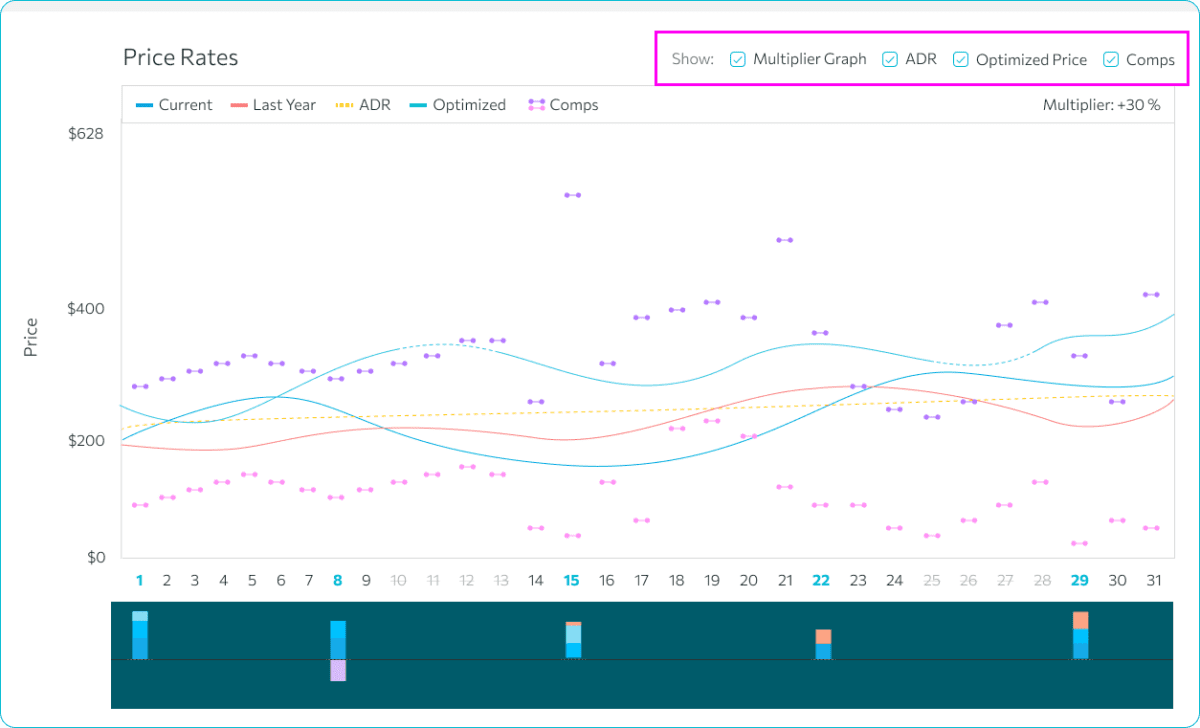
You can customize your view by selecting which metrics to display.
- To show or hide a key metric, tick the box(es) in the Show Settings section.
This flexibility ensures that you focus only on the metrics most relevant to your goals.
How to Adjust the Price Using Price Graph View
The Price Graph View is a powerful tool for visualizing and fine-tuning your rates over time.
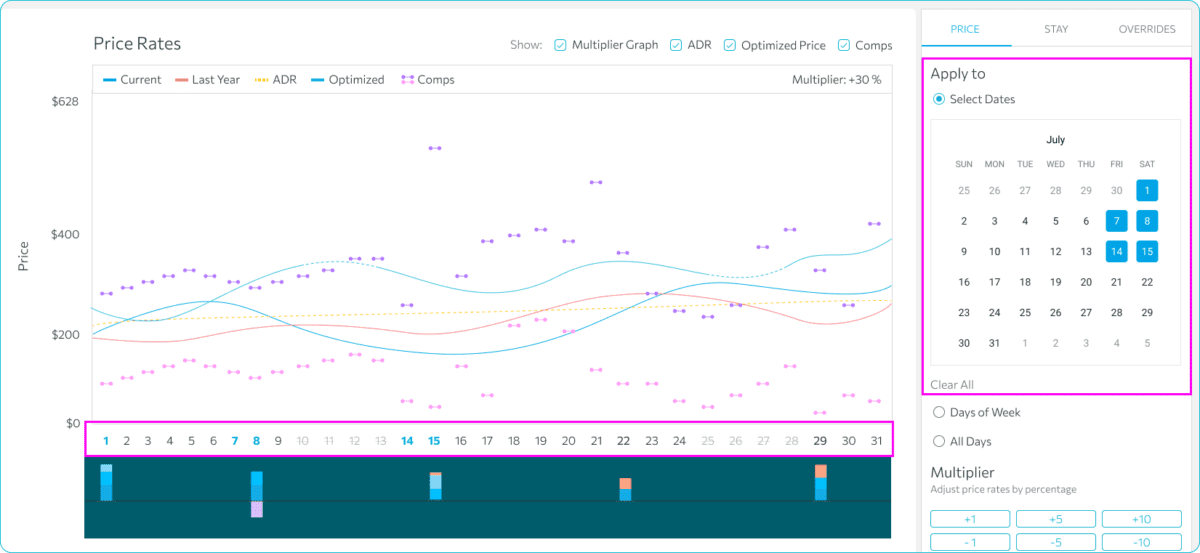
1. Select the date(s) using the calendar on the right menu bar or the days displayed at the bottom of the chart.
2. Adjust your rates by choosing your desired multiplier, which applies a percentage change to the system’s Optimized Price.
The example below shows that the multiplier was applied to the 28th day.
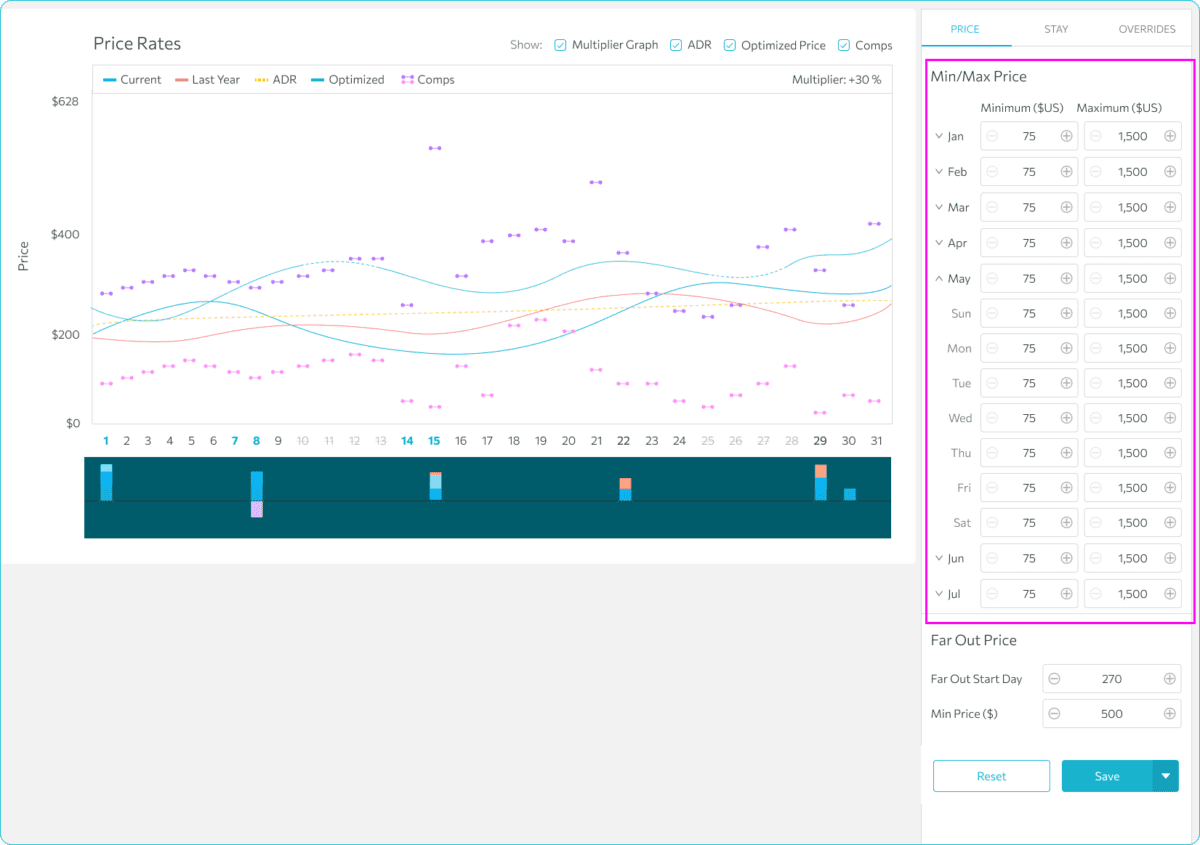
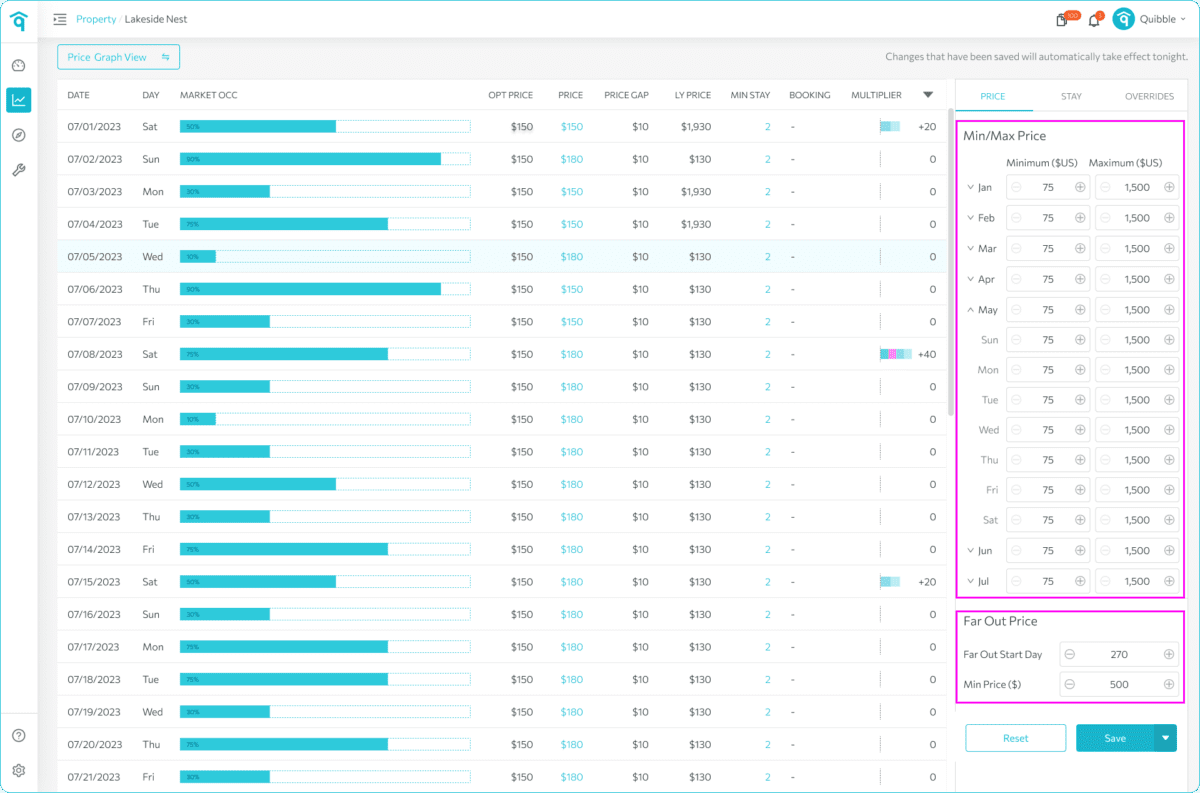
3. Scroll down to the Min/Max Price section to set the minimum and maximum price by month.
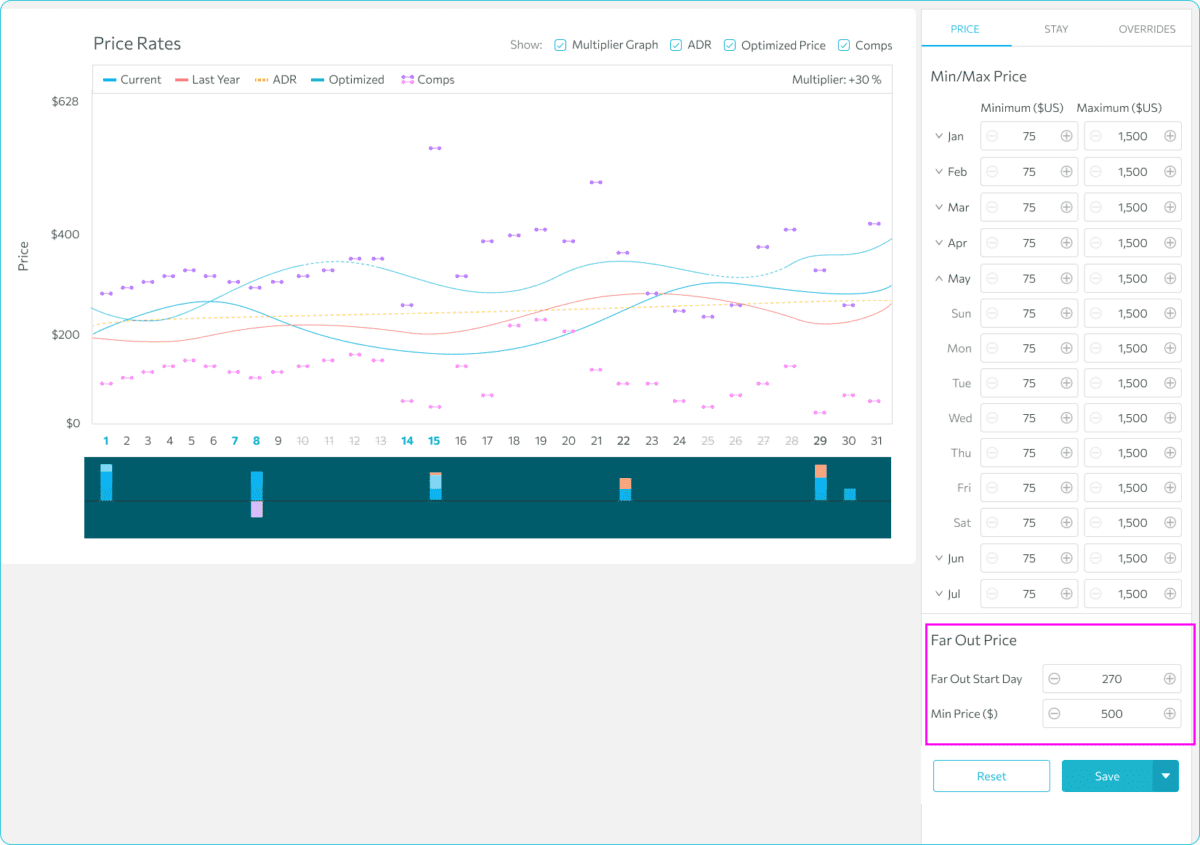
4. Optionally, configure the Far Out Price below the Min/Max Price settings. Learn more about setting the far out price here.
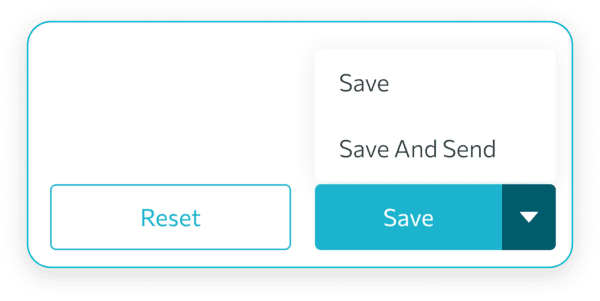
5. Finally, click “Save” to apply changes before the end of the day or “Save and Send” for real-time application.
How to Adjust the Price Using Price Table View
1. The app’s default view is the Price Graph View. Click the “Price Table View” button to switch.
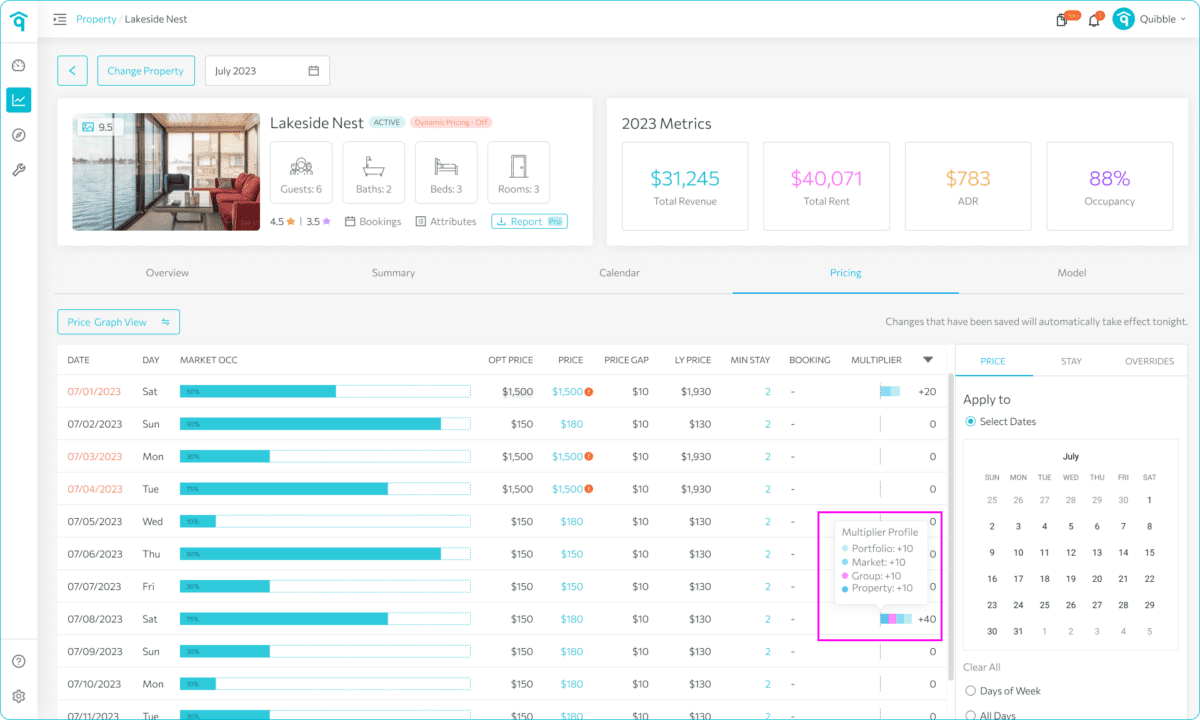
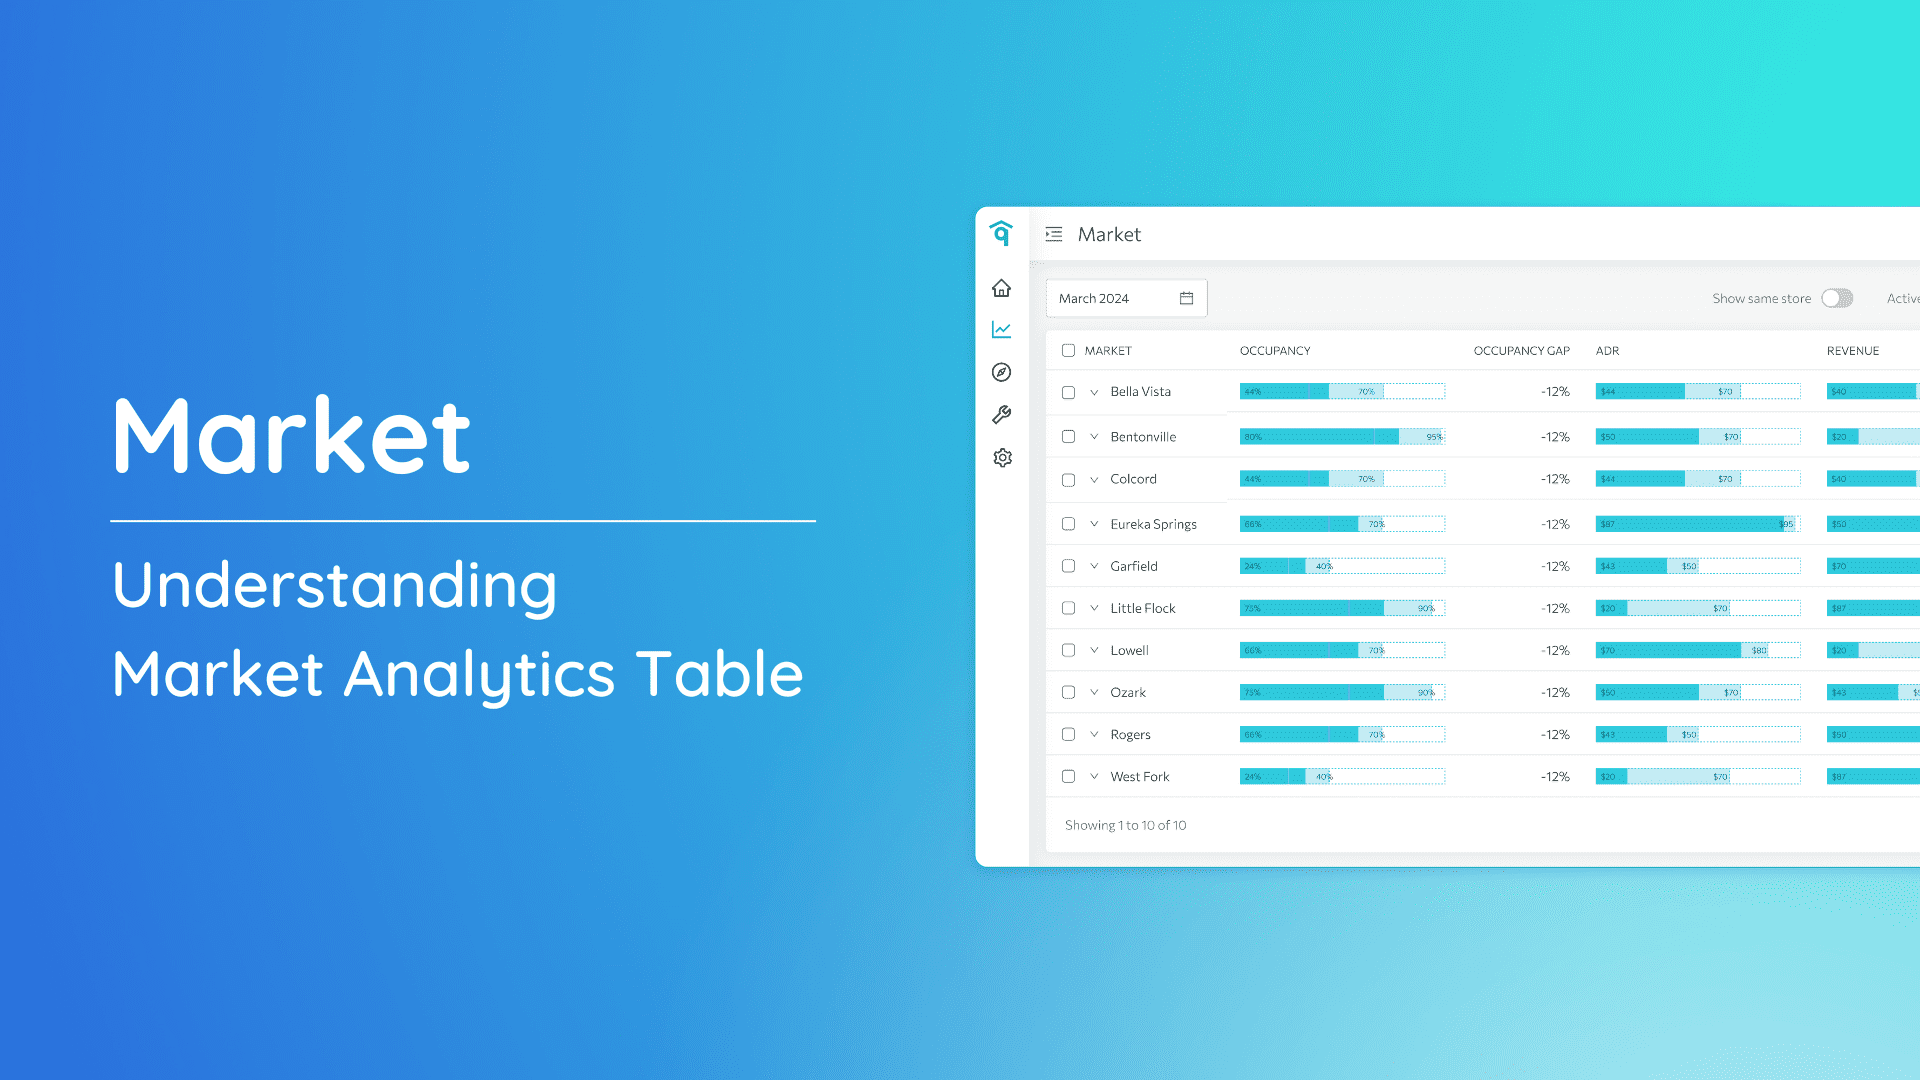
2. To review existing price adjustments at different levels (Portfolio, Market, Property), hover over the three dots in the Multiplier column. Learn more here.
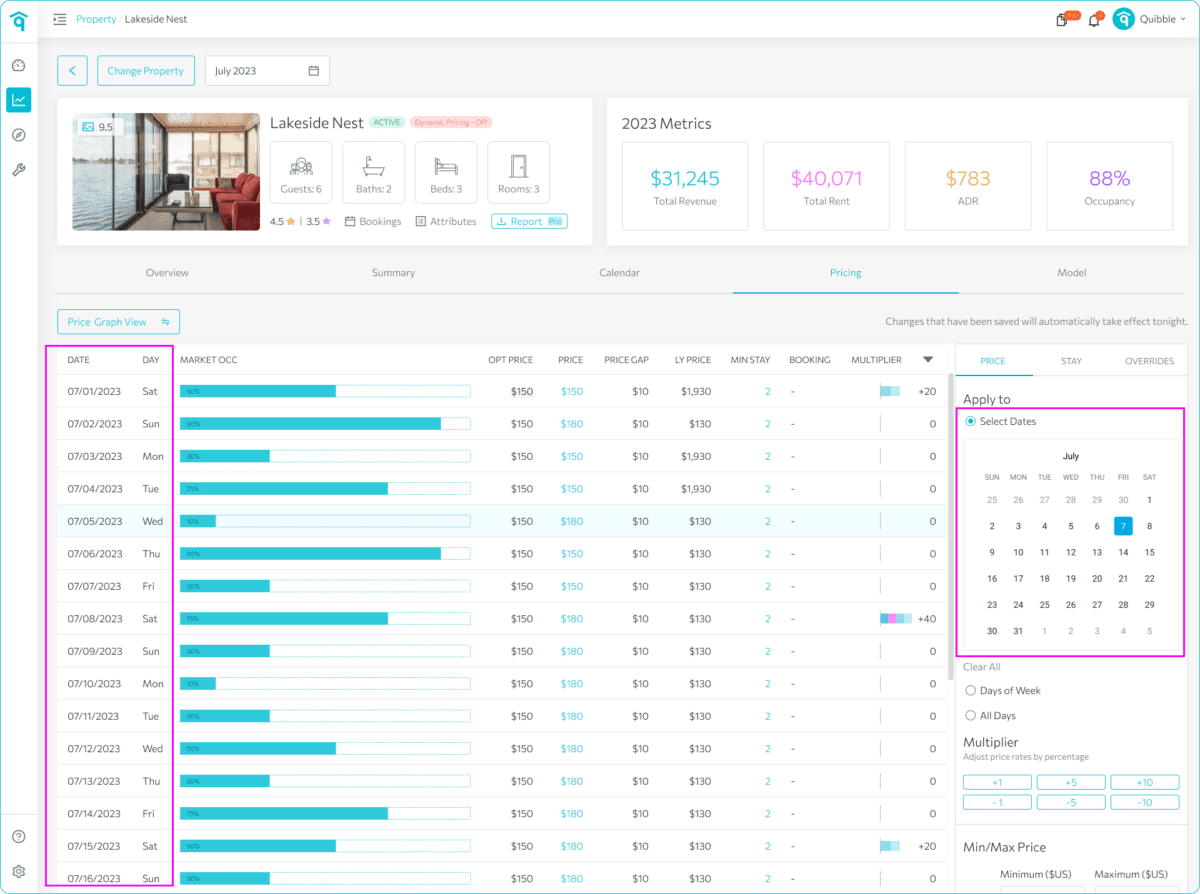
3. Select the date(s) from the calendar or directly from the table.
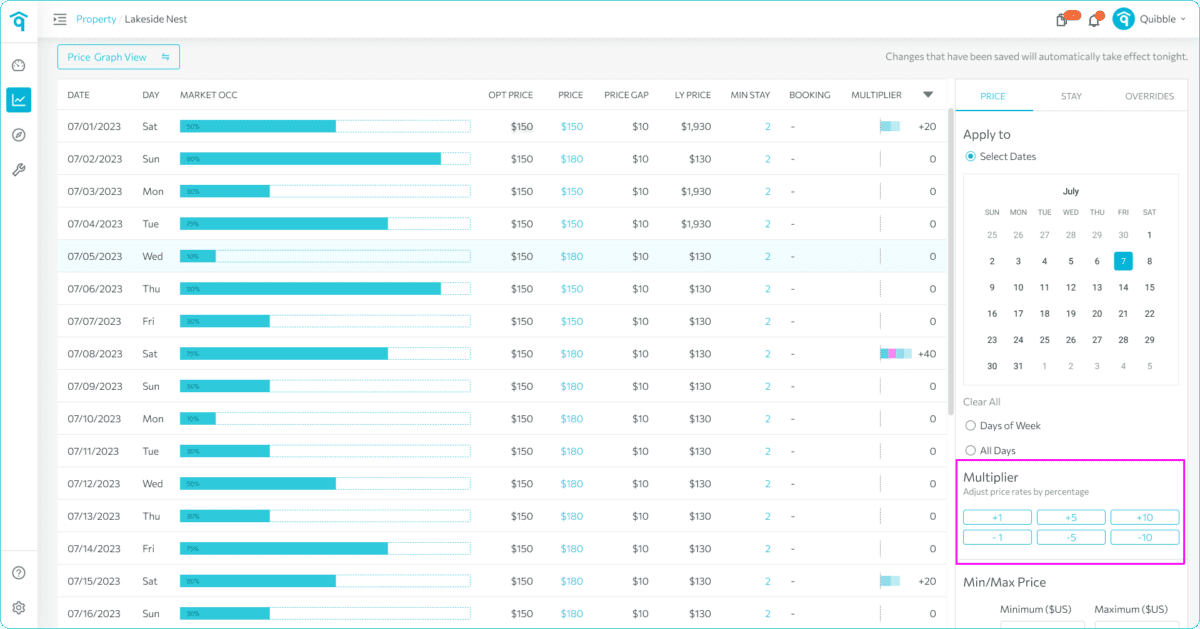
4. Choose your desired multiplier to adjust rates by percentage.
5. Optionally, set the Min/Max Price and configure the Far Out Price.
6. Finally, click “Save” to apply changes before the end of the day or “Save and Send” for real-time application.
Adjusting prices from the Analytics page equips you with the tools needed to maximize revenue while staying competitive. By leveraging key metrics and applying thoughtful adjustments, you can optimize your pricing effectively. For more details on price adjustments and best practices, refer to our dedicated article here.
If you have further questions or need additional assistance, our support team is here to help. We hope this guide has been useful in setting the min/max price by month. Don’t forget to explore our other help articles and resources for more insights into managing your pricing strategy. Don’t forget to check out our other articles and resources for additional tips and best practices.

