Customizing your portfolio charts is a powerful way to monitor the performance of your short-term rental properties. By selecting the metrics most relevant to your goals—like occupancy rate, ADR, or revenue—you can create a tailored view that highlights key insights. This guide will walk you through the simple steps to configure your portfolio charts and take a more strategic approach to your data analysis.
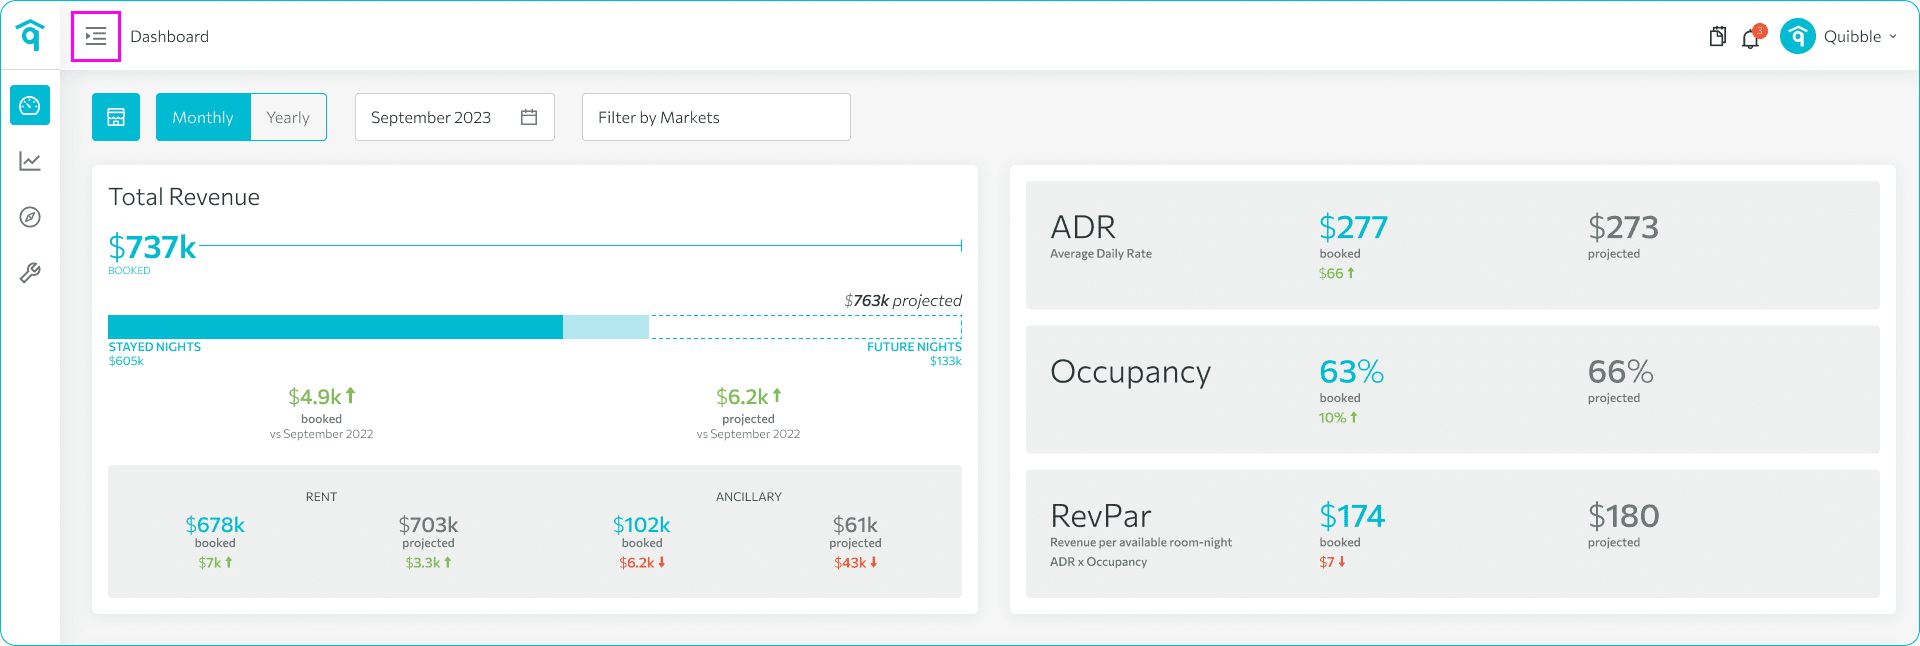
1. Navigate to the left-side menu bar.
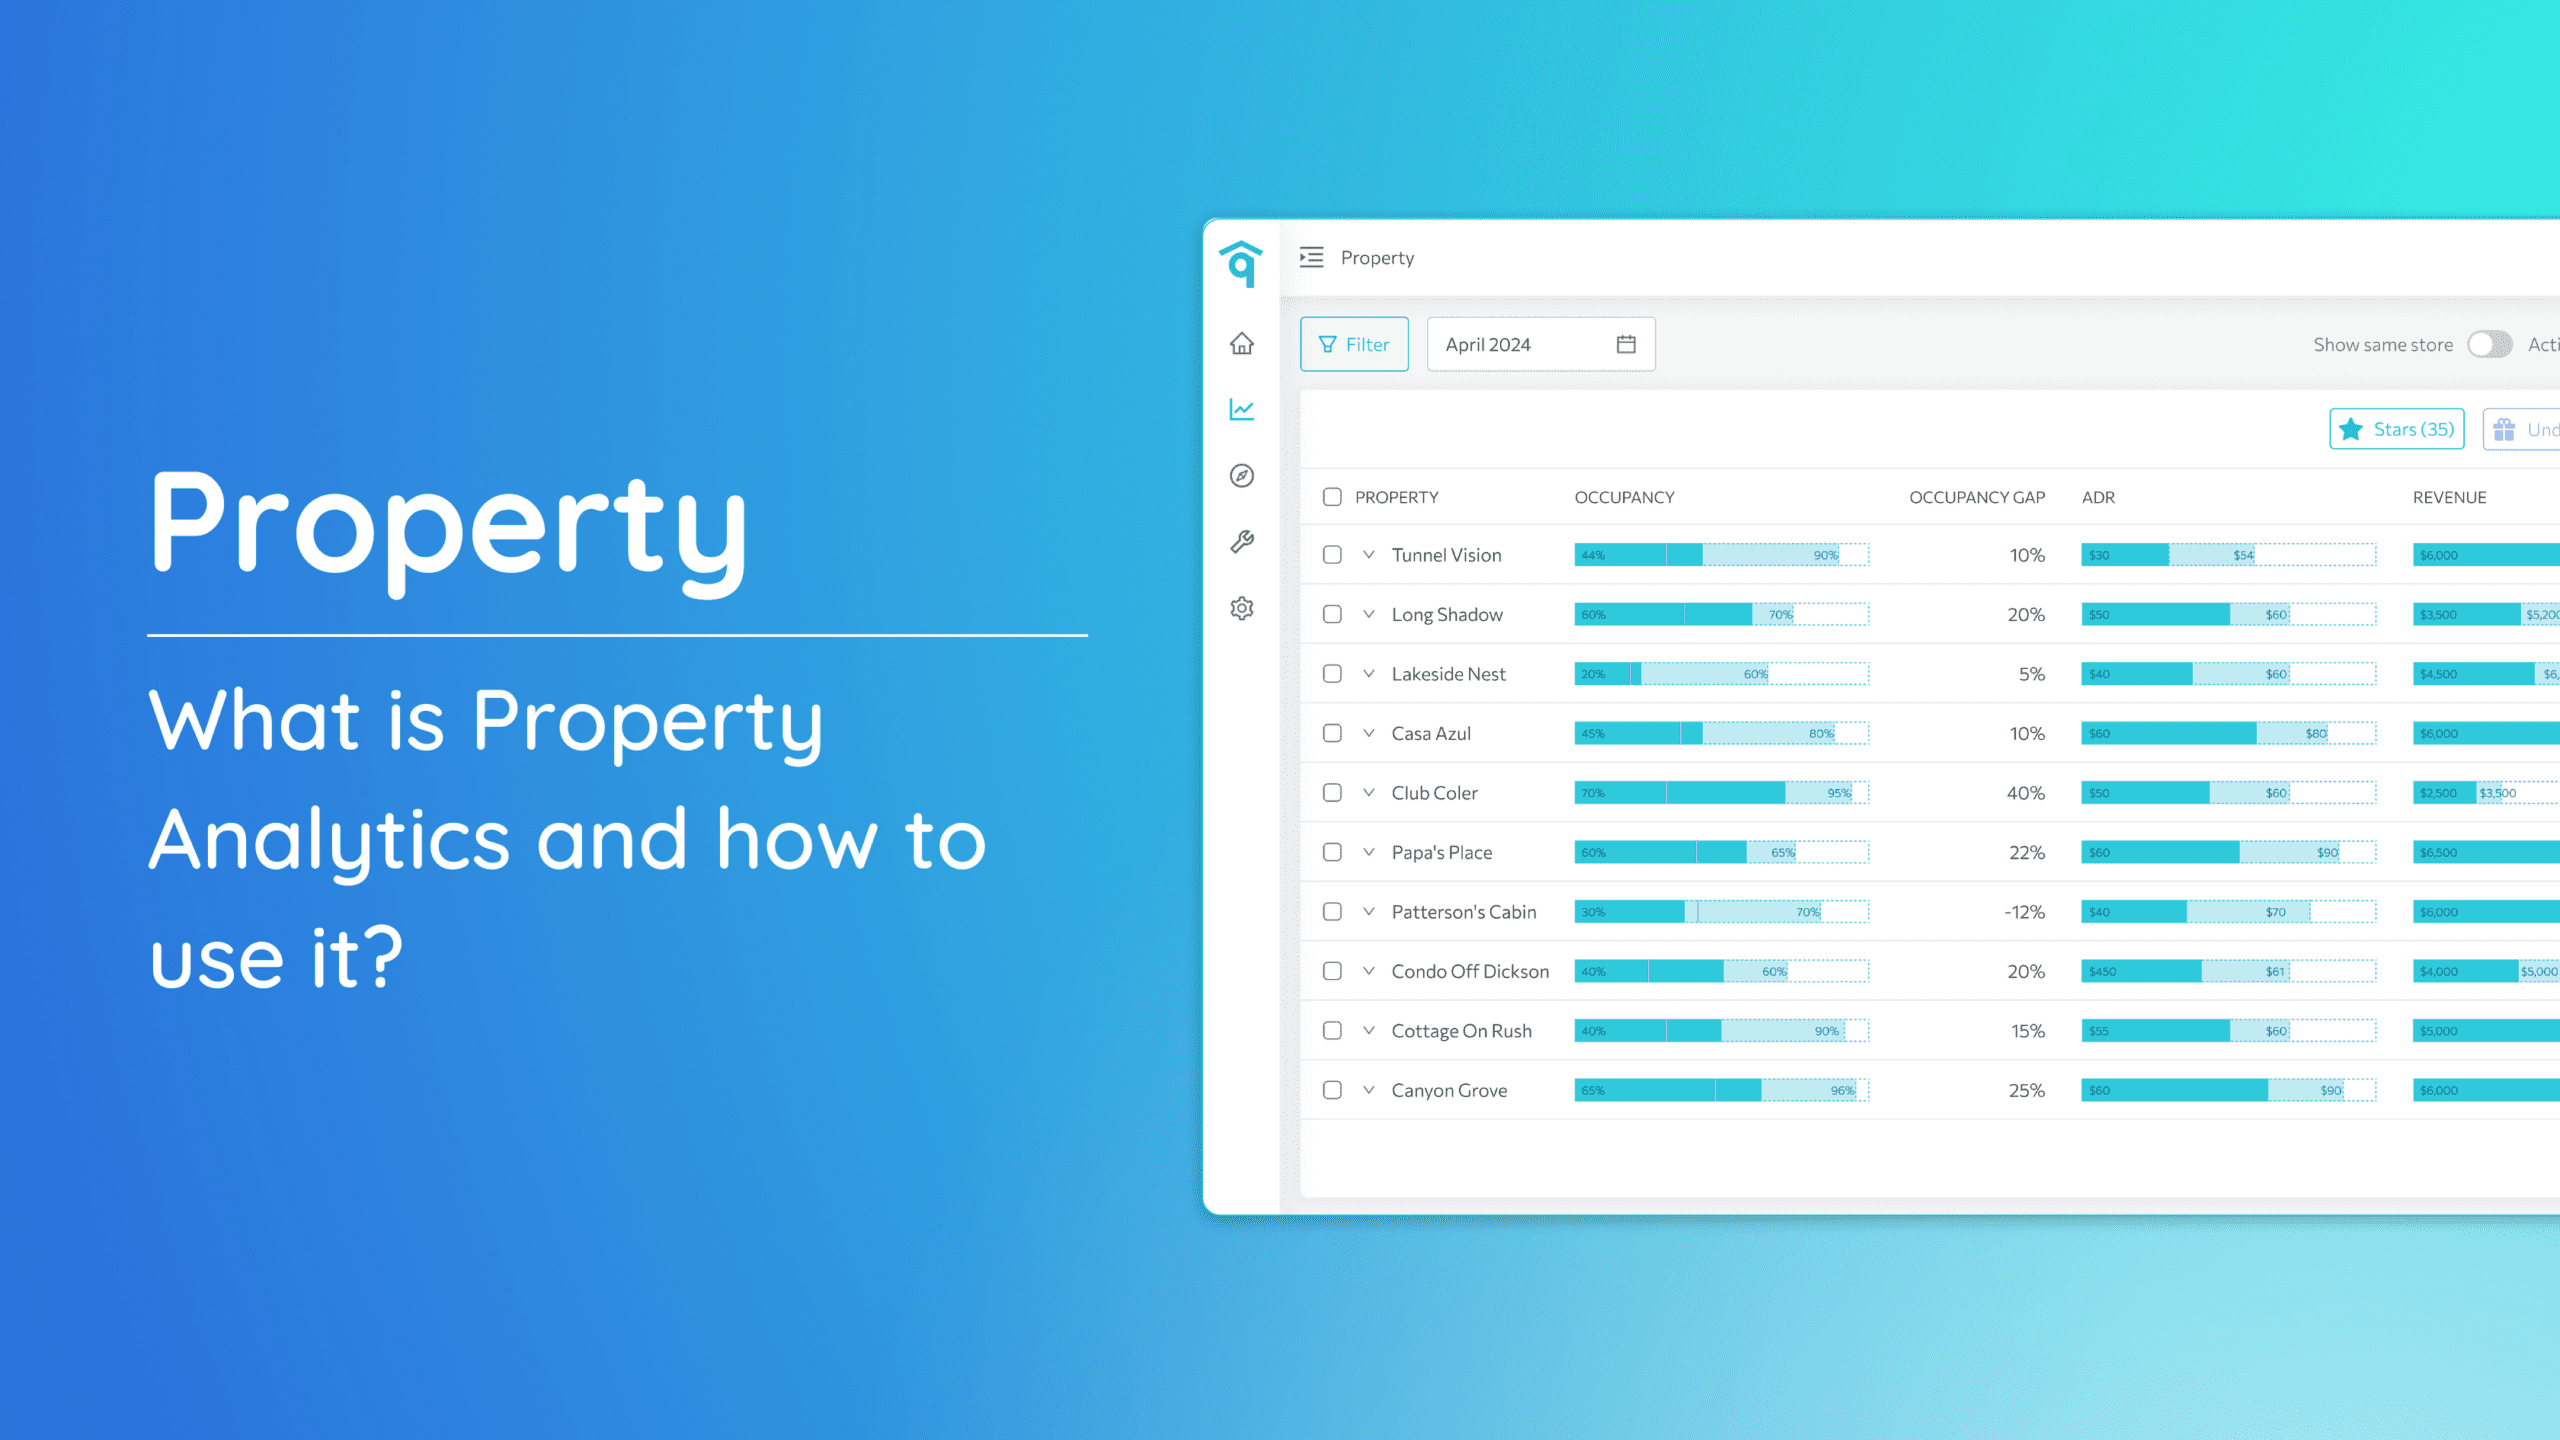
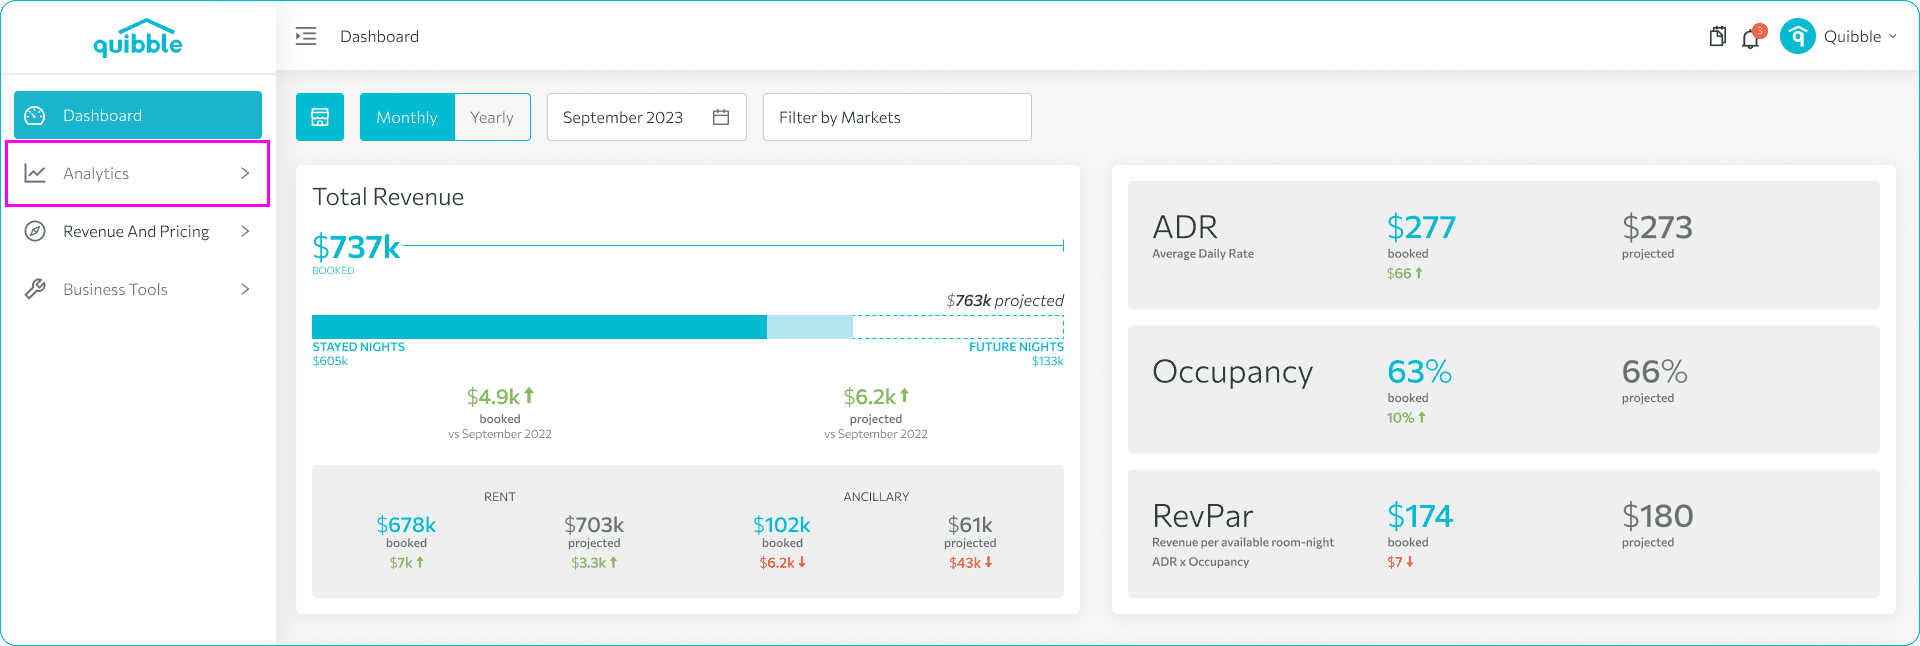
2. Click on the “Analytics” dropdown.
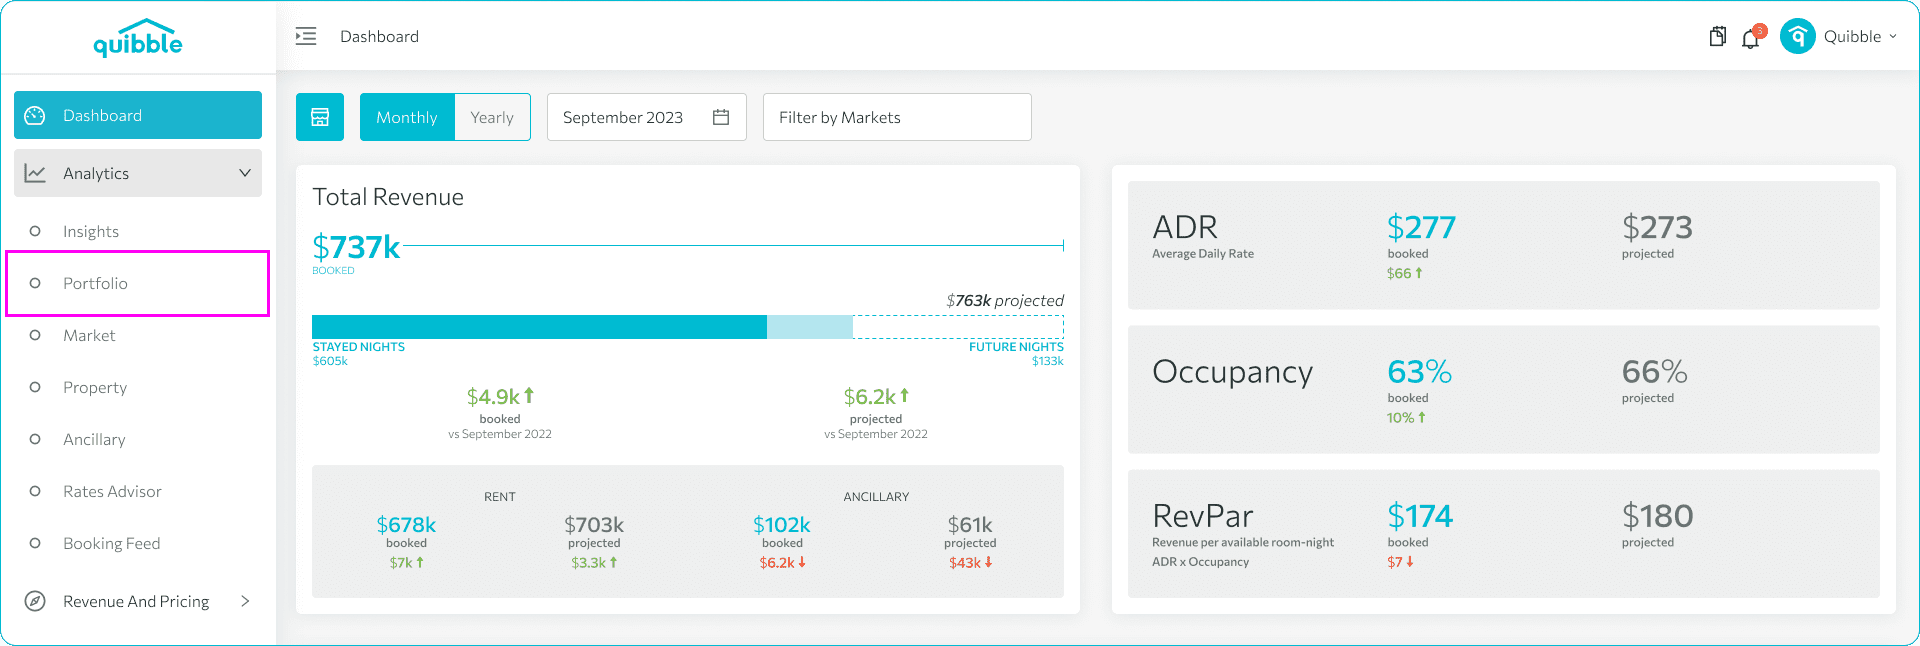
3. Choose “Portfolio.”
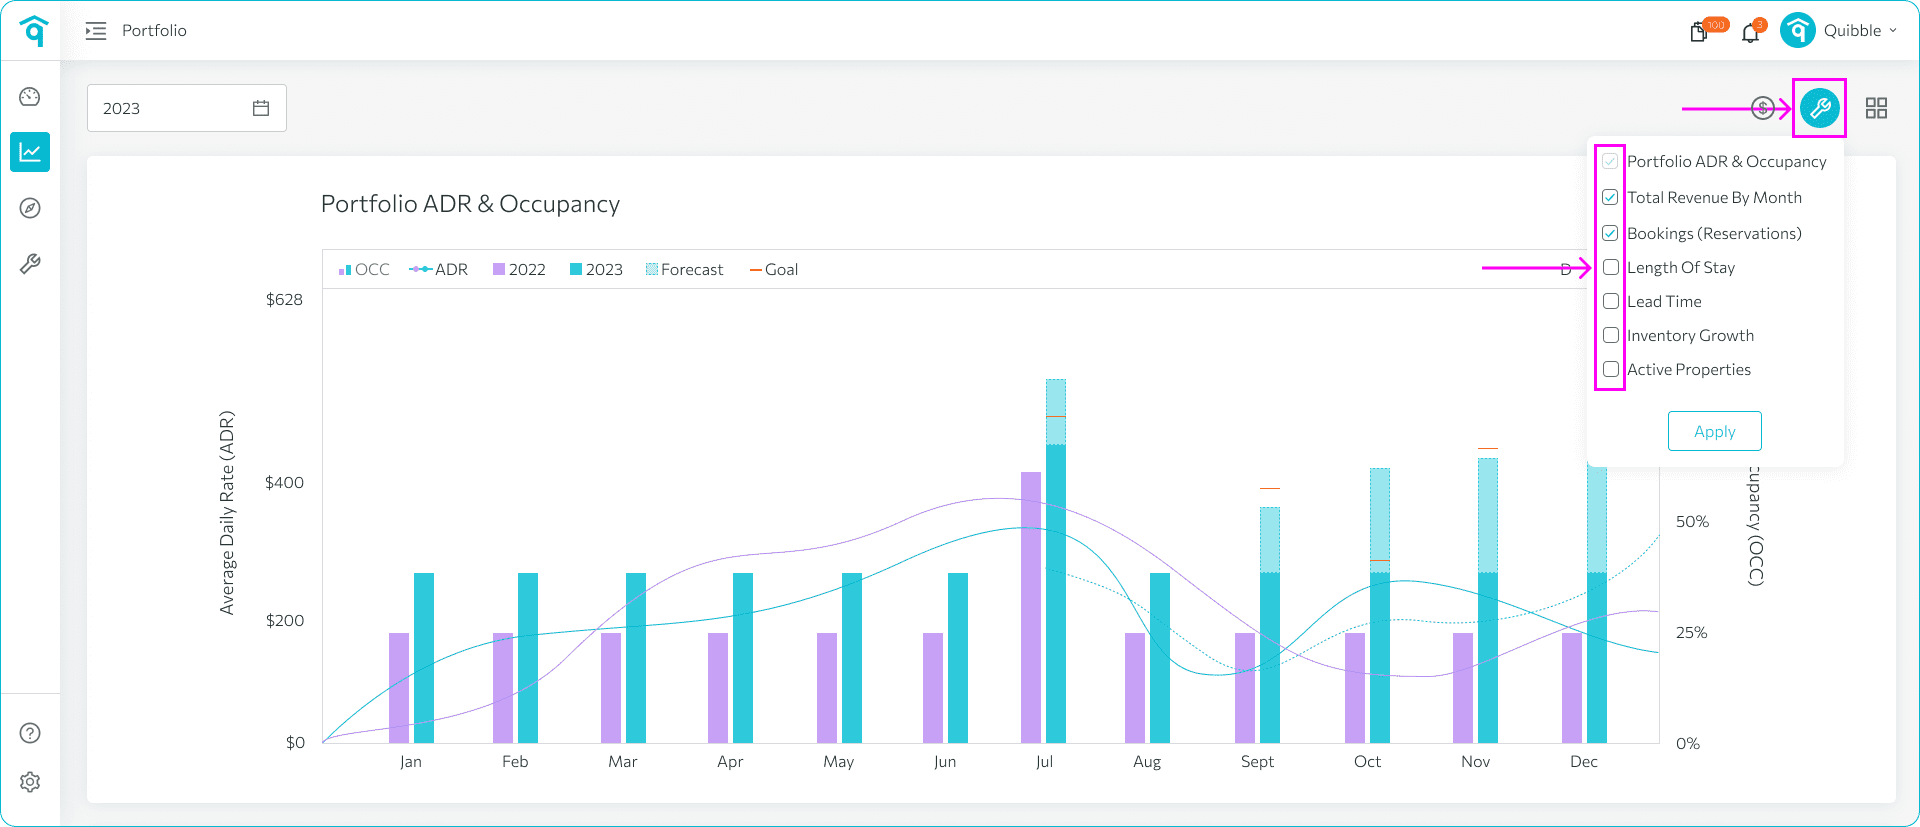
4. Look for a wrench icon on the upper-right corner and select which key metrics you want to view, such as occupancy rate, average daily rate (ADR), revenue, bookings, and other relevant metrics.
By customizing your portfolio charts, you can gain a more personalized view of your STR business’s performance. This can help you identify areas for improvement and make data-driven decisions.
If you have further questions or need additional assistance, our support team is here to help. We hope this guide has been useful in setting the min/max price by month. Don’t forget to explore our other help articles and resources for more insights into managing your pricing strategy.