Want to analyze your property’s performance in-depth? Downloading key metrics in Excel is a great way to gain valuable insights. This guide will walk you through the simple steps to download your property’s key metrics.
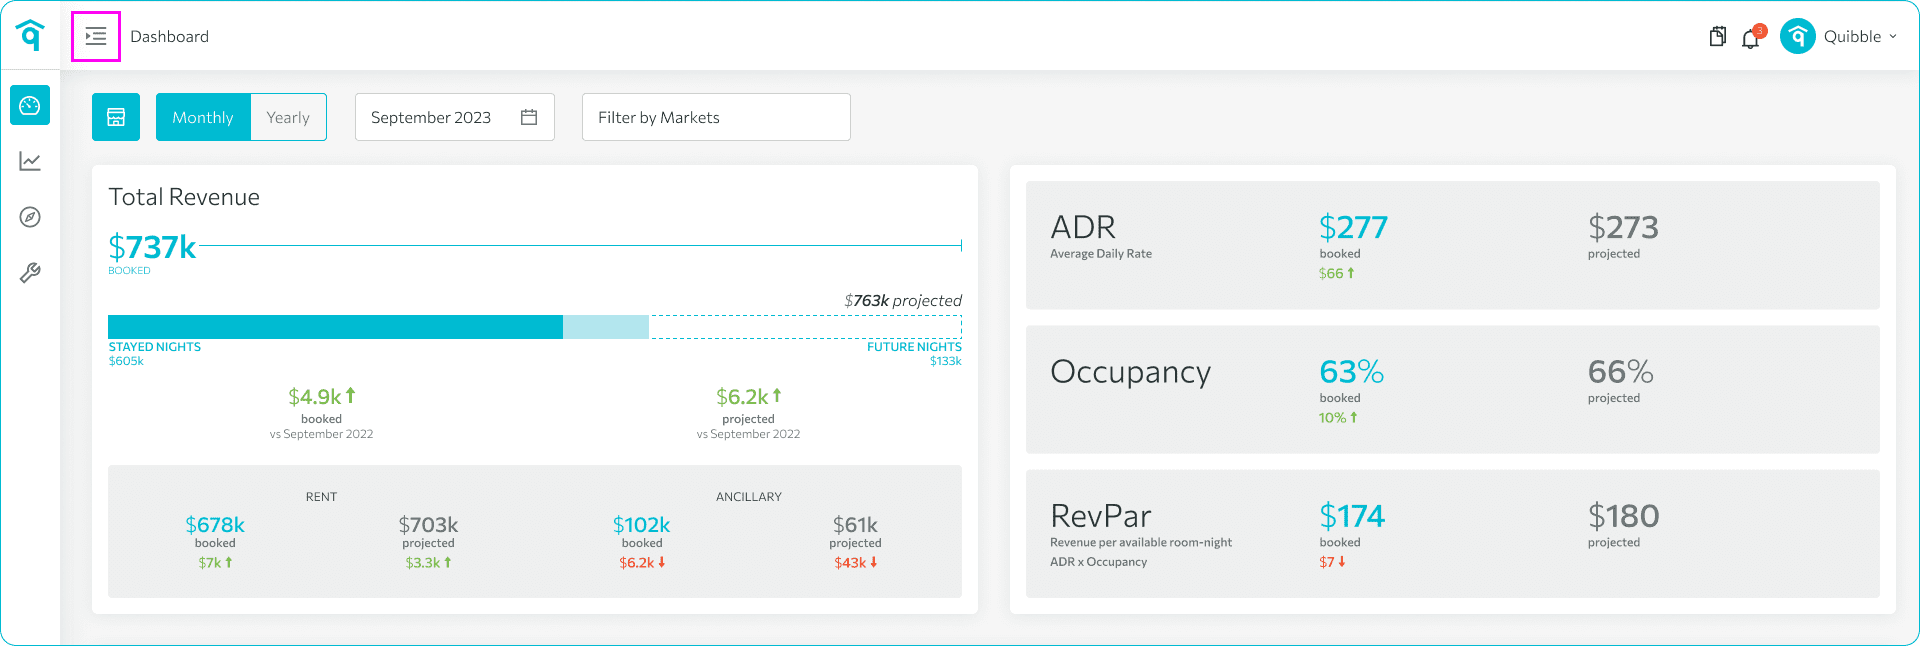
1. Navigate to the left-side menu bar.
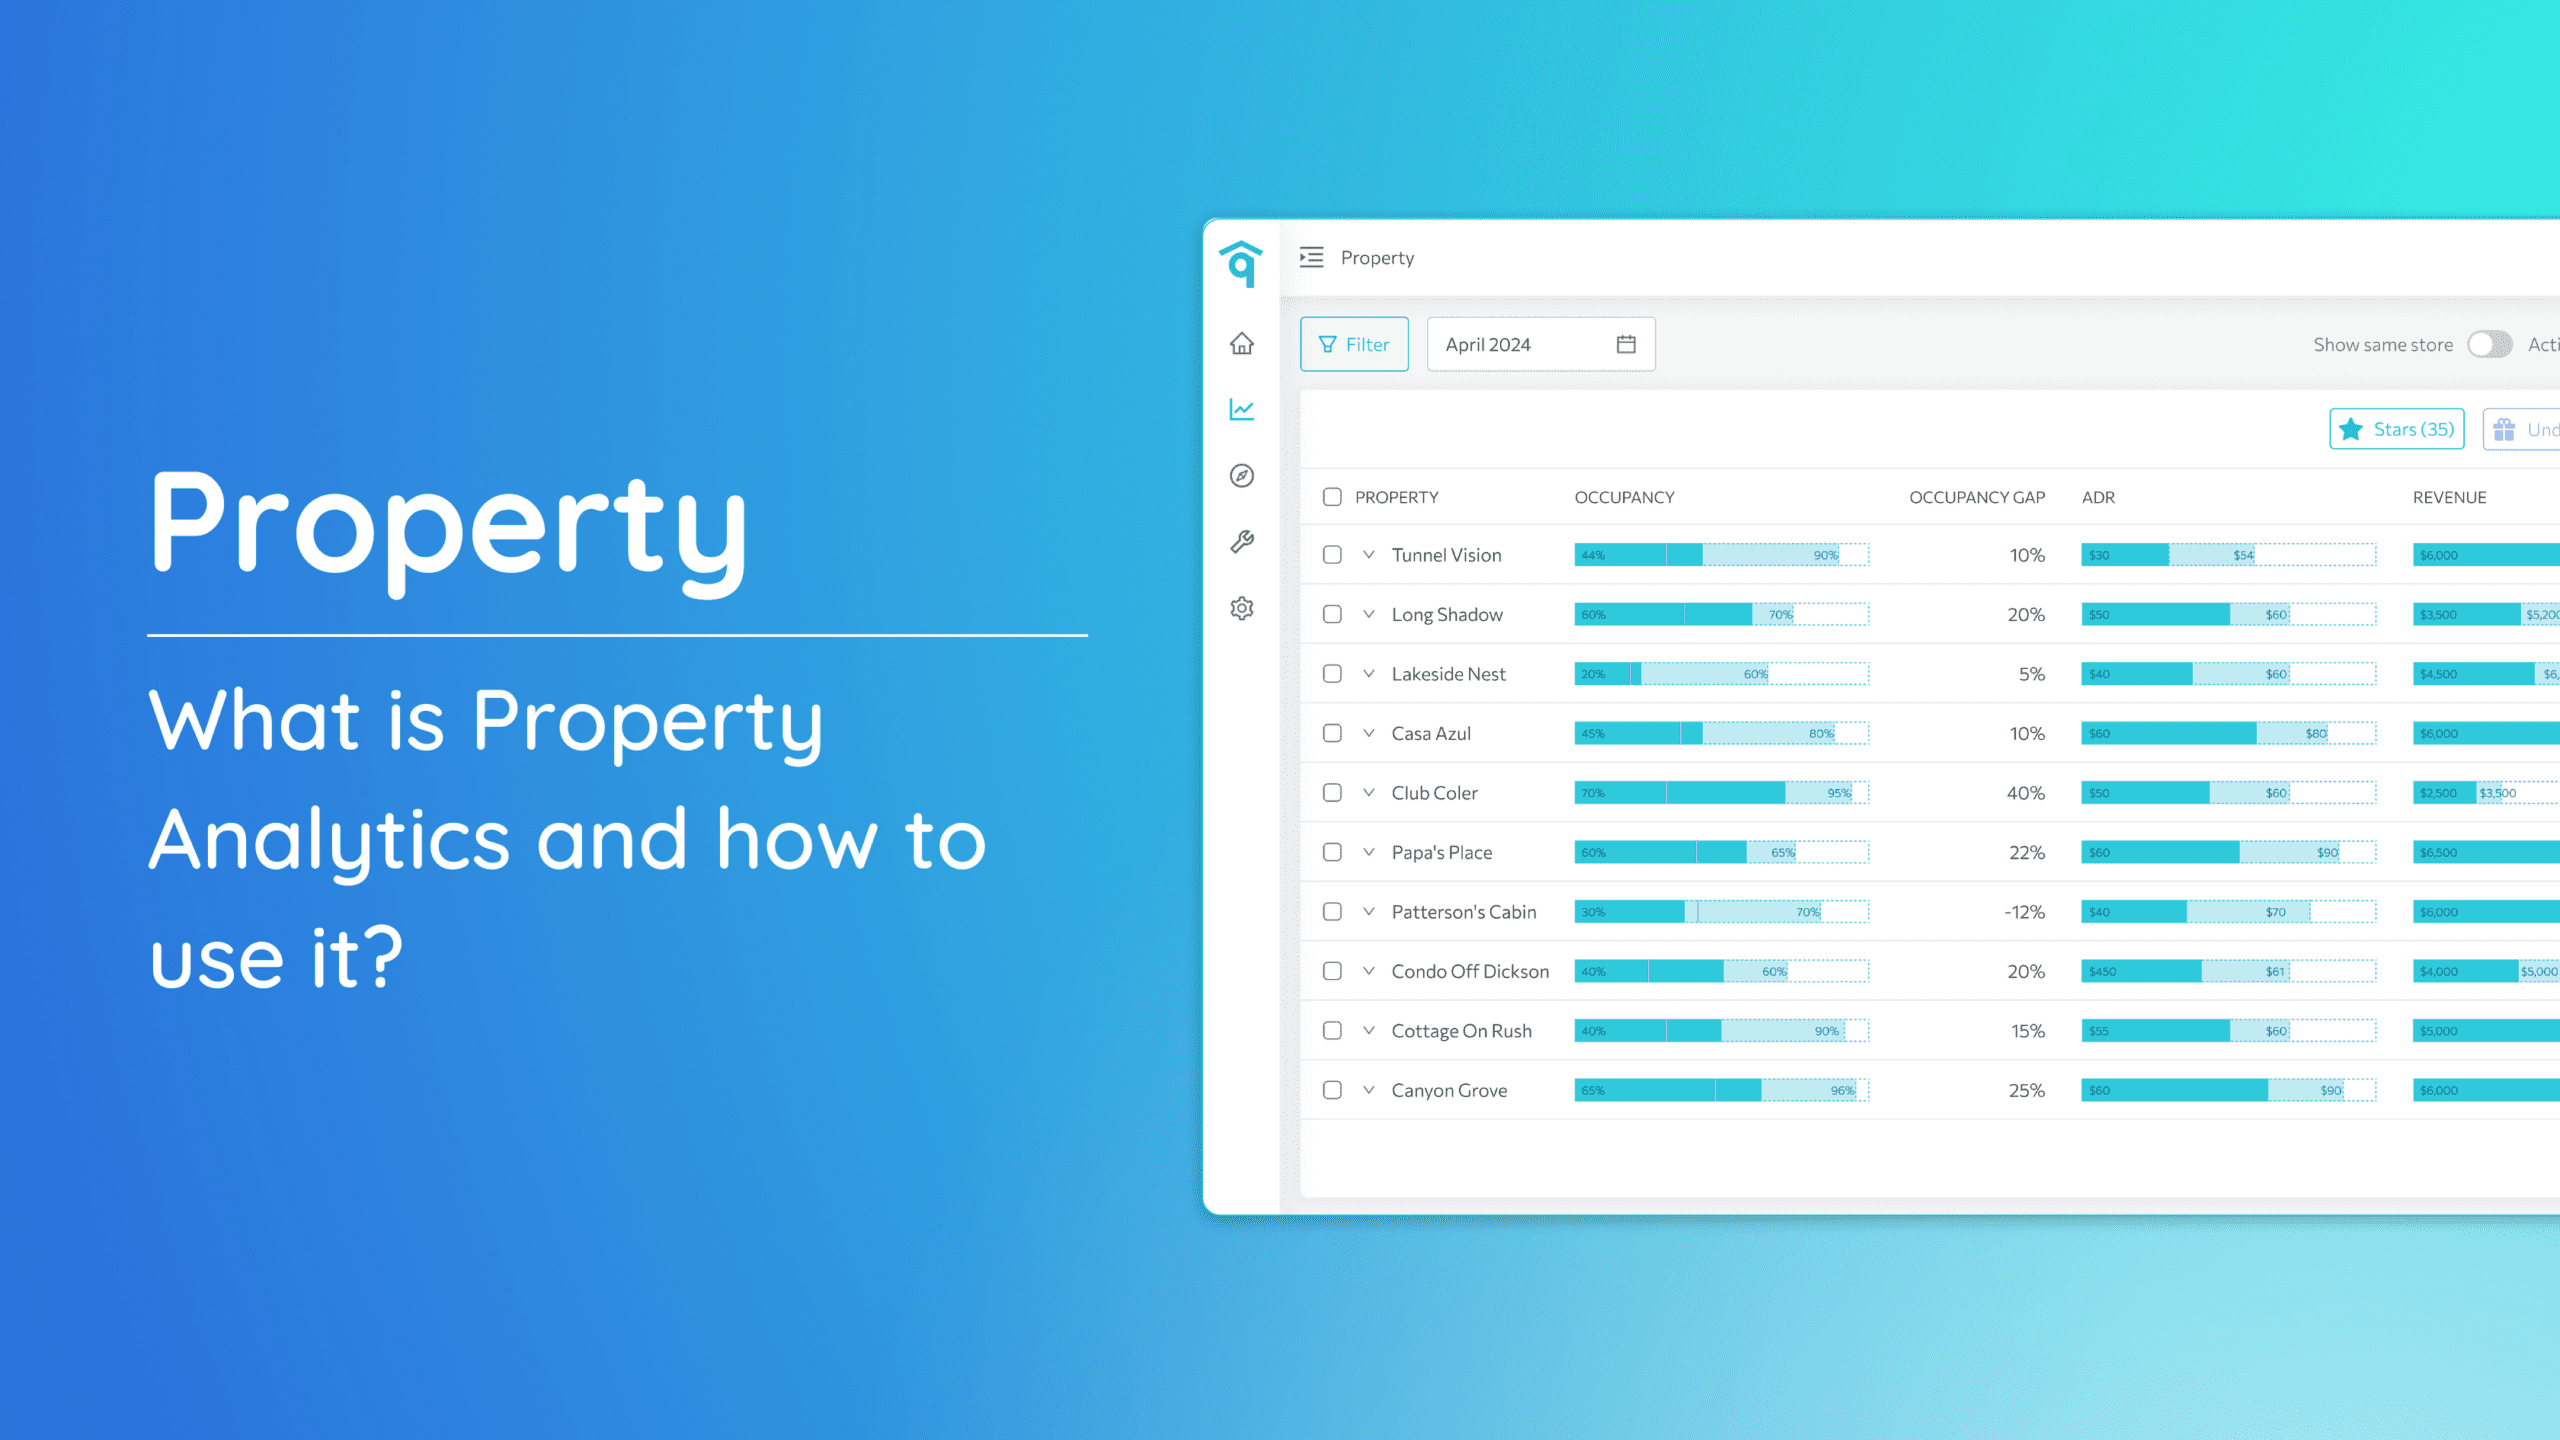
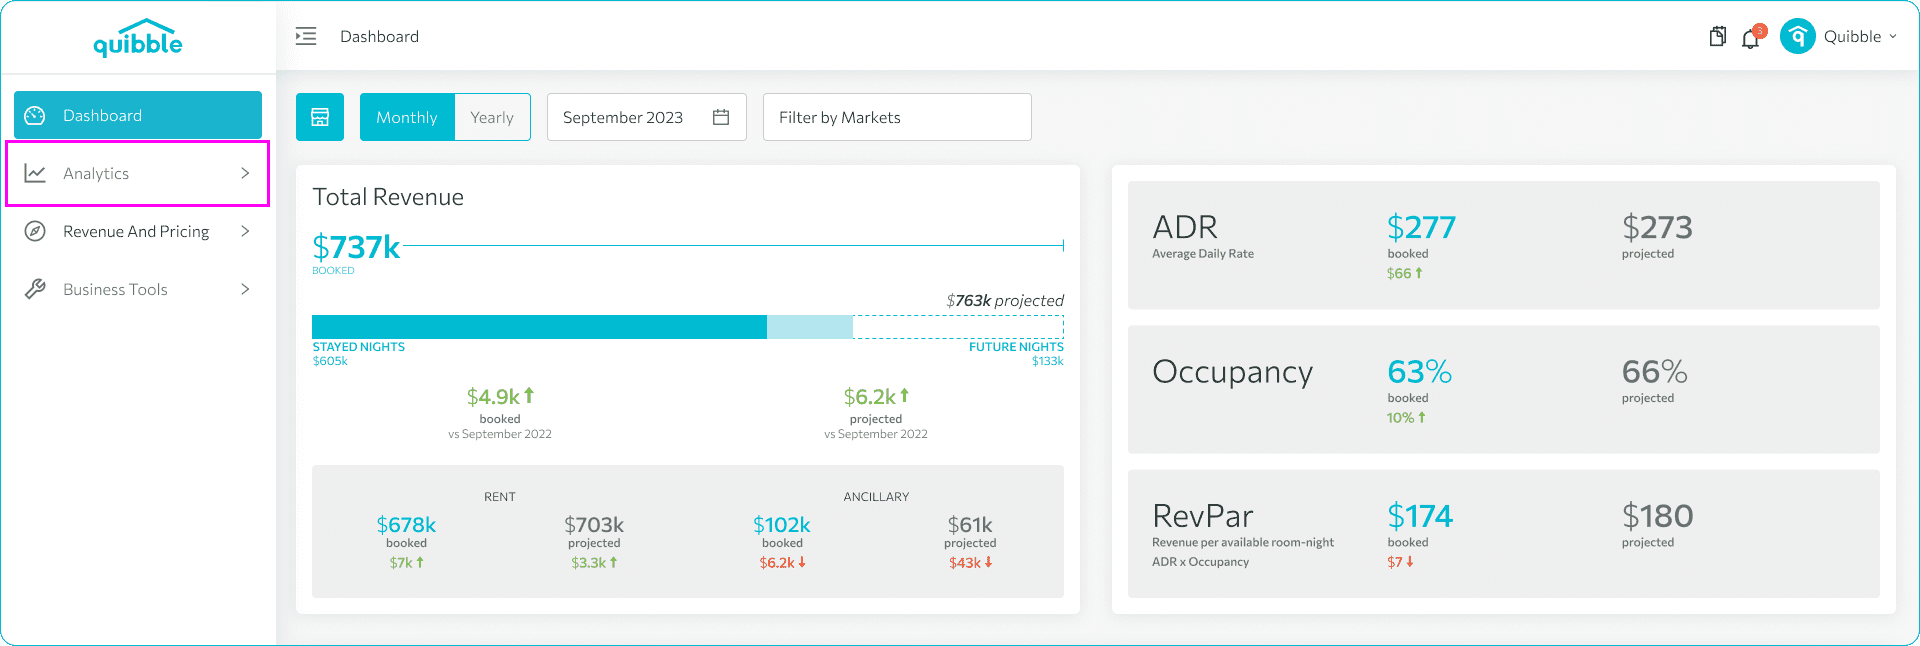
2. Click on the “Analytics” dropdown.
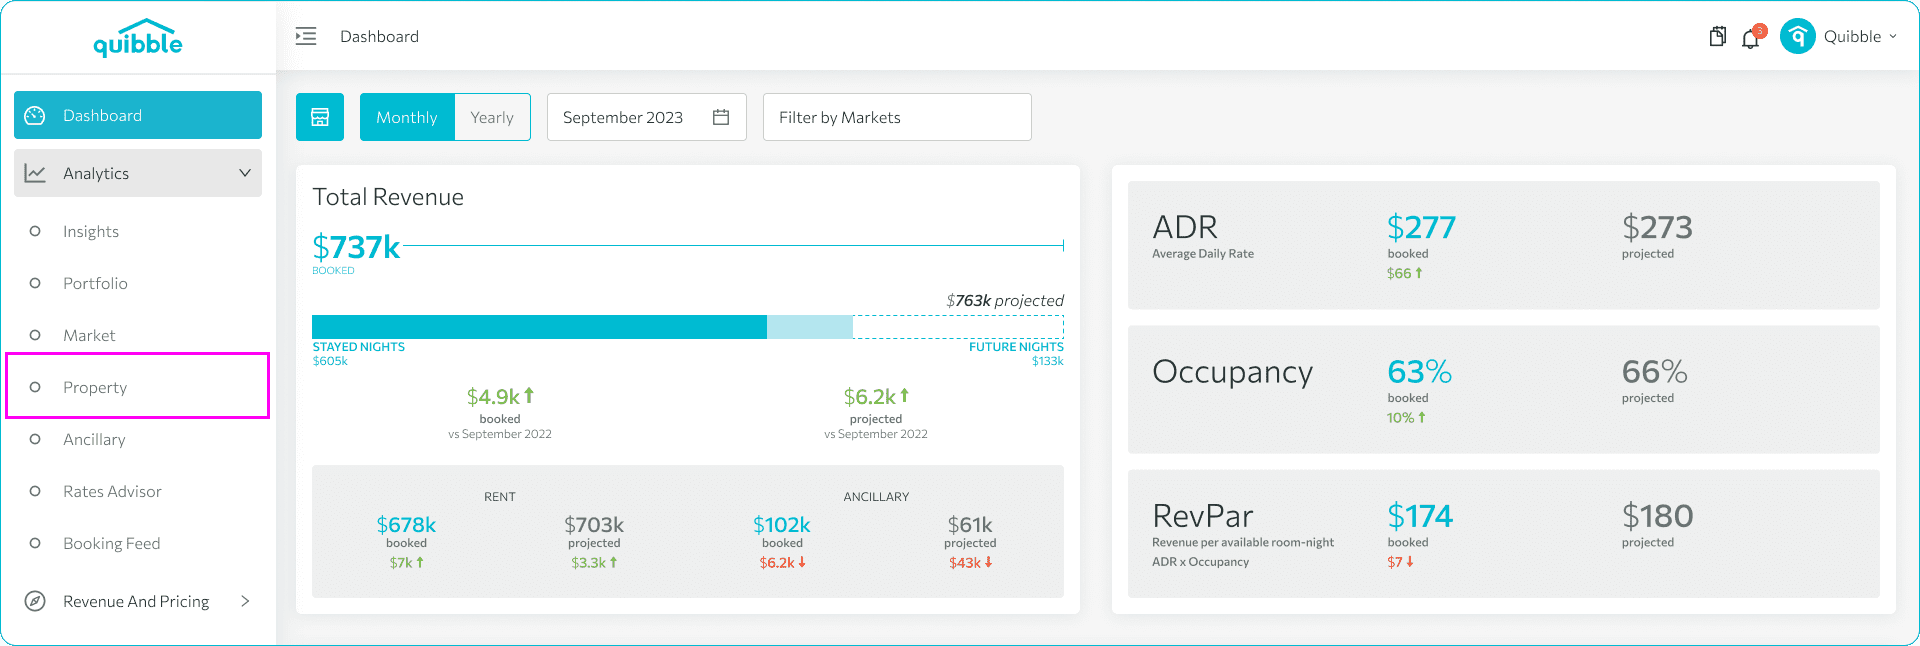
3. Select “Property.”
4. Choose the month and the year from which you want to download your property’s key metrics.
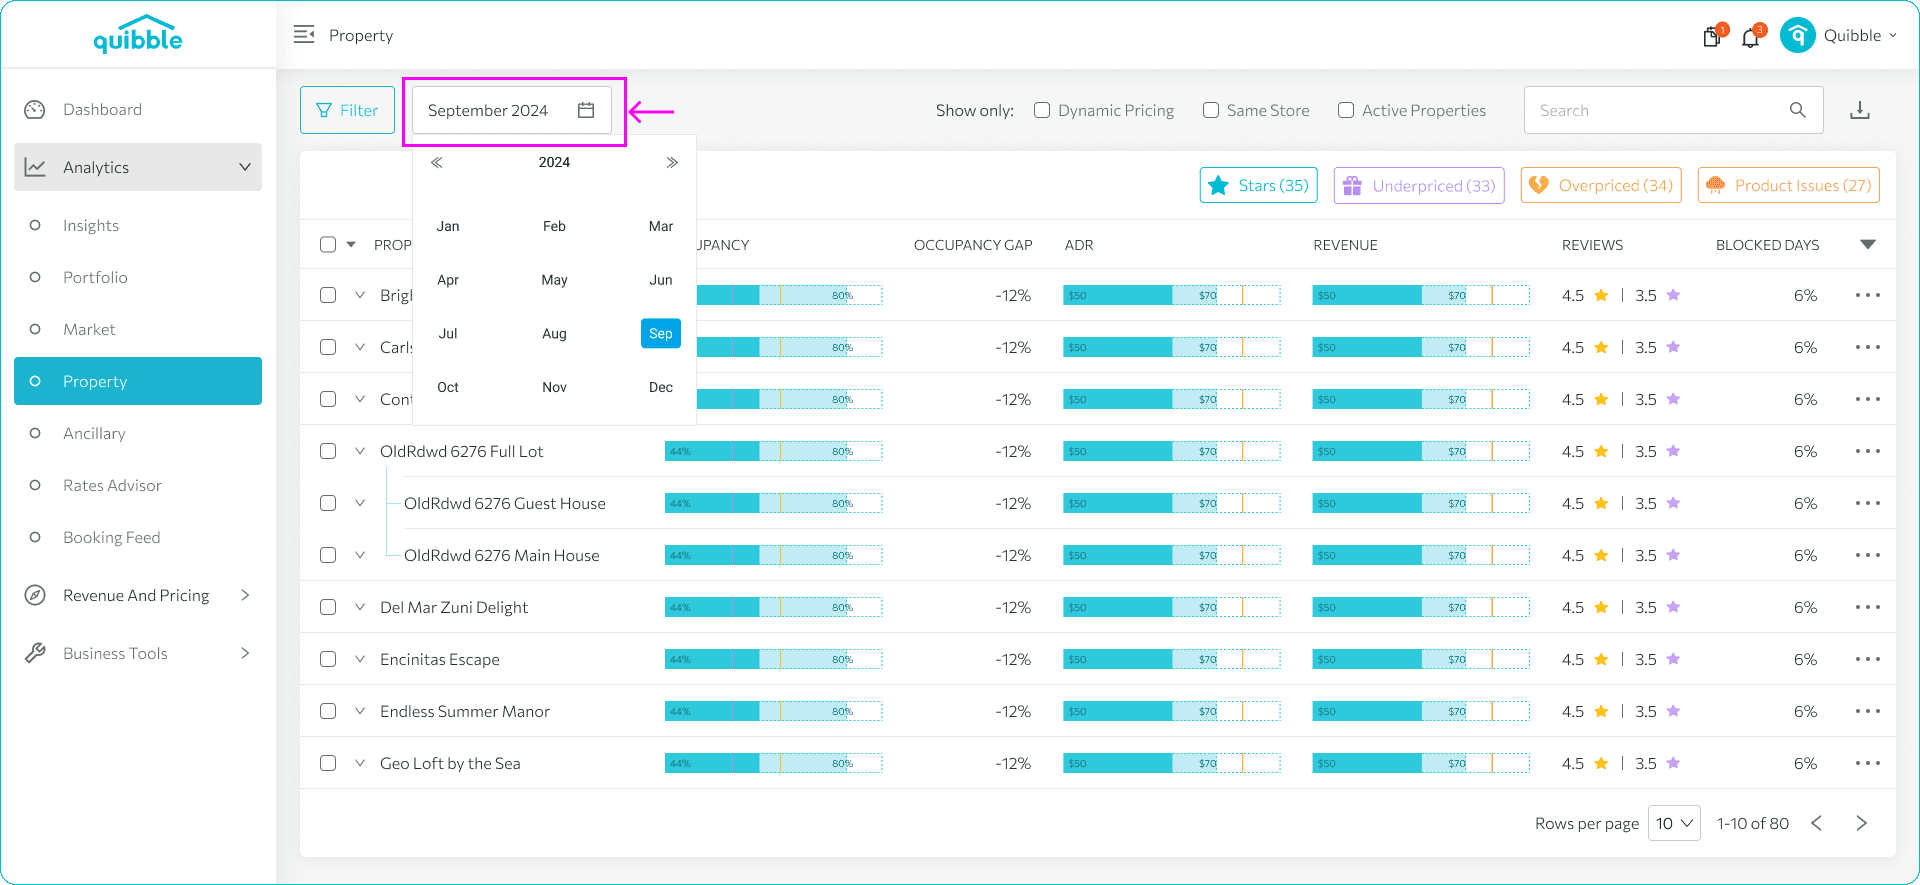
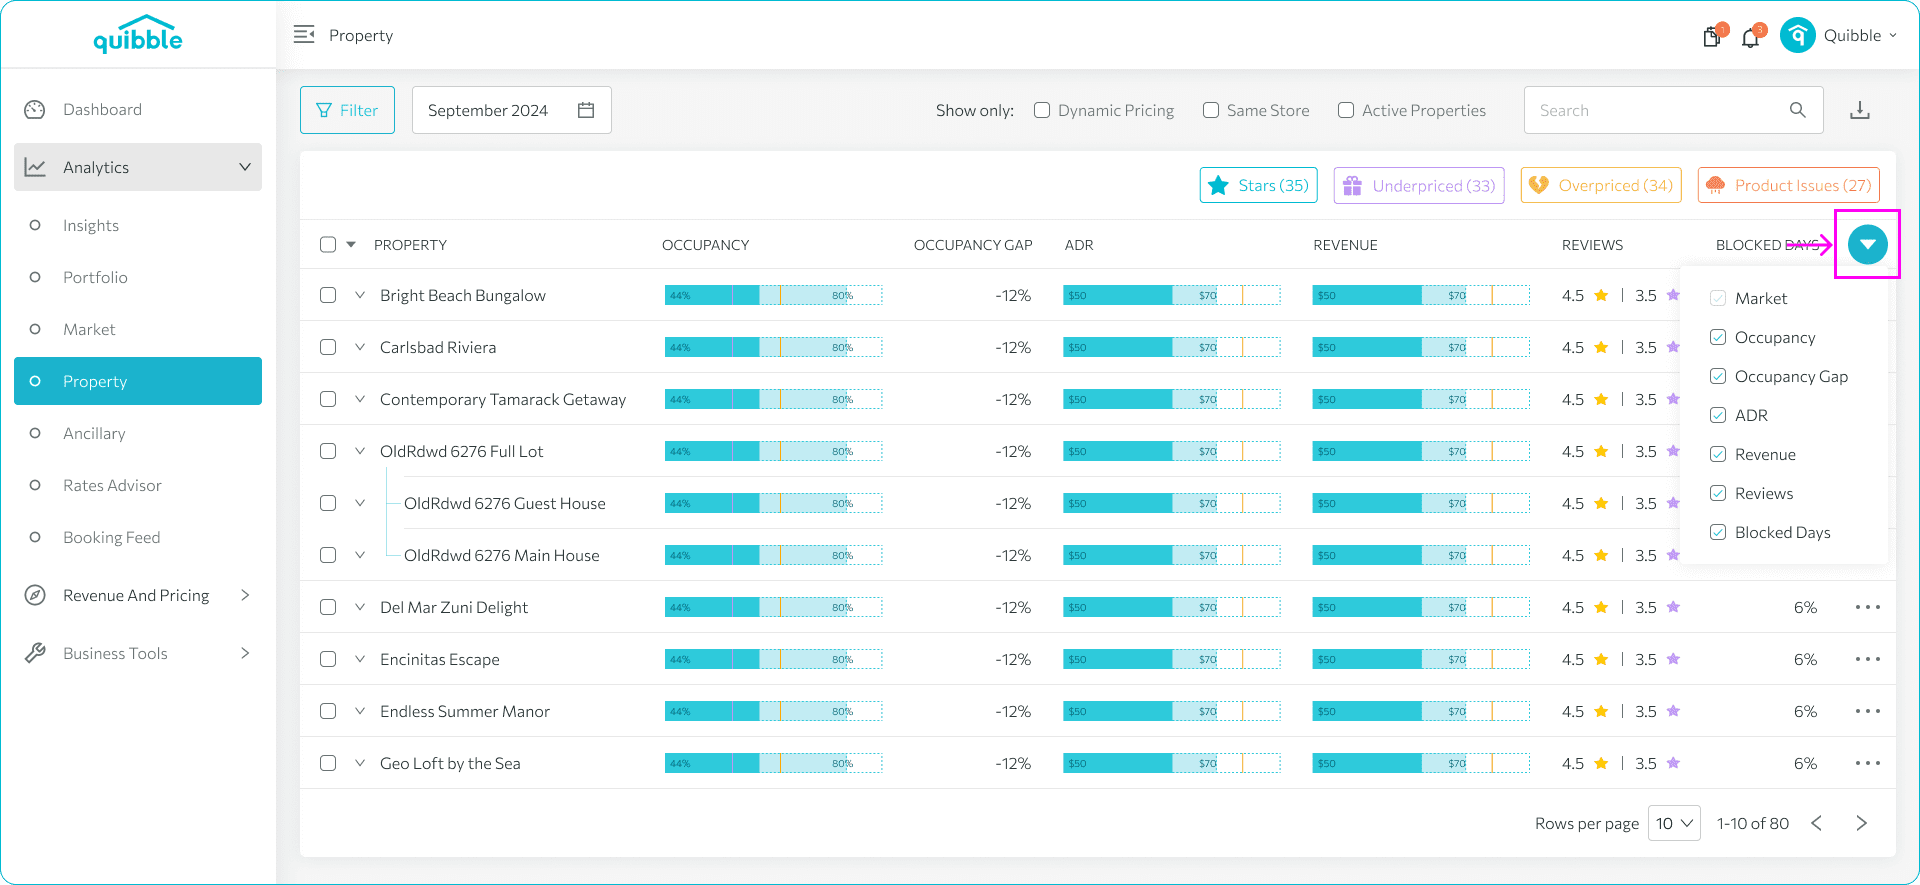
5. Customize your data by filtering the metrics by clicking the arrow down beside “Blocked Days.”
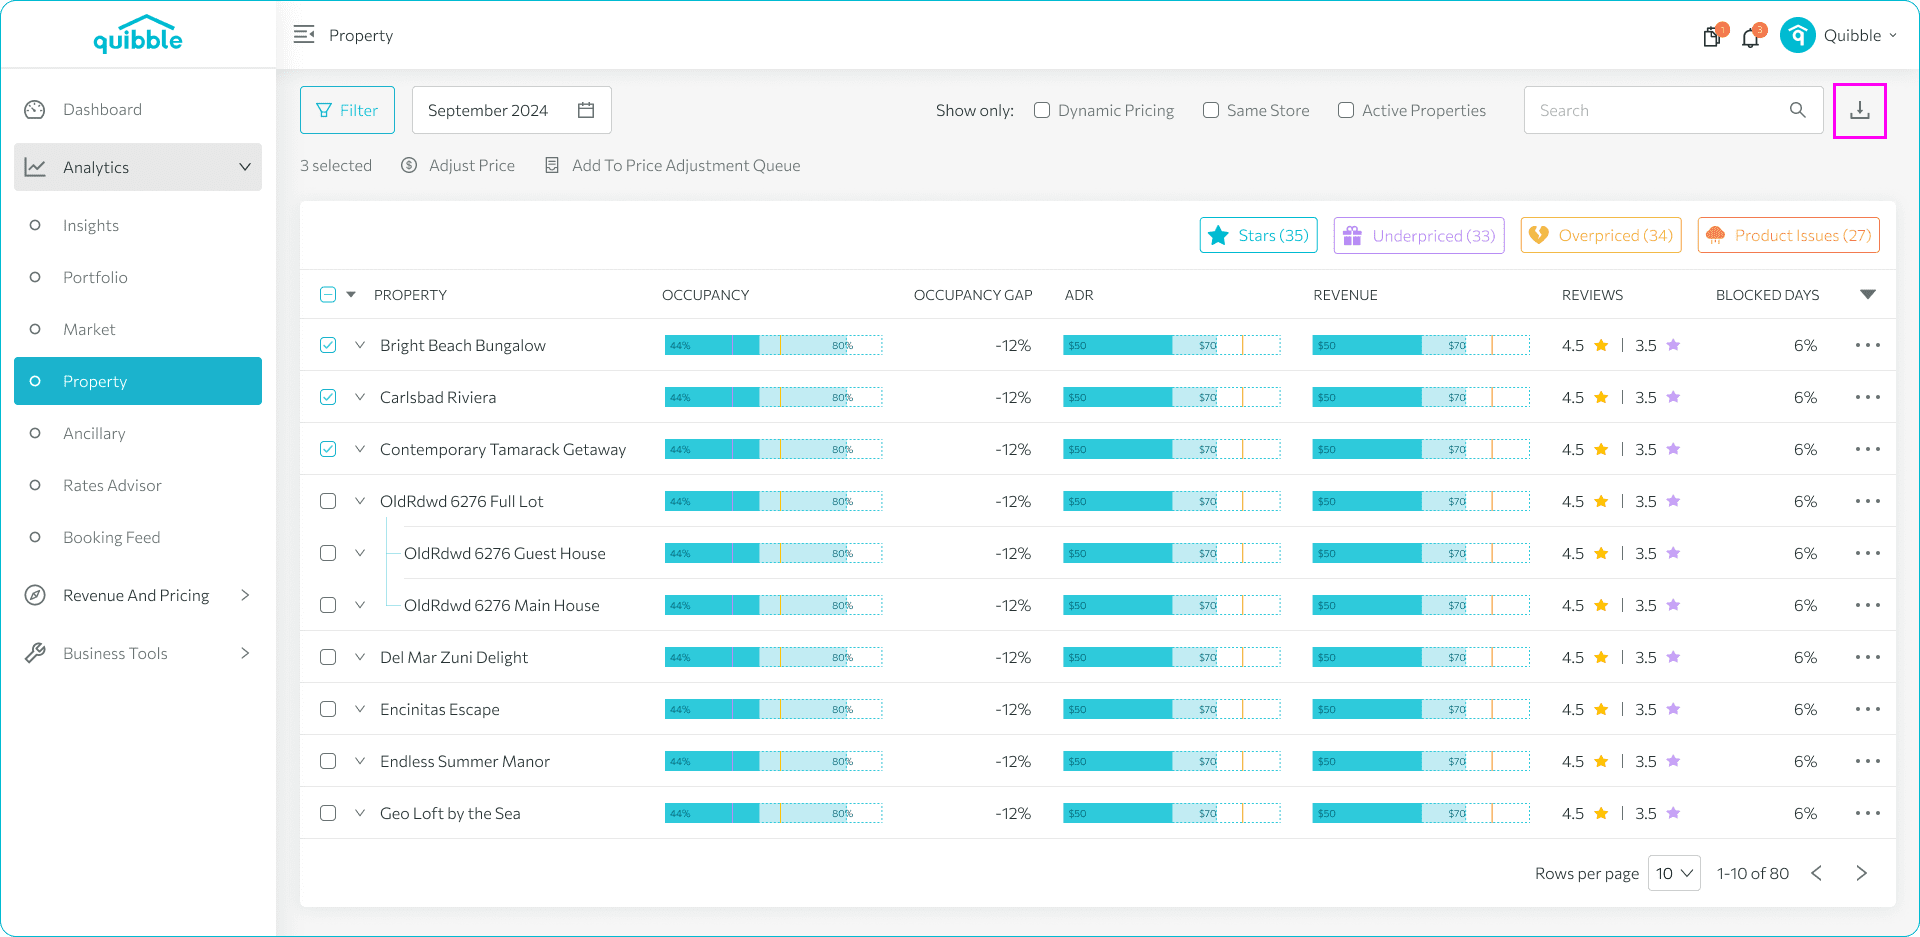
6. After selecting the date range and metrics, click the “Download” button.
By following these steps, you can easily access and analyze your property’s key performance indicators.
If you have further questions or need additional assistance, our support team is here to help. We hope this guide has been useful in setting the min/max price by month. Don’t forget to explore our other help articles and resources for more insights into managing your pricing strategy.