What is Market Analytics and how to use it?
Market Analytics is a powerful tool that empowers you to effortlessly monitor key metrics such as occupancy rate, ADR (Average Daily Rate), and revenue on a regional basis. This feature allows you to do the adjustment of prices at a market level, enabling you to optimize the property’s performance.
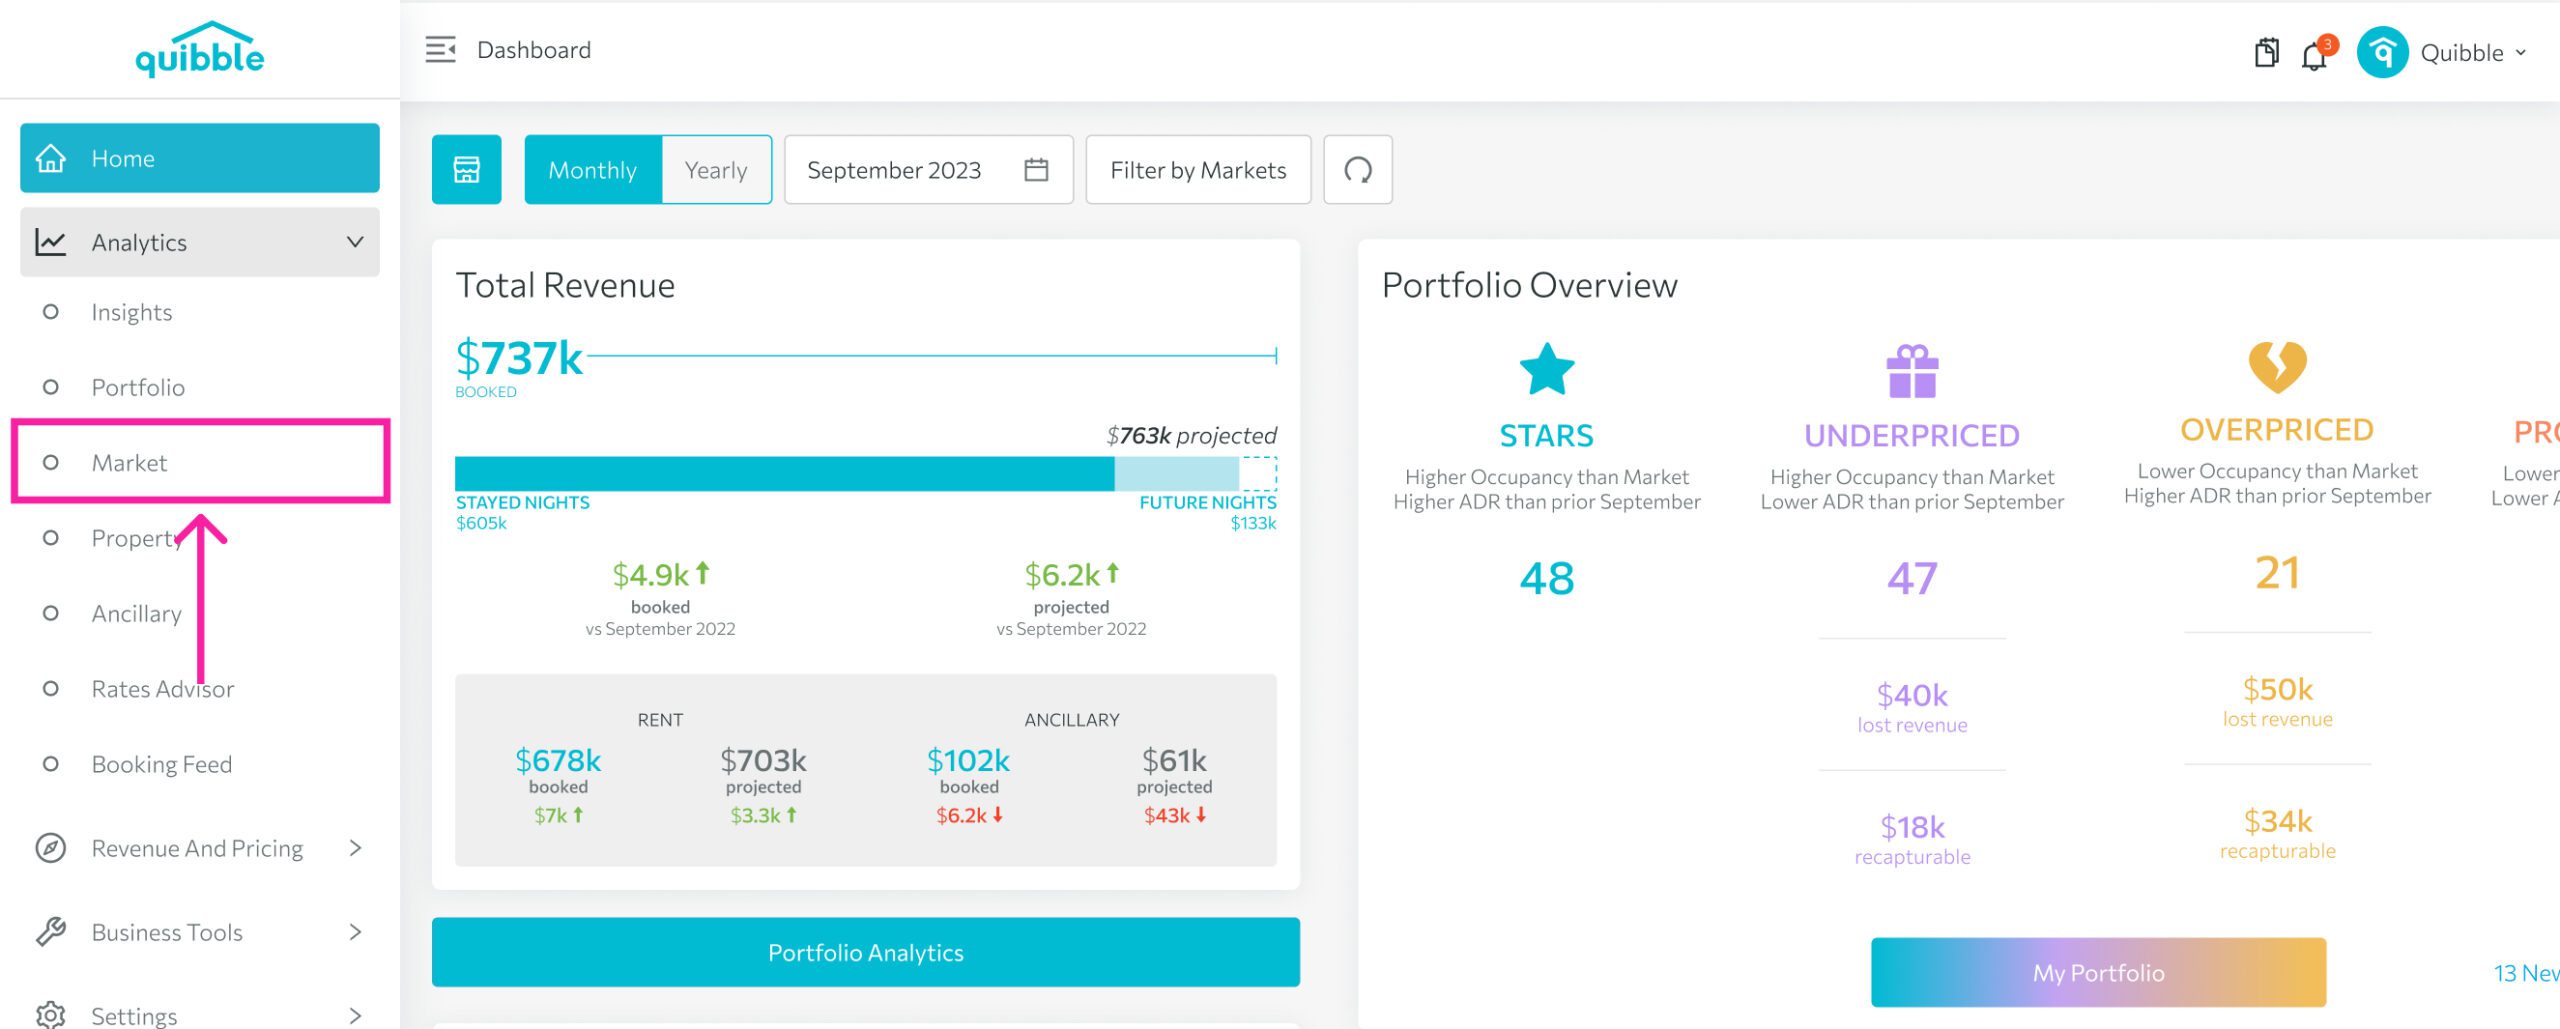
Accessing Market Analytics:
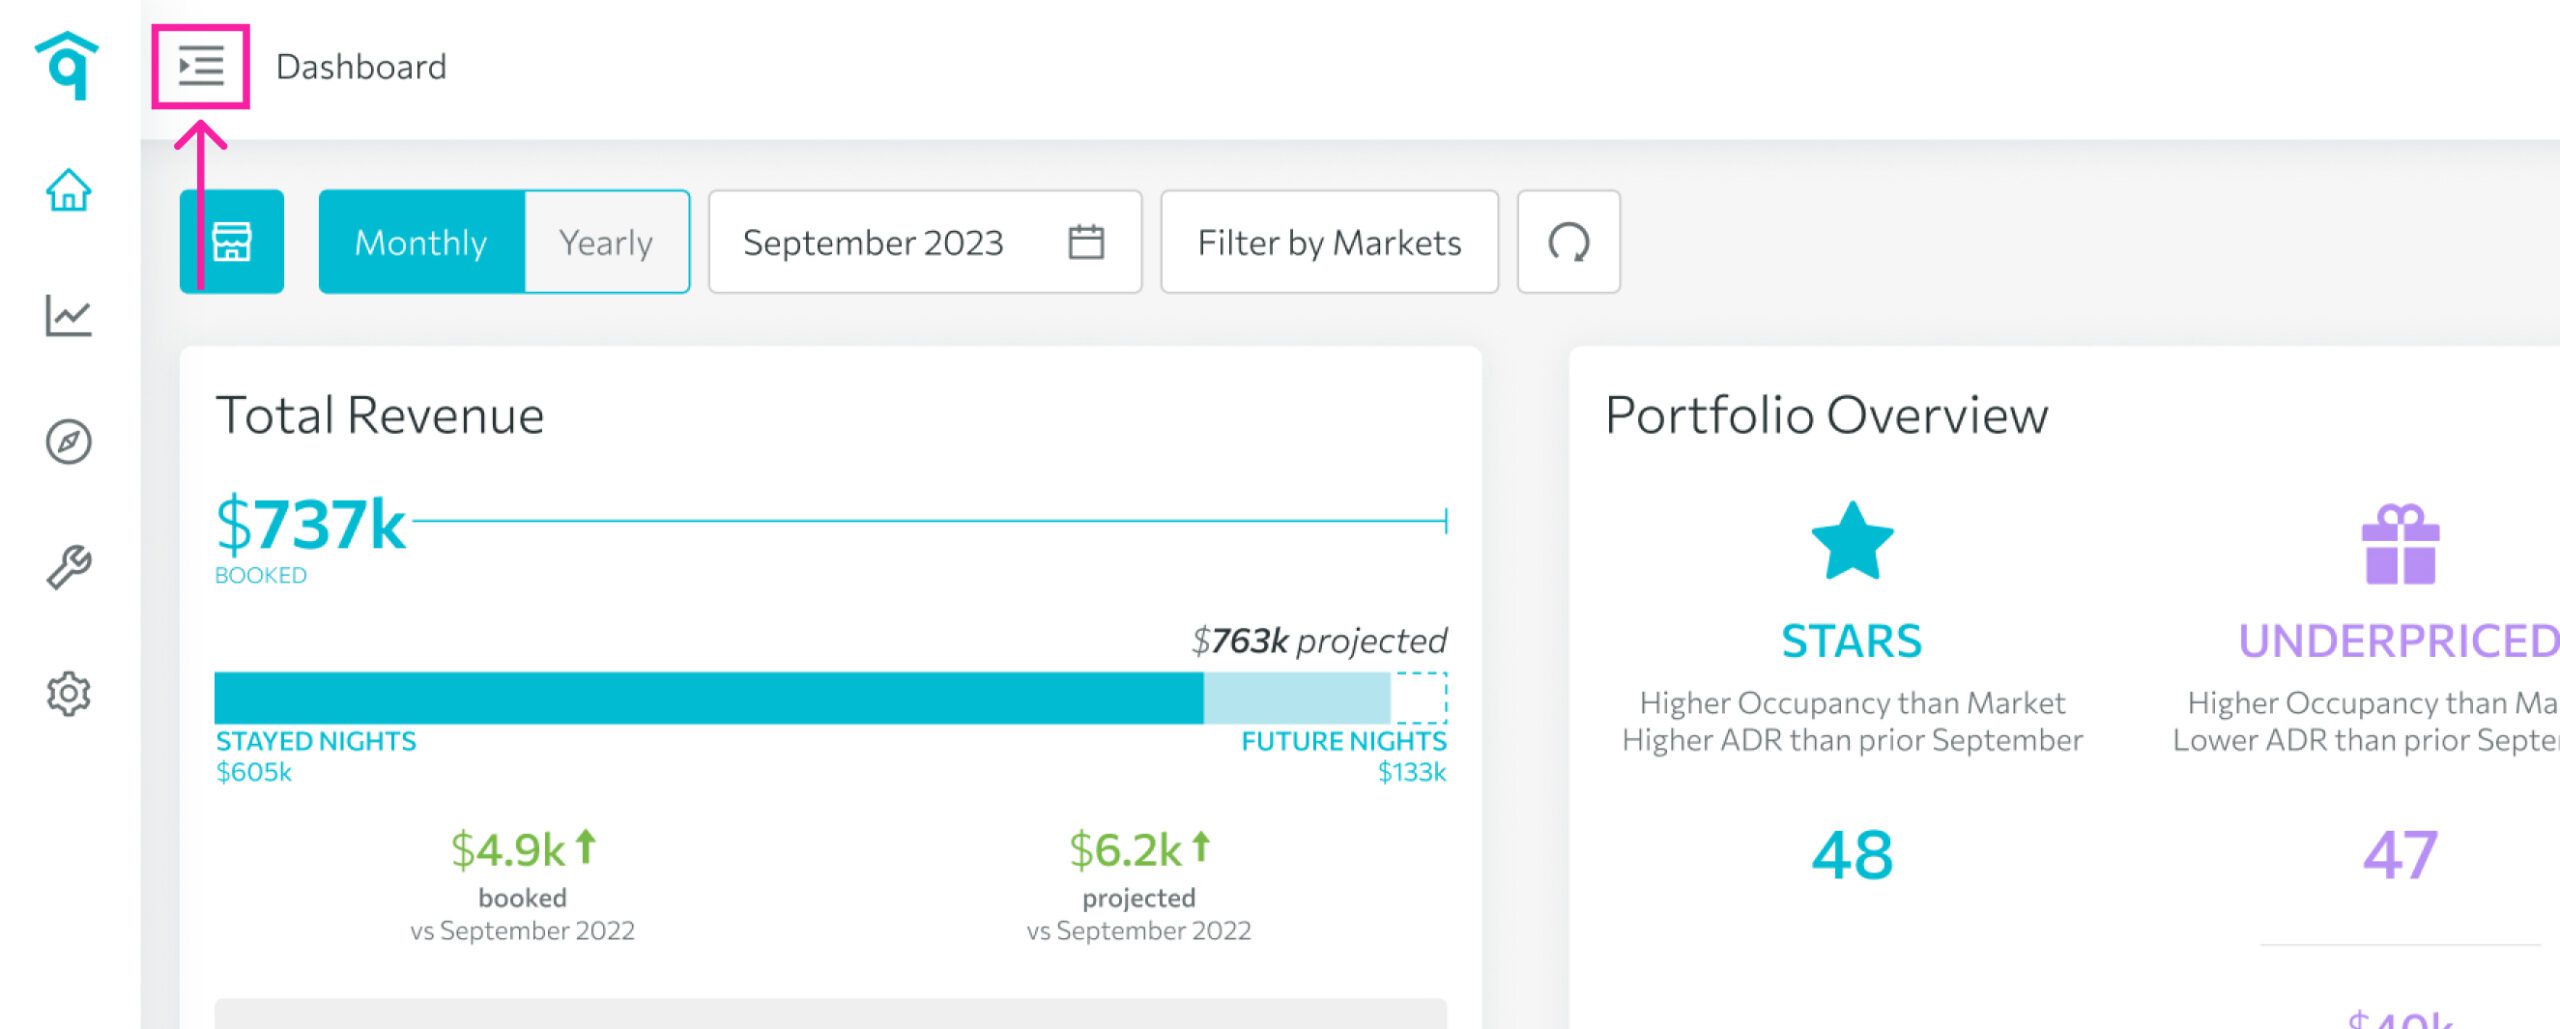
1. Head to the left-side menu bar.
2. Click on the “Analytics” dropdown.
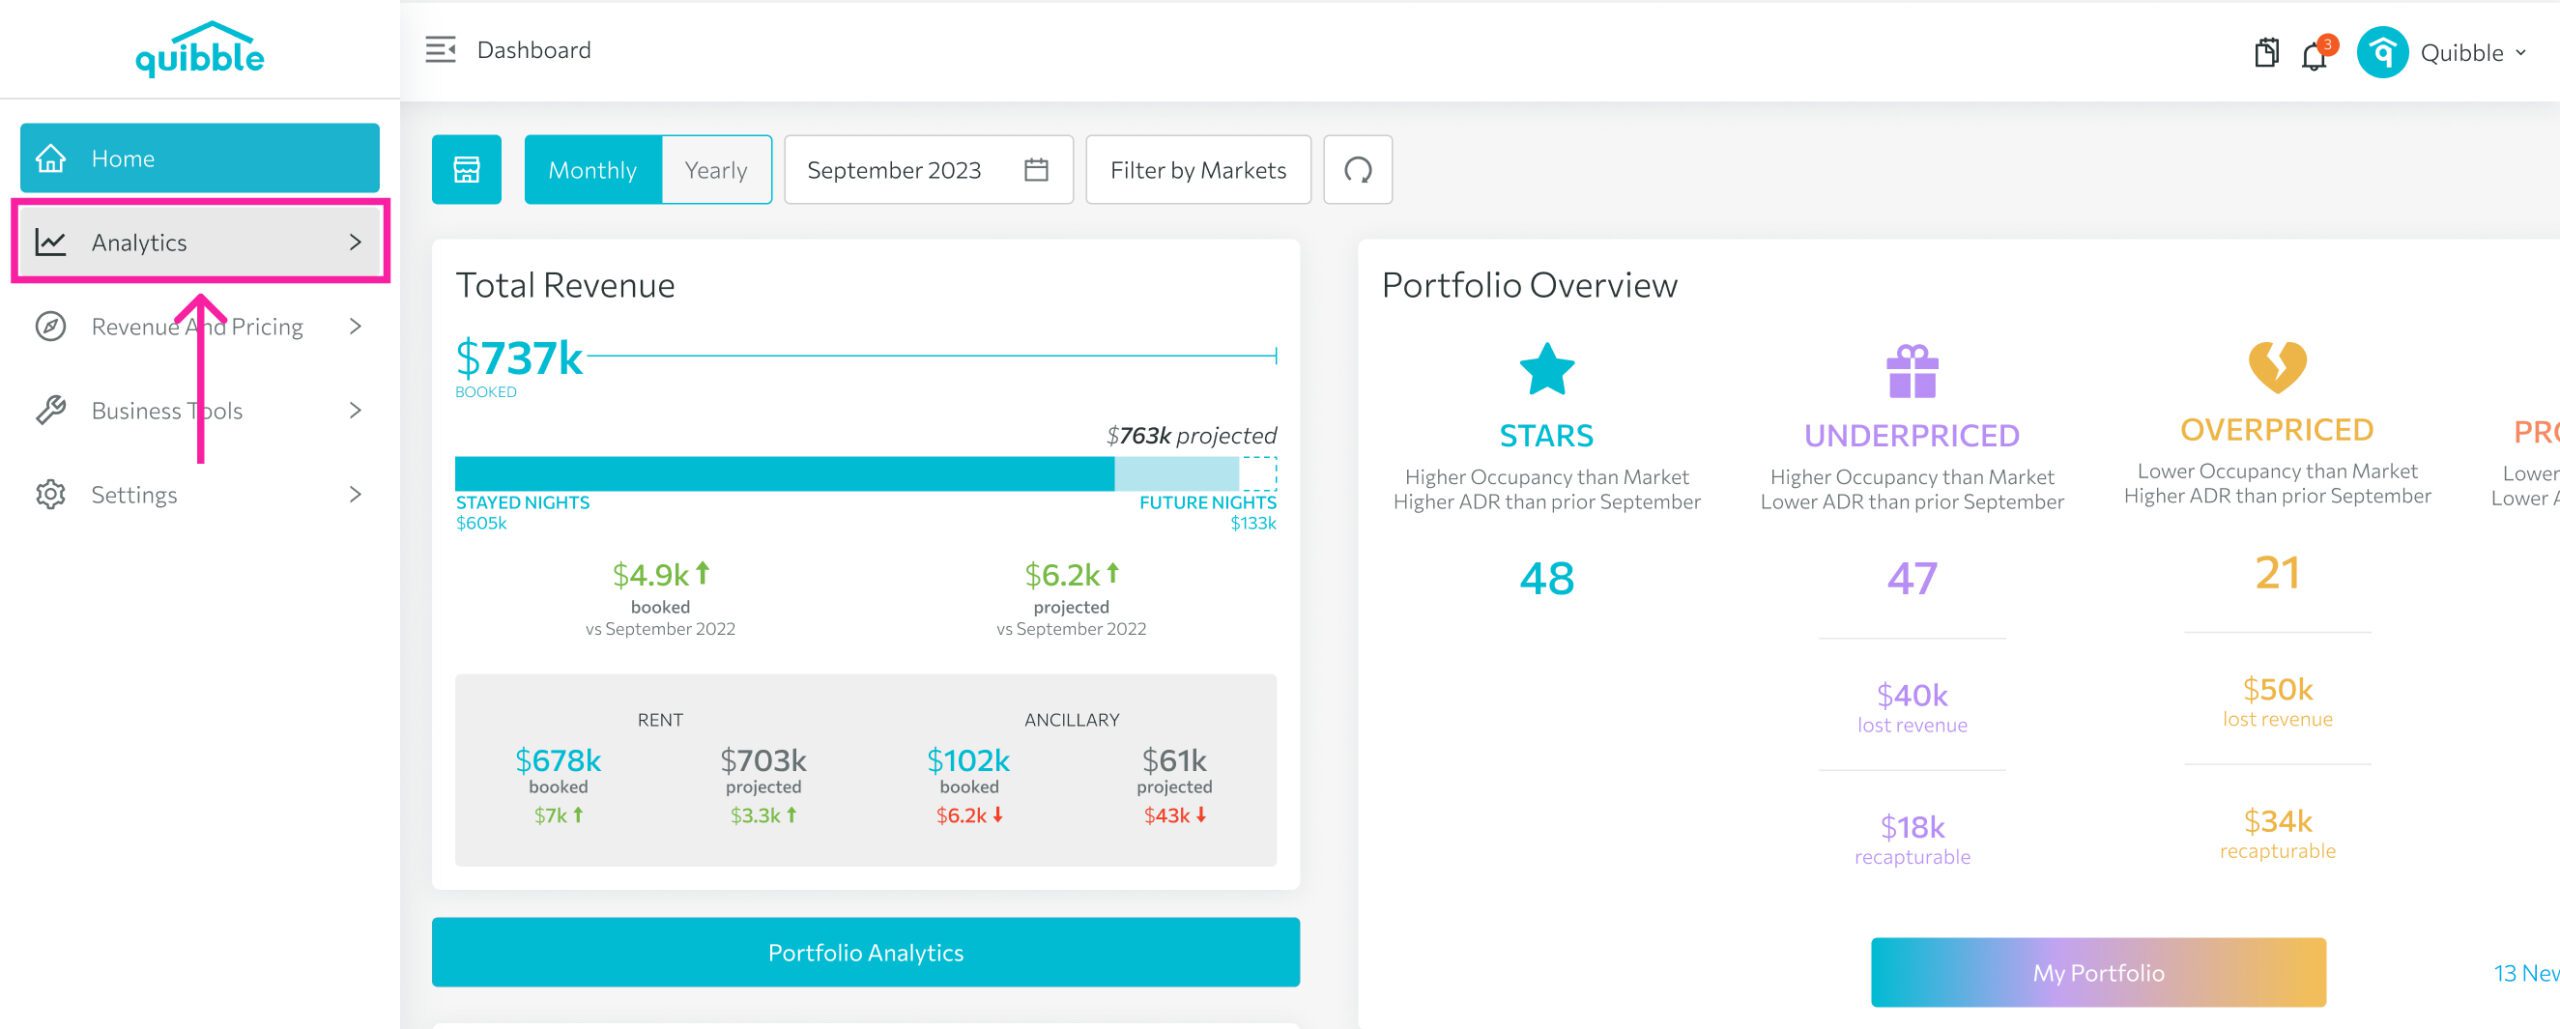
3. Select “Market.”
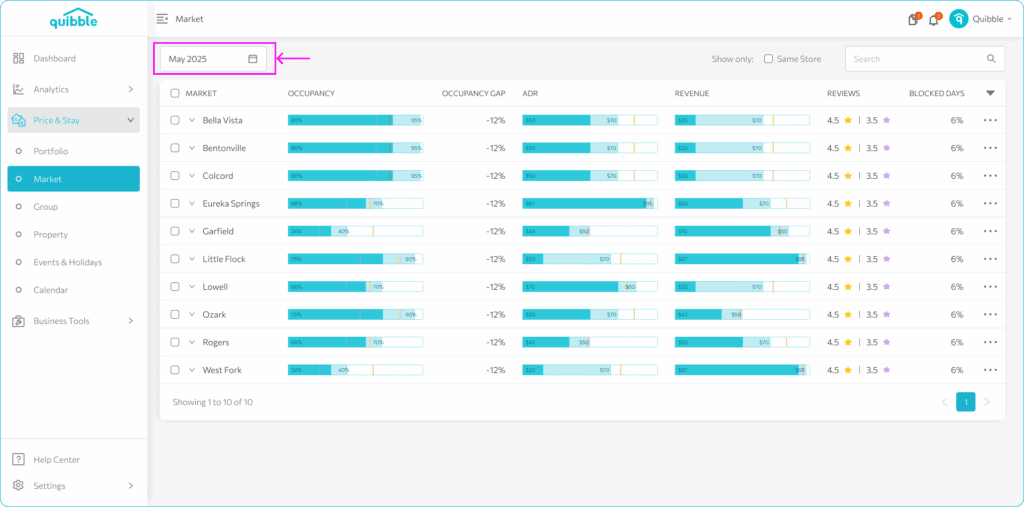
Let’s start by getting familiar with the available Buttons and Settings:
Date selector for the Market’s page defaults to the monthly aggregation. Upon entering the Market’s view from the price adjustment page, you can view the data by calendar date.
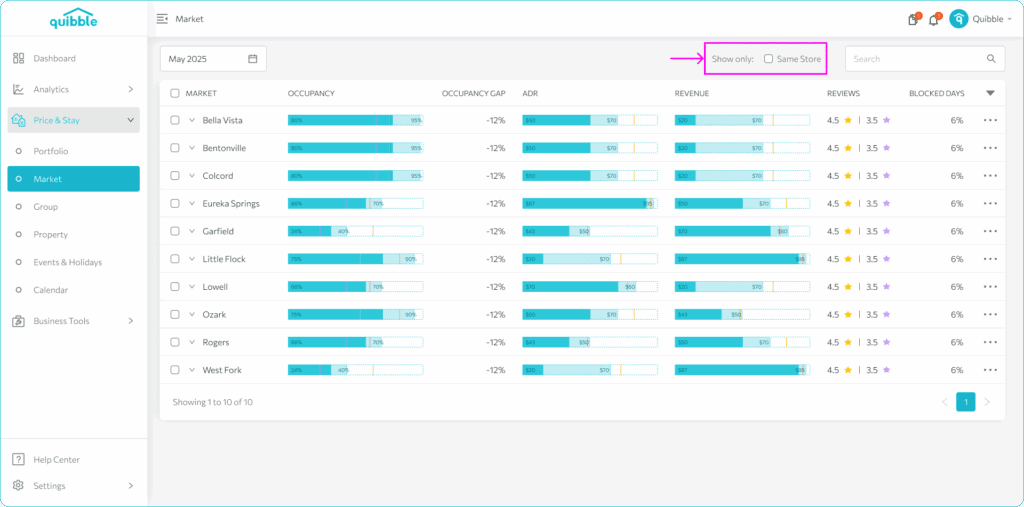
Show Same Store is designed to reduce the impact of inventory change on the comparative metrics. This filters to only the properties that existed last year AND still exist this year. New and less mature properties will be excluded when this filter is selected.
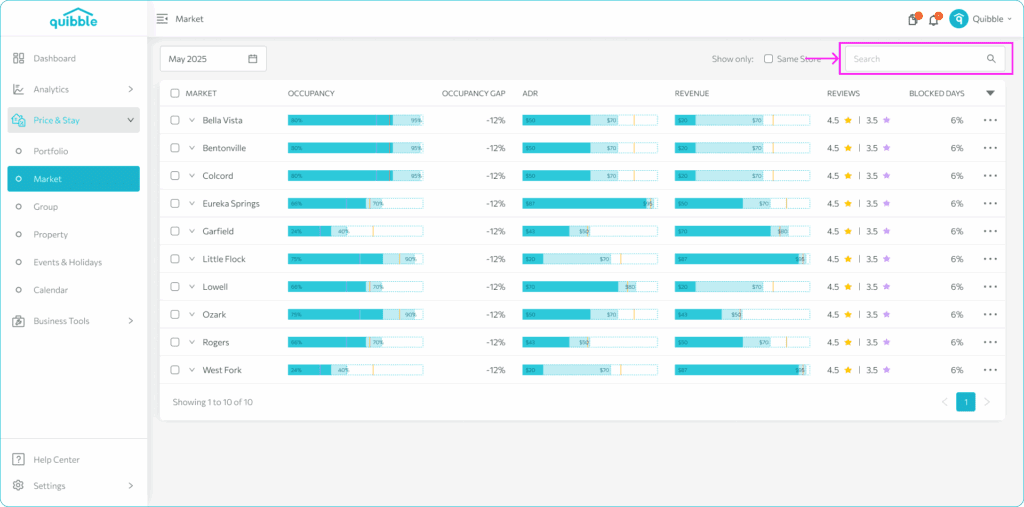
Search Bar can be used to look-up for a specific market from your portfolio
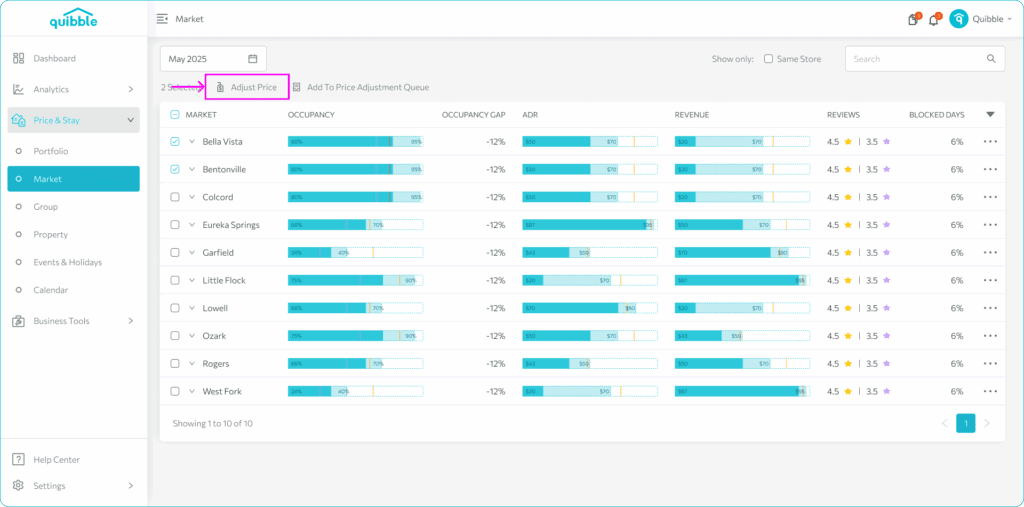
Adjust Price – it is possible to adjust the price at the market level. After selecting the markets you wish to adjust, clicking this button will take you to the price adjustments page of the selected Market.
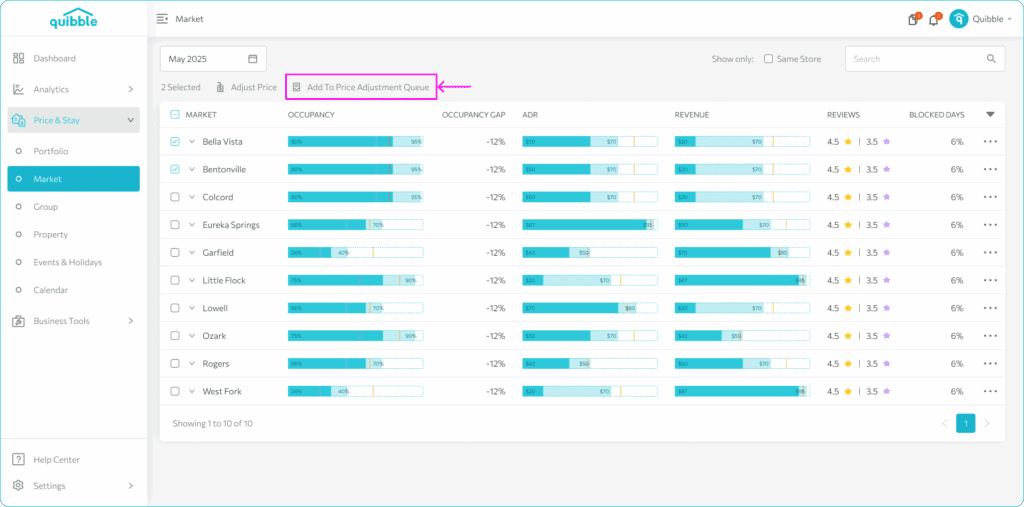
Add to Price Adjustment queue button is designed to streamline the process of evaluating and adjusting the price. This button allows you to add the markets to the queue to be worked.
Join our newsletter
Dominate the short-term rental market with cutting-edge trends


Join our newsletter
Dominate the short-term rental market with cutting-edge trends