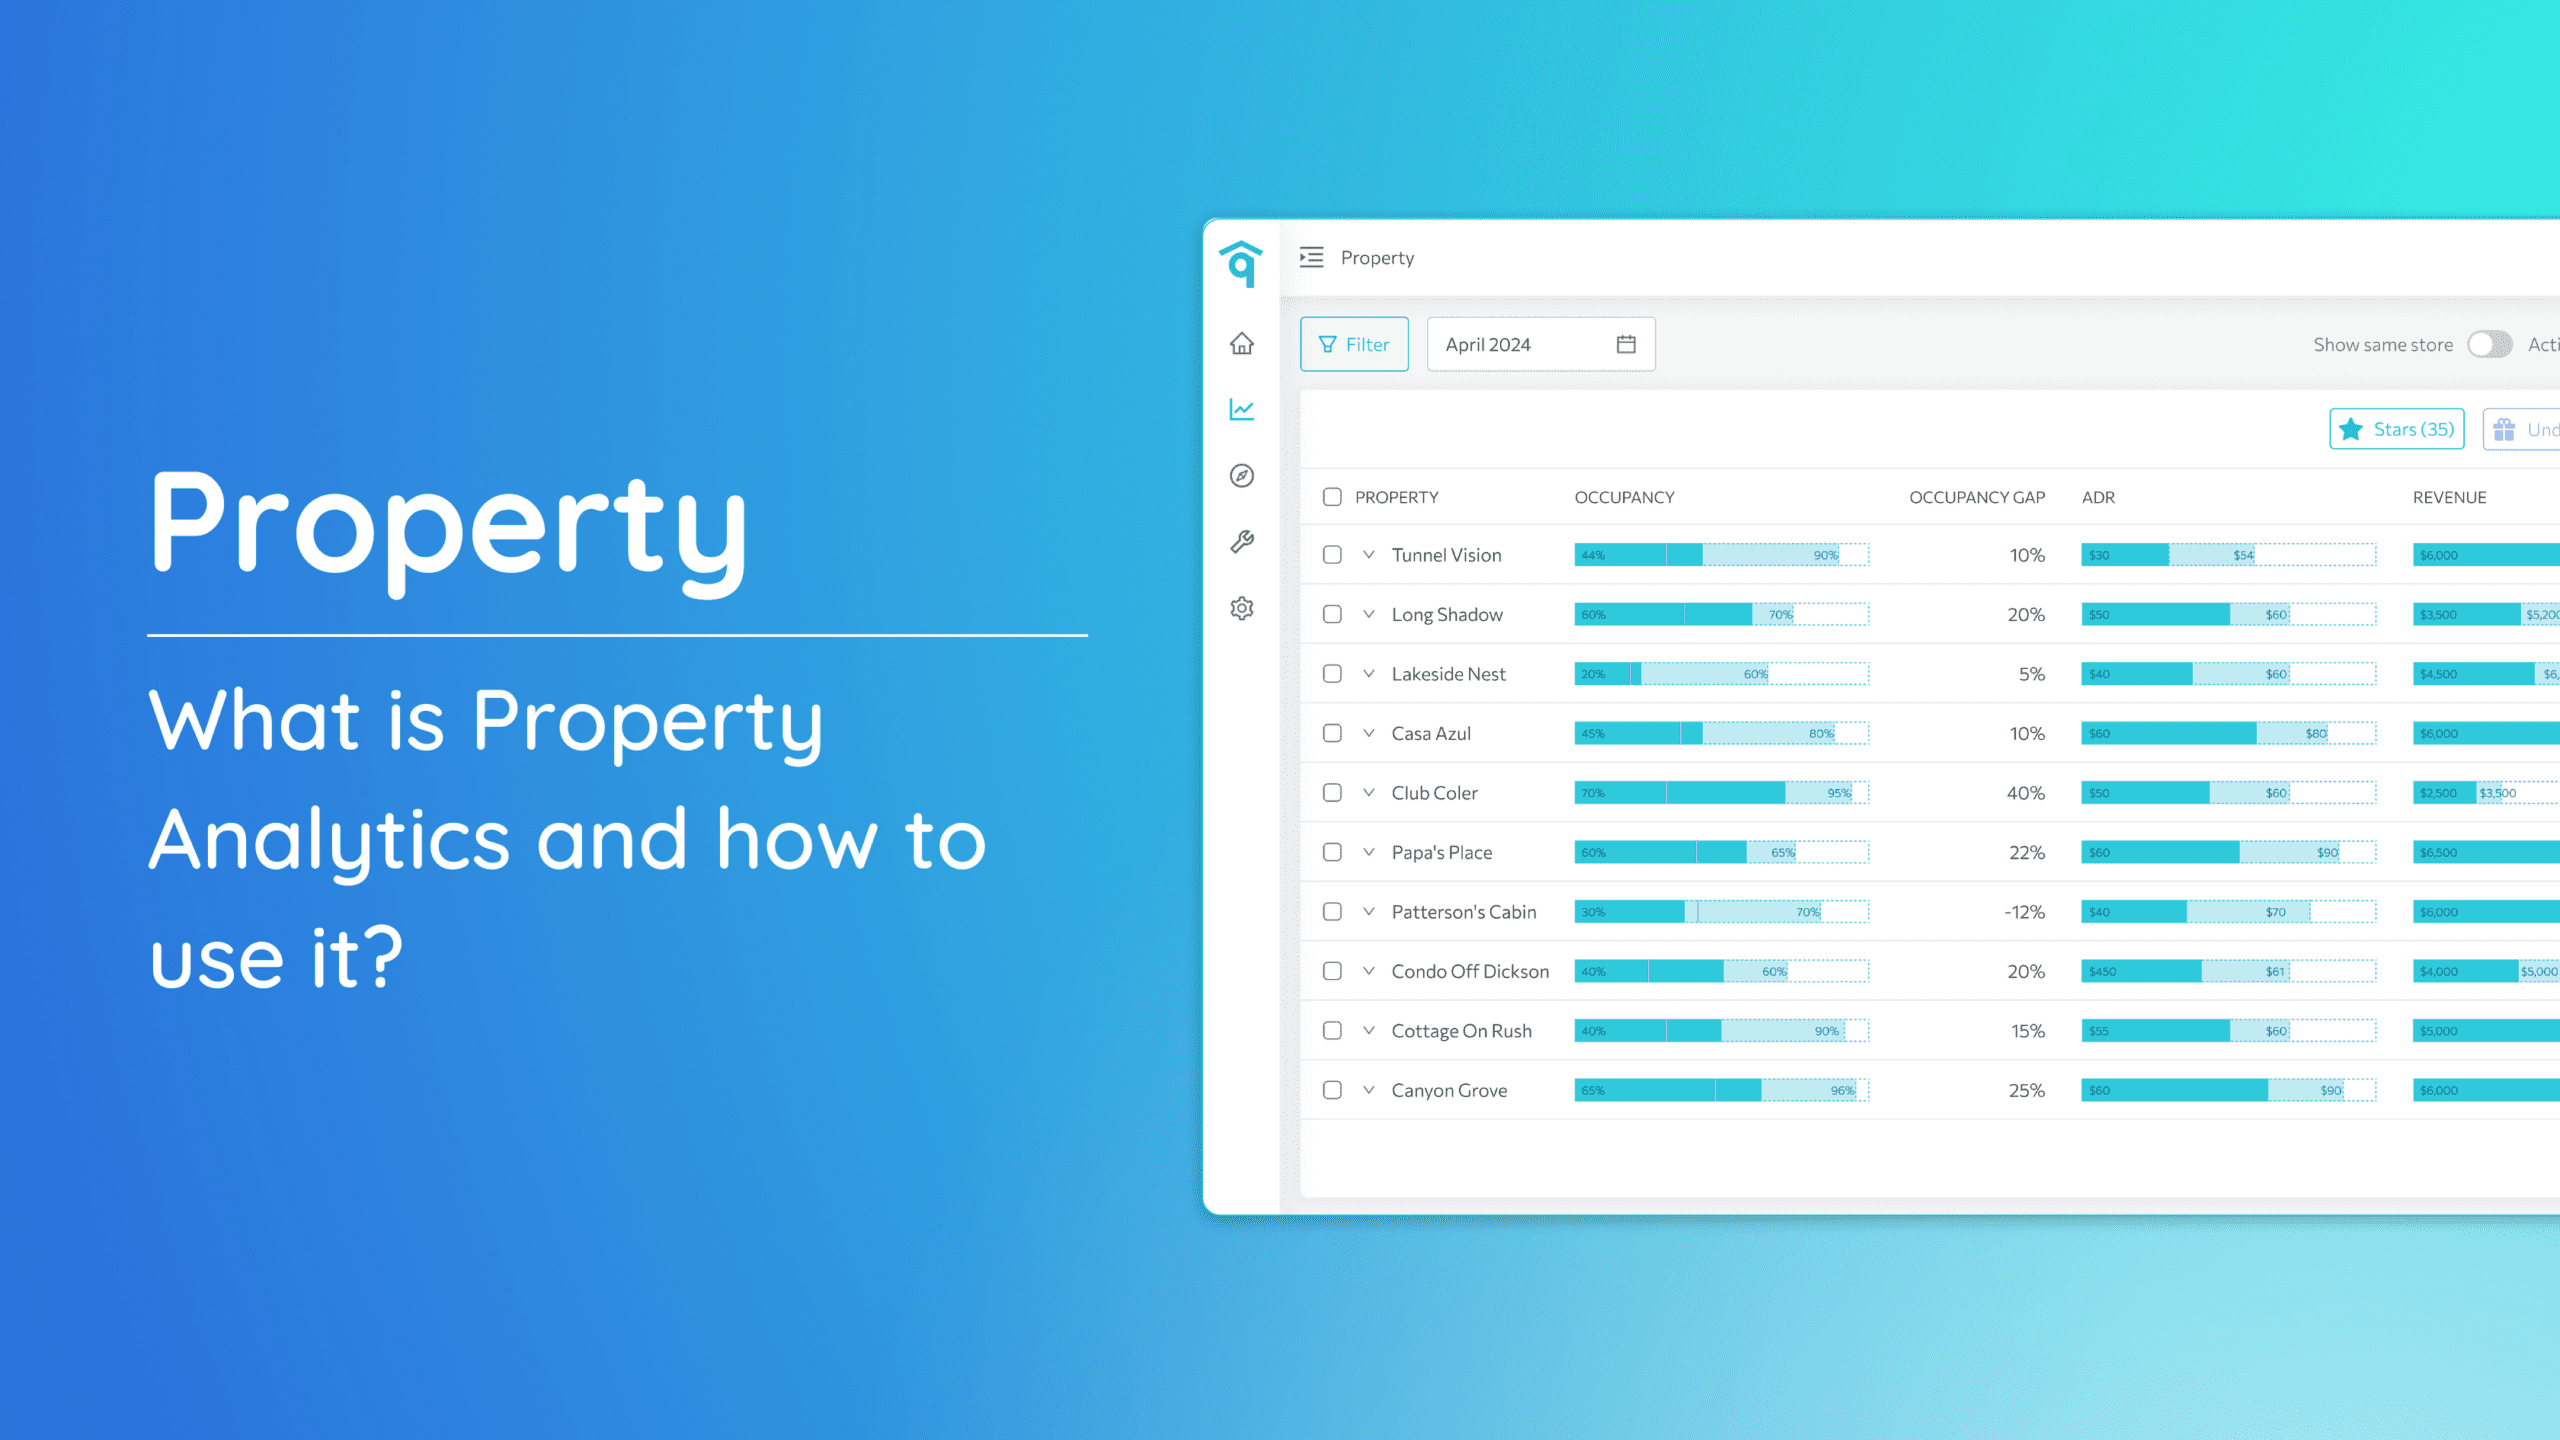
What is Portfolio Analytics and how to use it?
Portfolio Analytics is a tool designed to provide you with in-depth insights into the overall performance of your properties. Let’s familiarize the buttons and settings available on the page to filter how you would like to view your data.
Accessing Portfolio Analytics:
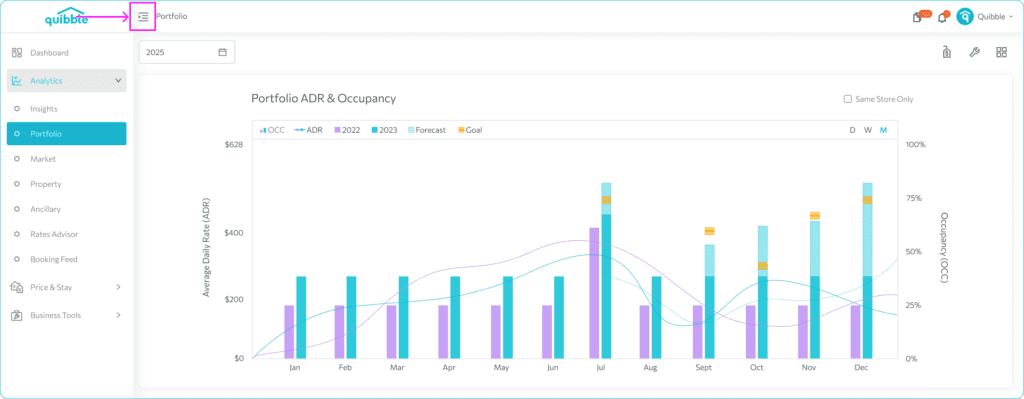
- To access the Portfolio Analytics page, from the dashboard navigate to the left-side menu bar.
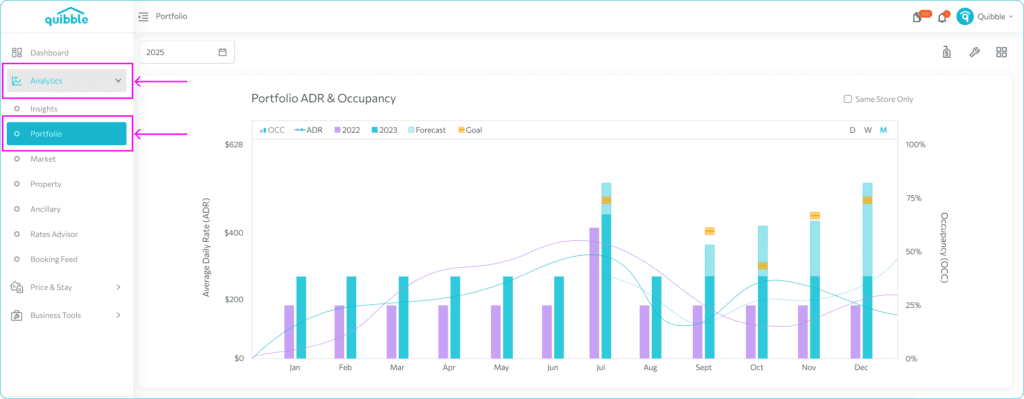
2. Click on the “Analytics” dropdown and select Portfolio.
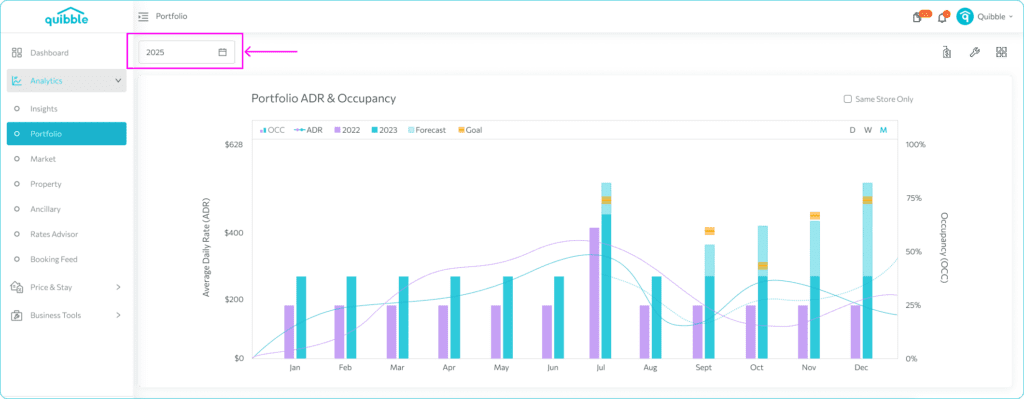
3. By default, the application will be set to the current year. The view will always display the selected year as the primary display and the comparison data in the charts is from the selected year minus one.
4. The Layout button tailors your analysis by filtering these metrics by one or two columns to streamline your focus and achieve a more refined view. This is particularly useful when you’re using a monitor or a large screen.
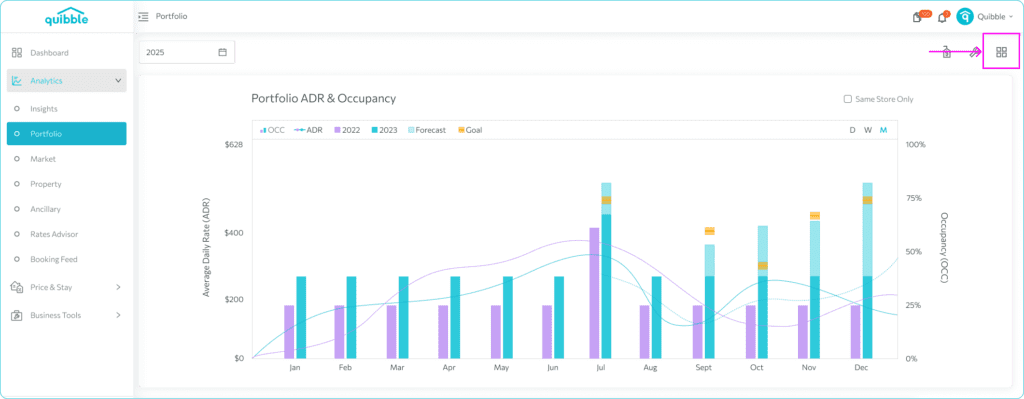
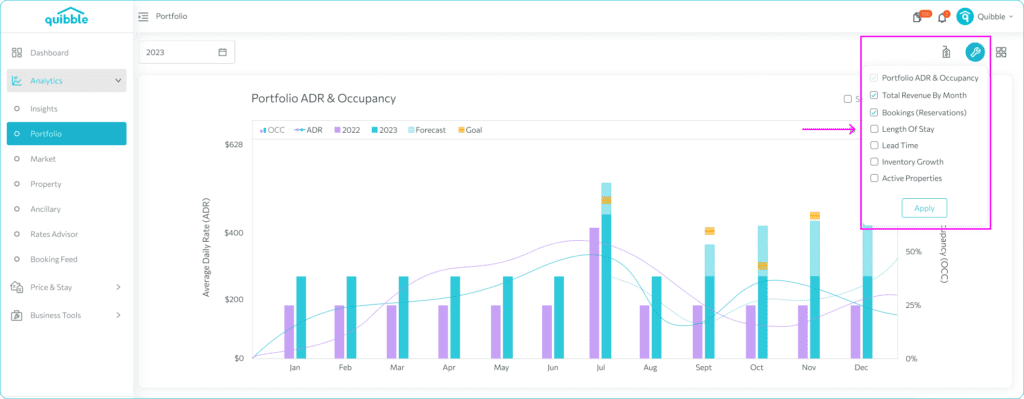
5. You also have the option to choose the data that will be displayed on the Portfolio Page under the Configure Charts button.
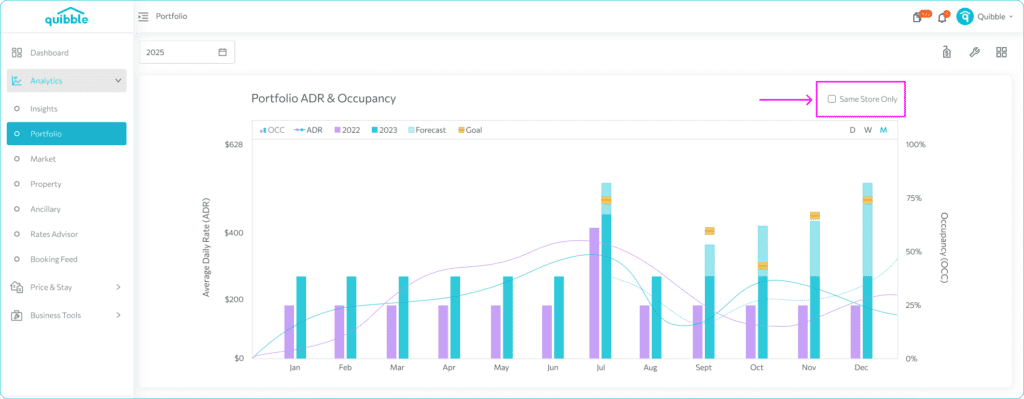
6. The Show Same Store Only toggle refines your view further allowing you to concentrate specifically on the properties that were in your portfolio last year and are in the portfolio this year. This gives a year over year view that is less affected by inventory change.
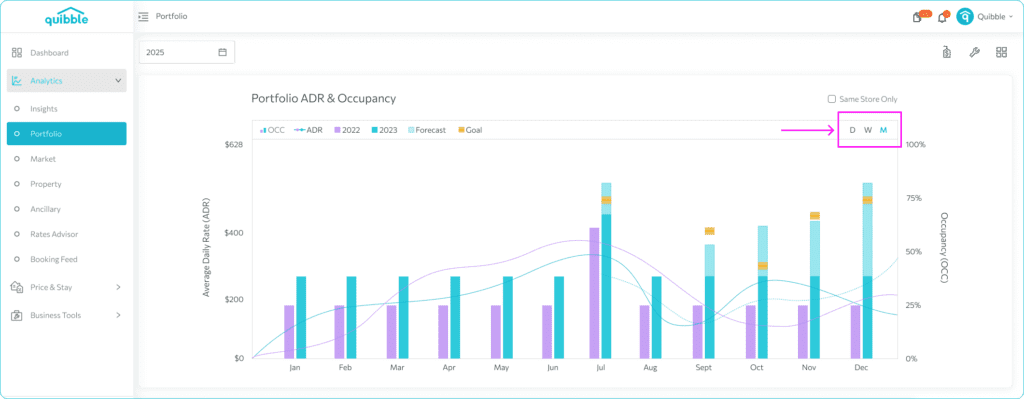
7. Customize your analysis by filtering each metric based on your preference—whether you prefer daily, weekly, or monthly insights. This defaults to showing all the KPI metrics aggregated to the month level.
Explore the Portfolio Analytics section with these tools at your disposal, and gain a comprehensive understanding of your portfolio’s performance.