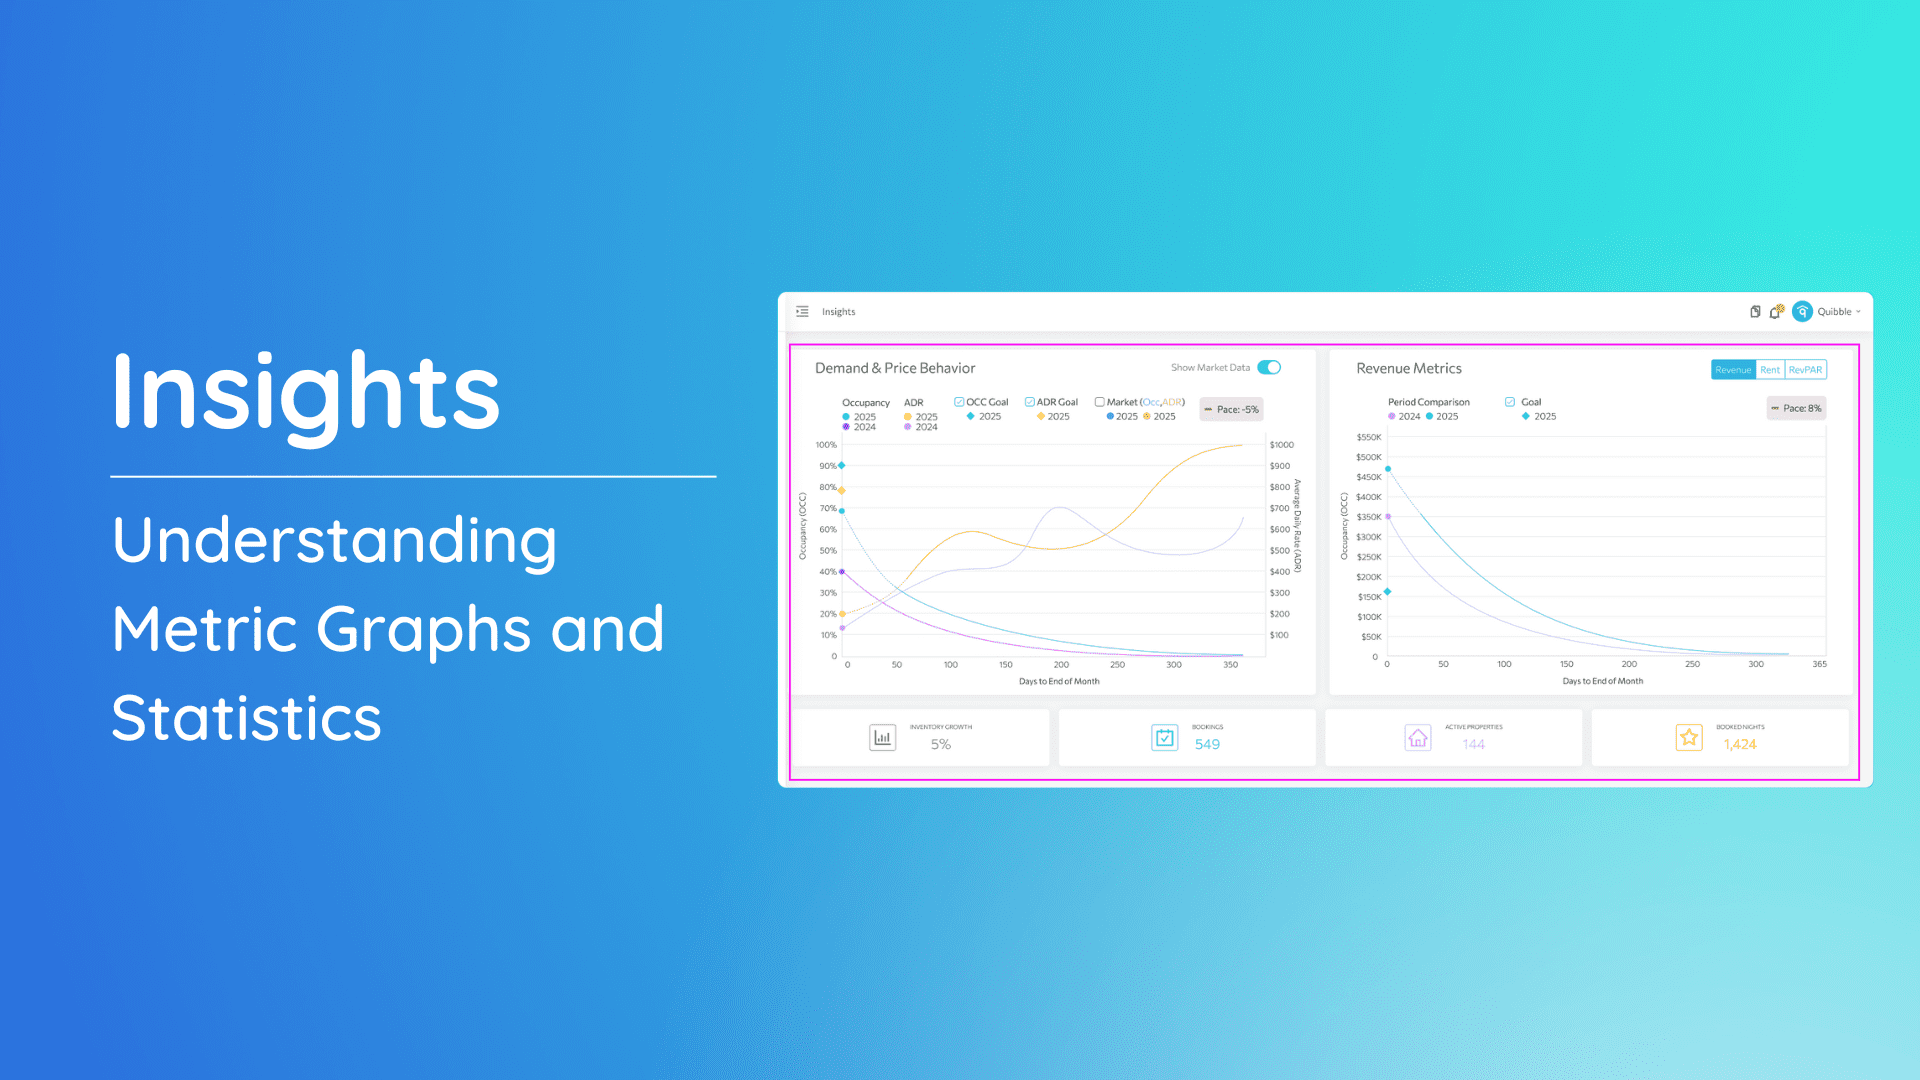
The Price Graph View is a powerful tool that helps you visualize your property’s monthly pricing trends and make data-driven decisions. By understanding your market’s dynamics and your property’s performance, you can optimize your pricing strategy to maximize revenue.
Accessing Price Graph View
1. Navigate to the left-side menu bar.
2. Click on the “Analytics” dropdown.
3. Select “Property.”
4. Choose the property you want to view the price graph for, then click the “Pricing” menu.
5. You’ll then be able to see the price graph view and use it to set your prices.
How to use the Price Graph View
1. Select the desired month.
2. Hover your mouse over the graph to view the following data:
- Current rate
- Last year’s rate
- ADR (Average Daily Rate)
- Optimized rate
- Competitor’s rate: Represented by the purple (highest competitor’s rate) and pink (lowest competitor’s rate) lines.
3. Set nightly rates: Select the date(s) you want to apply the changes. You can select dates on the right-side menu bar or directly from the graph’s horizontal axis.
4. Adjust price rates: Use the “Multiplier” to adjust rates by a percentage. Applied multipliers will be reflected in the blue-green horizontal bar below the graph.
5. Set minimum and maximum prices: Use the fields on the right-side menu bar to set the minimum and maximum nightly rates, as well as the “far out” price.
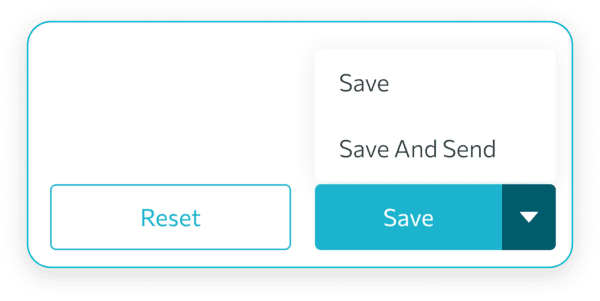
6. Save changes: Click “Save” to apply changes before the end of the day or “Save and Send” for real-time application.
For more details on price adjustments and best practices, refer to our dedicated article here.
By effectively utilizing the Price Graph View, you can make data-driven decisions to optimize your pricing and maximize your property’s revenue.
We hope this guide has been helpful in configuring your portfolio charts. Don’t forget to check out our other articles and resources for additional tips and best practices.


