The Insights page allows you to monitor your portfolio’s progress, identify optimization opportunities, and fine-tune your strategy for maximizing revenue and occupancy.
This document provides a detailed overview of how to navigate and analyze property revenue metrics. From understanding total rent income and additional revenue streams to assessing occupancy rates and rent comparisons, these steps will guide you through effectively interpreting the data.
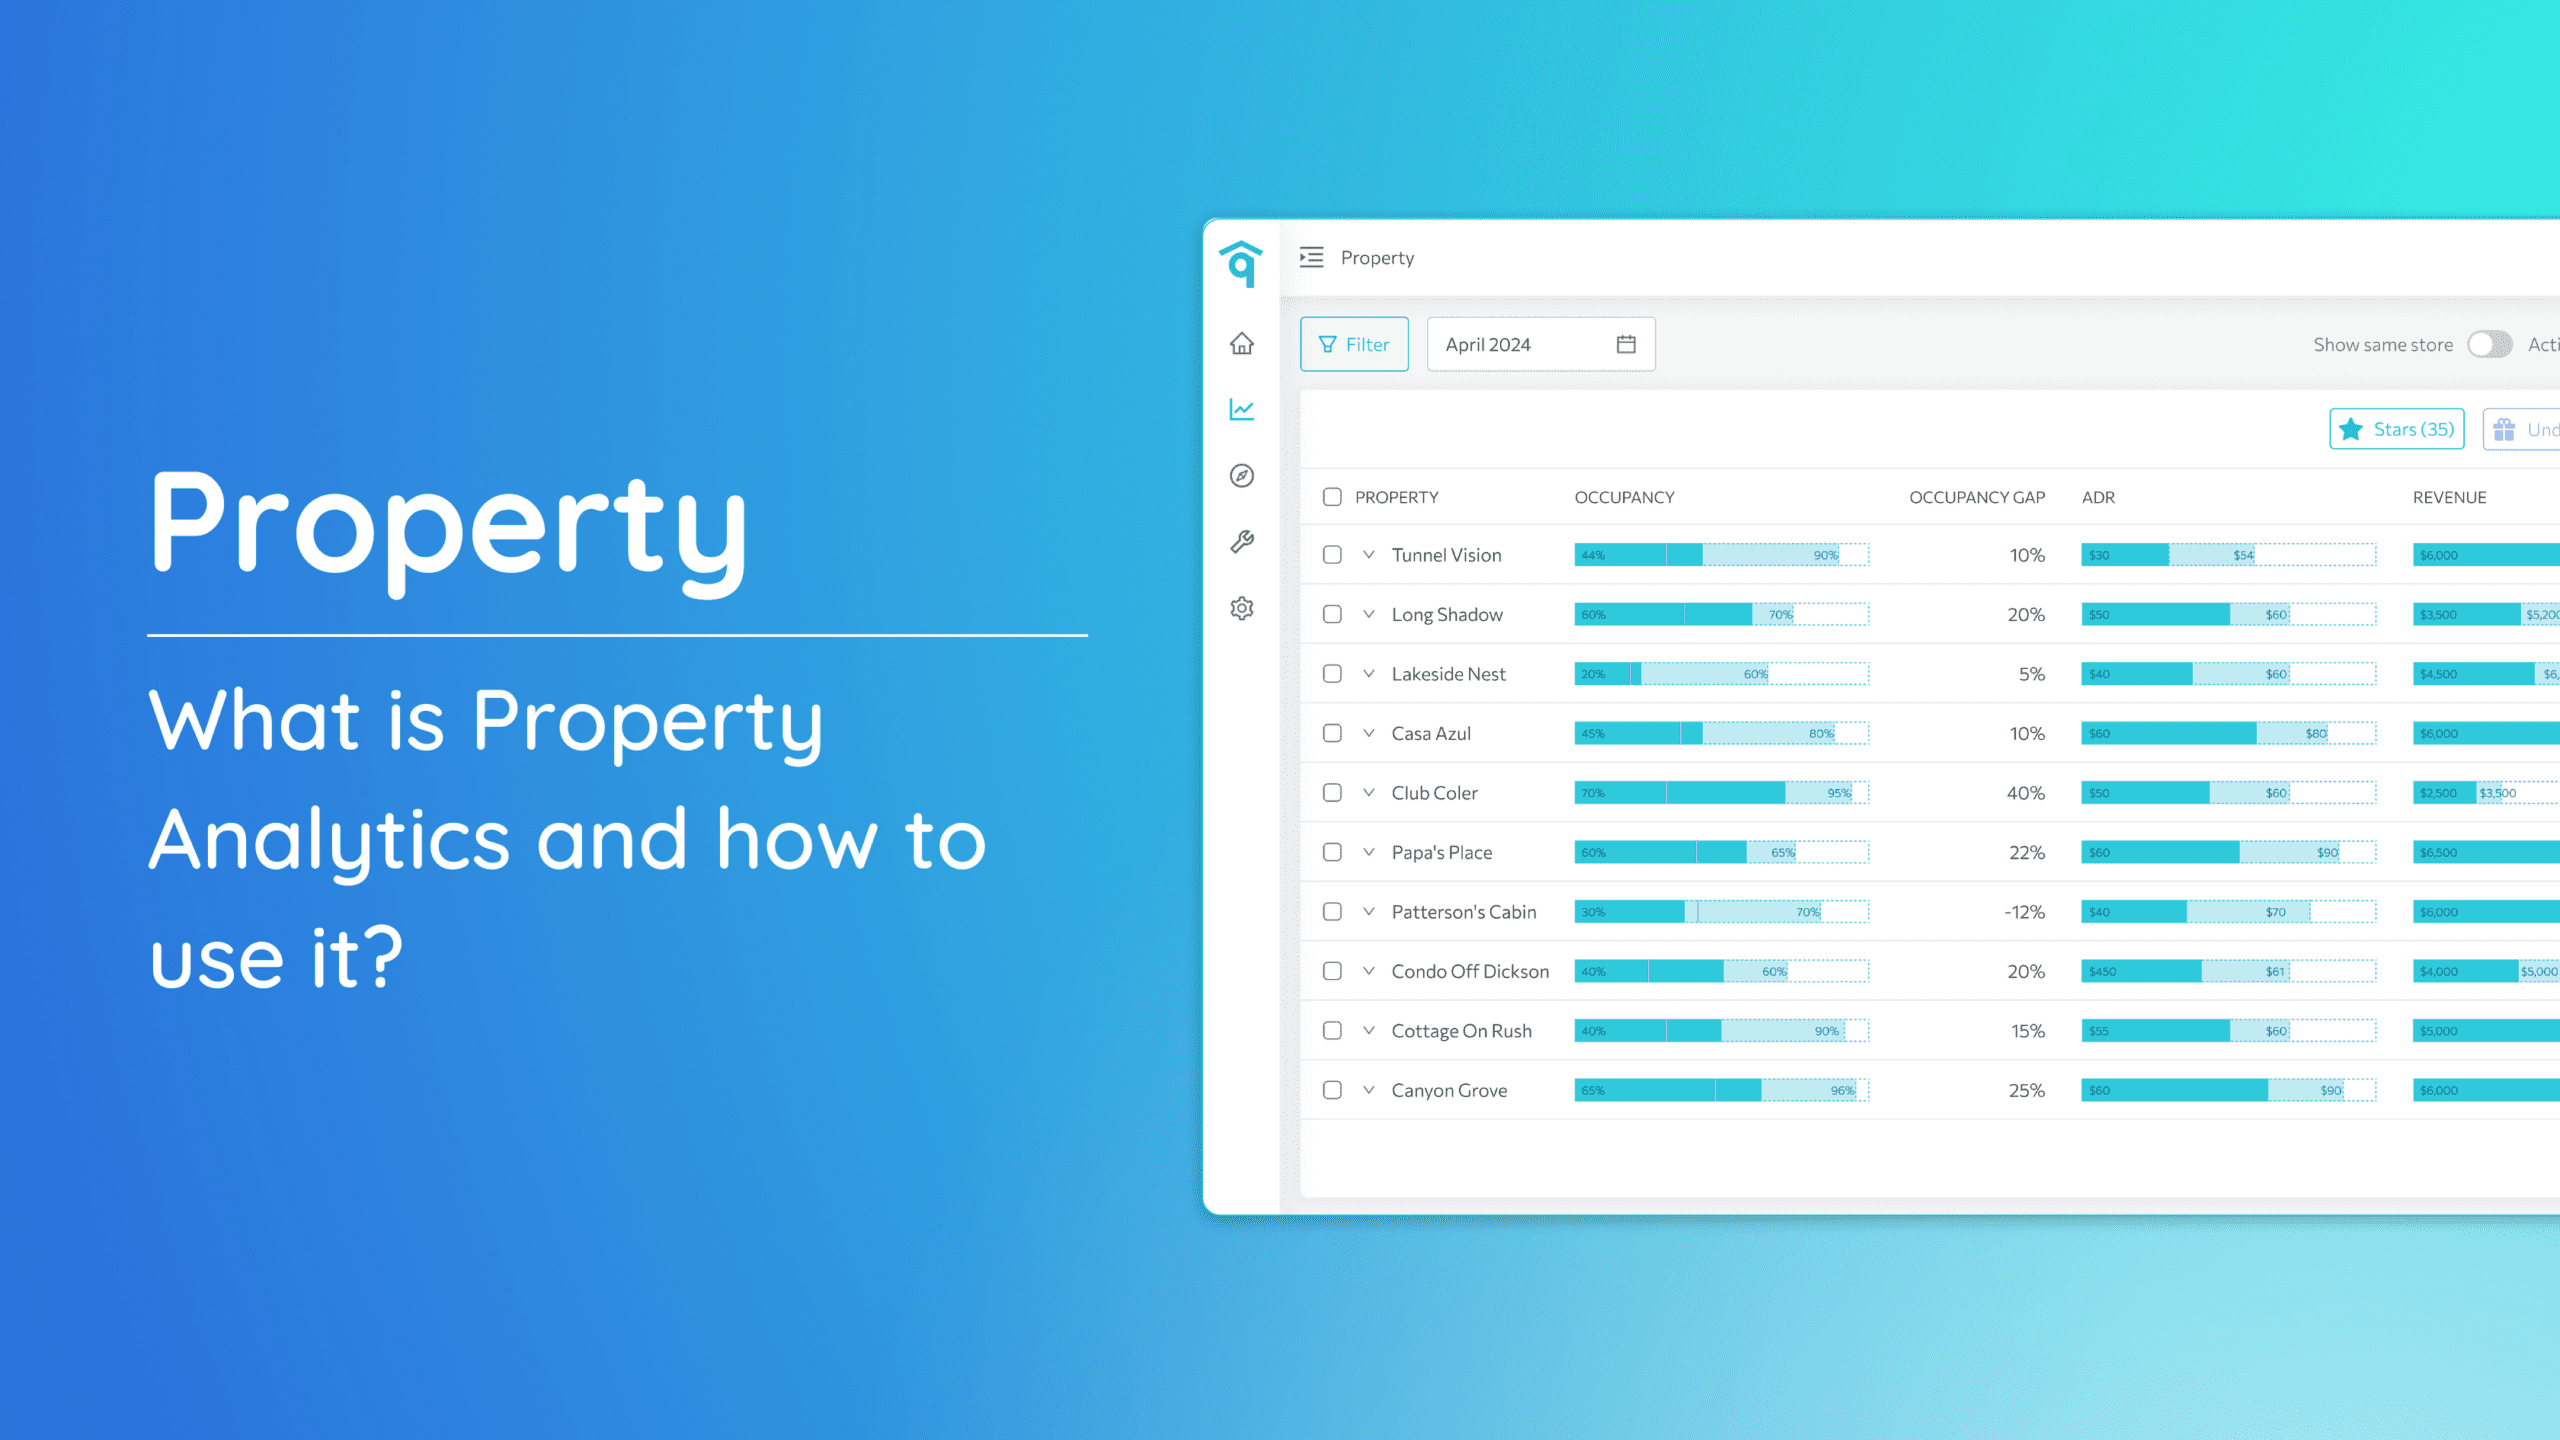
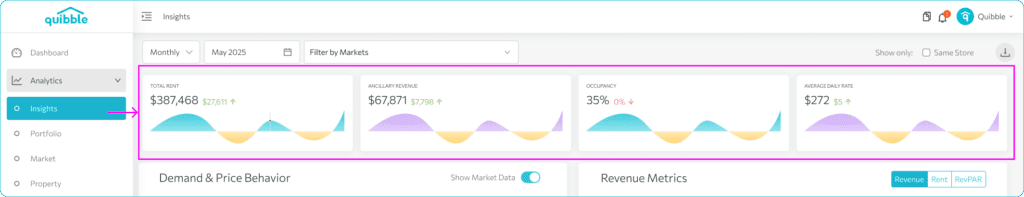
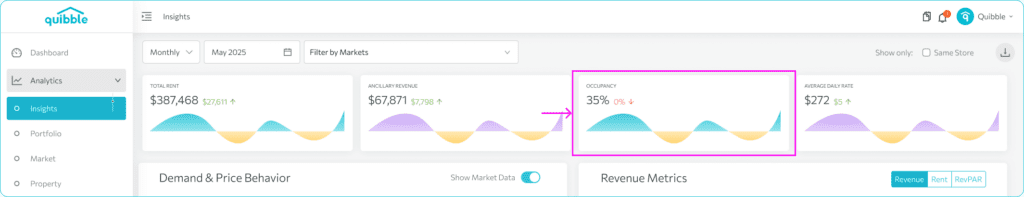
1. Familiarize the first layer cards which shows the key revenue metrics.
The black figures represent current values. The red or green numbers next to them are comparison values, showing the variance from the same period last year—indicating whether there has been an increase or decrease.
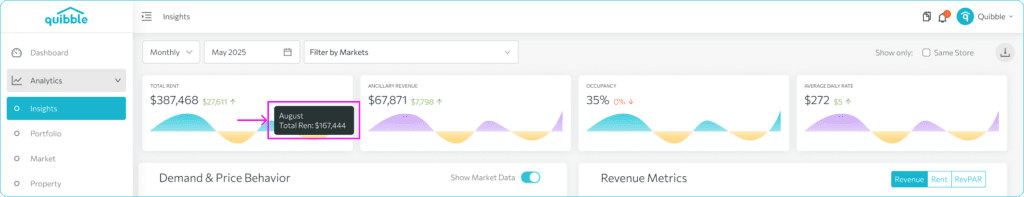
2. Hovering over the cards also shows the exact figures for each month.
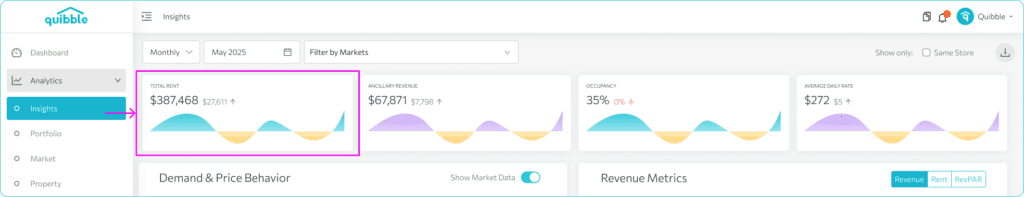
3. The first card shows Total Rent which represents the overall rent income earned during the selected period. It reflects the management company’s ongoing financial performance for that specific timeframe.
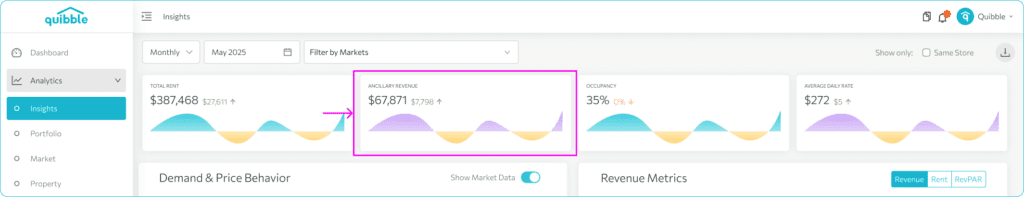
4. Next card is the Ancillary Revenue which displays additional income sources beyond traditional rent, such as cleaning fees, service charges or upsell items.
5. Occupancy represents the proportion of available rental units that are booked. This metric is crucial for evaluating property demand and usage efficiency.
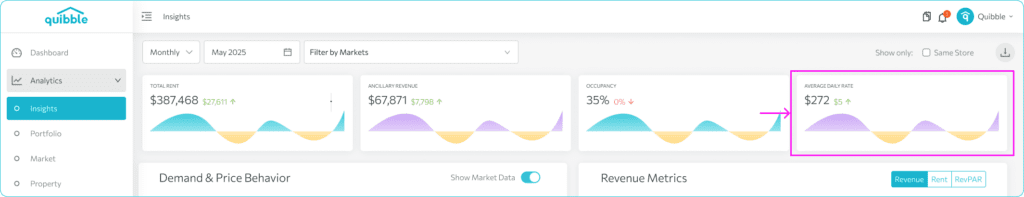
6. The Average Daily Rent (ADR) is the average price for what you’ve booked for the month. This is crucial for assessing your leasing strategies and revenue potential.
If you have further questions or need additional assistance, our support team is here to help. We hope this has helped you better understand how your property’s revenue metrics are presented to conveniently interpret your data.
Don’t forget to explore our other help articles and resources for more insights into managing your pricing strategy.