Let’s head over and explore the table view. This lists all the markets available in your portfolio.
The markets is the second level of data aggregation for price adjustment and evaluation. Portfolio level adjustments should be small and used as corrections to macroeconomic changes, while the market level adjustments are more refined and should reflect trends occurring at a more specific level.
What is the Occupancy Gap?
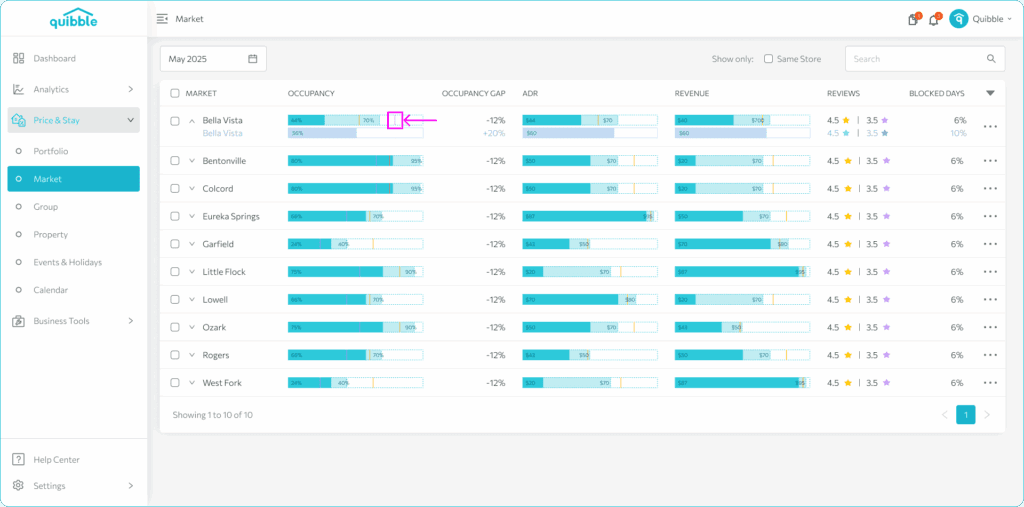
The Occupancy Gap is a measure that compares your occupancy rate to the market average. To check this, click the market dropdown to view the occupancy rate for the selected market. There are two gaps to take notice of:
The first gap is a comparison against last year. This indicates how full you are compared to the same point in time last year.
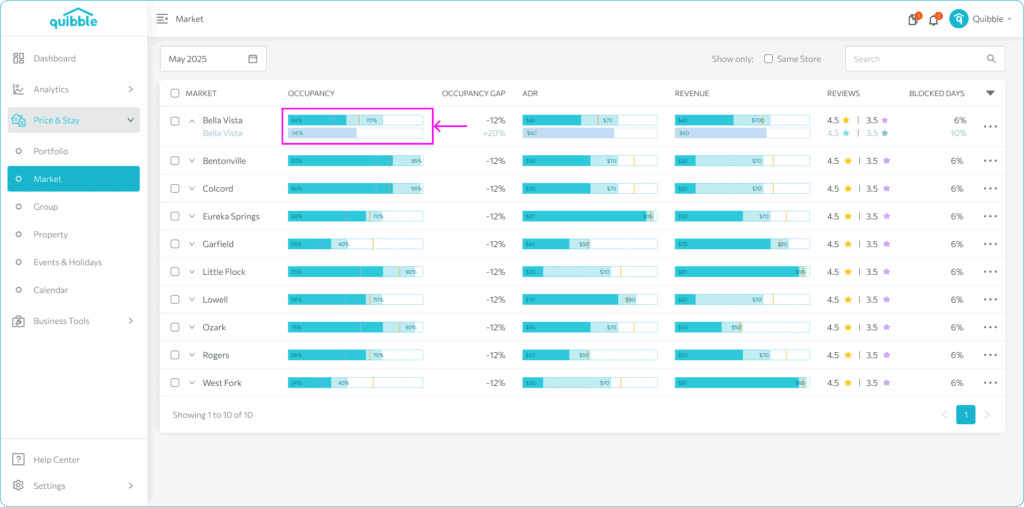
The second gap is the gap against the market – the purple line in the occupancy bar chart. This indicates how your list of properties in the city compare to the surrounding market.
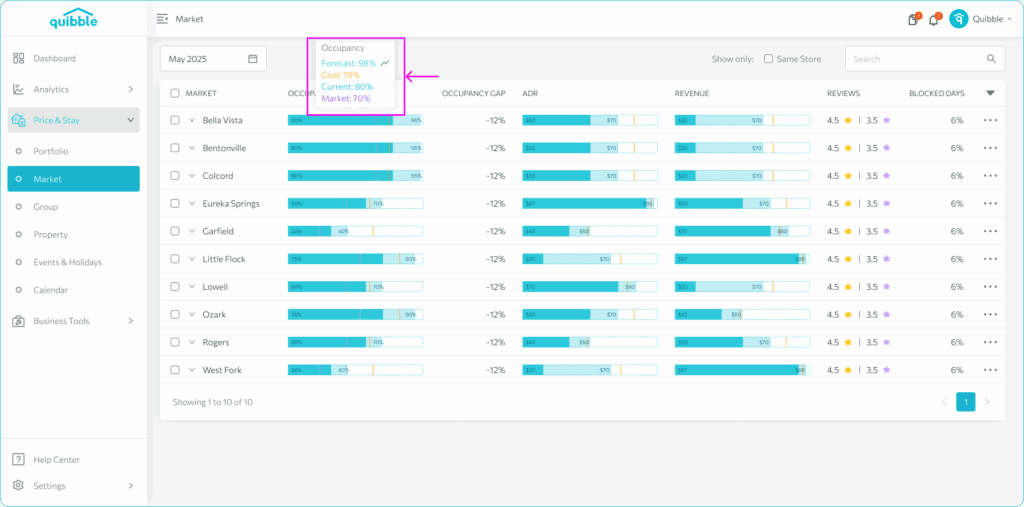
Hovering on the Occupancy graph also shows the exact values.
Checking Forecasted Occupancy, ADR, and Revenue:
On the Market page, hover over the graph to see both forecasted and current data. This provides a quick and easy way to assess whether the expected occupancy, ADR (Average Daily Rate), and revenue have been met.
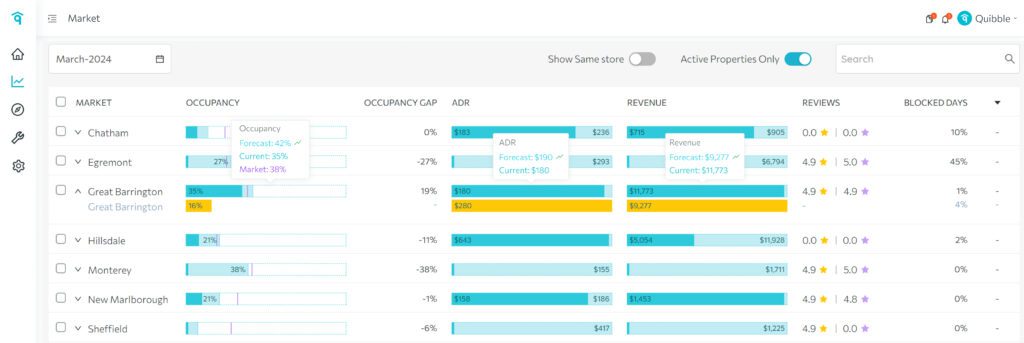
- Current – this is the current value for everything booked in the selected period.
- Forecast – the projected final position of this metric based on historical trends.
- Market – the current position of the surrounding market for the selected period.
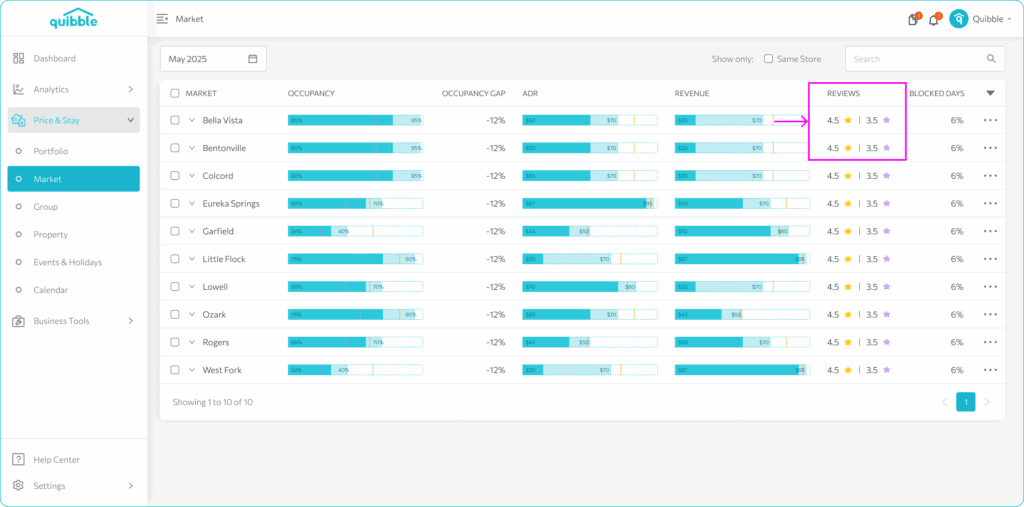
What are Reviews?
These are the review scores collected from the OTA channels. The first value is for the managed properties. The second value is for the surrounding market.
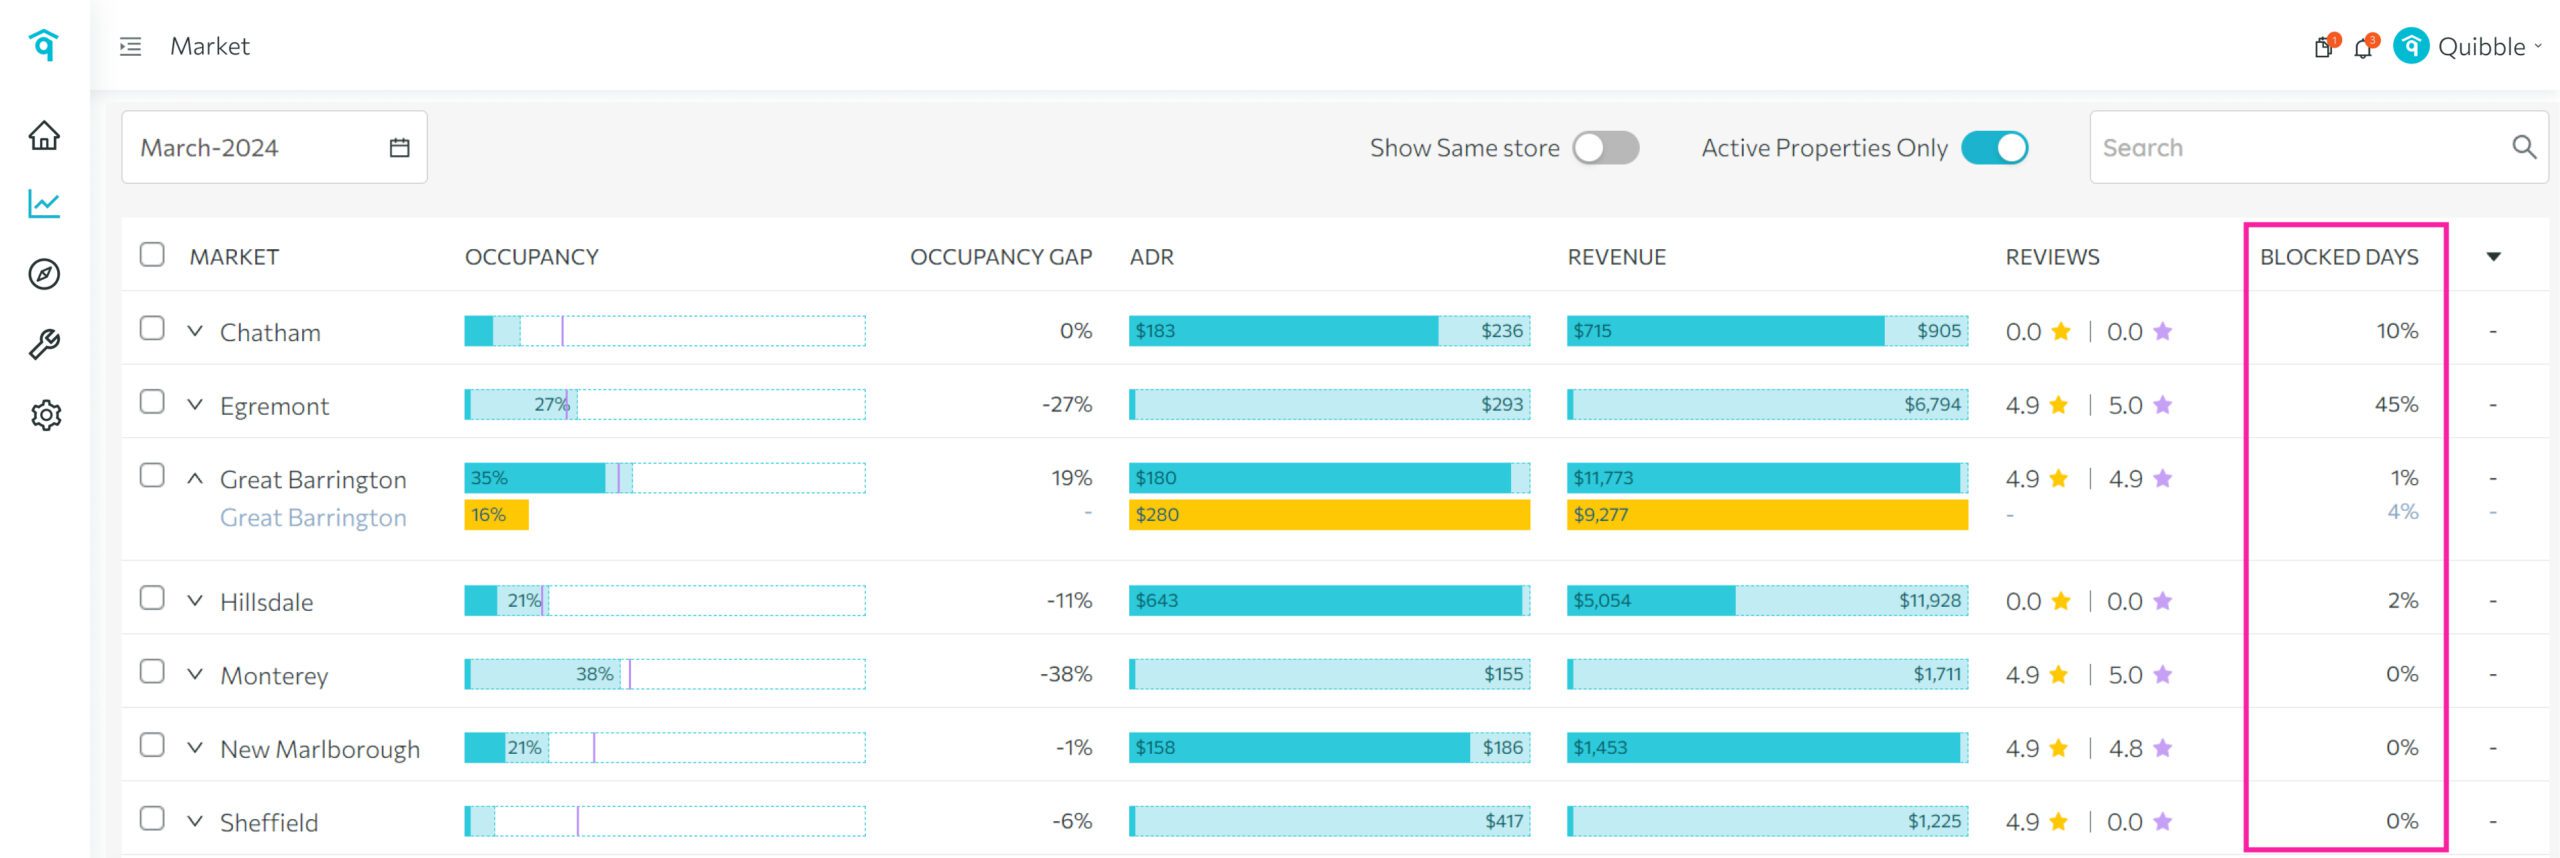
What are Blocked Days?
Blocked Days are specific days when the property is neither reserved nor available. Typically, owners block off these days for private use or maintenance purposes. It’s a way to manage the property’s availability and ensure it aligns with the owner’s personal or maintenance schedule.
These days are excluded from the Occupancy calculation
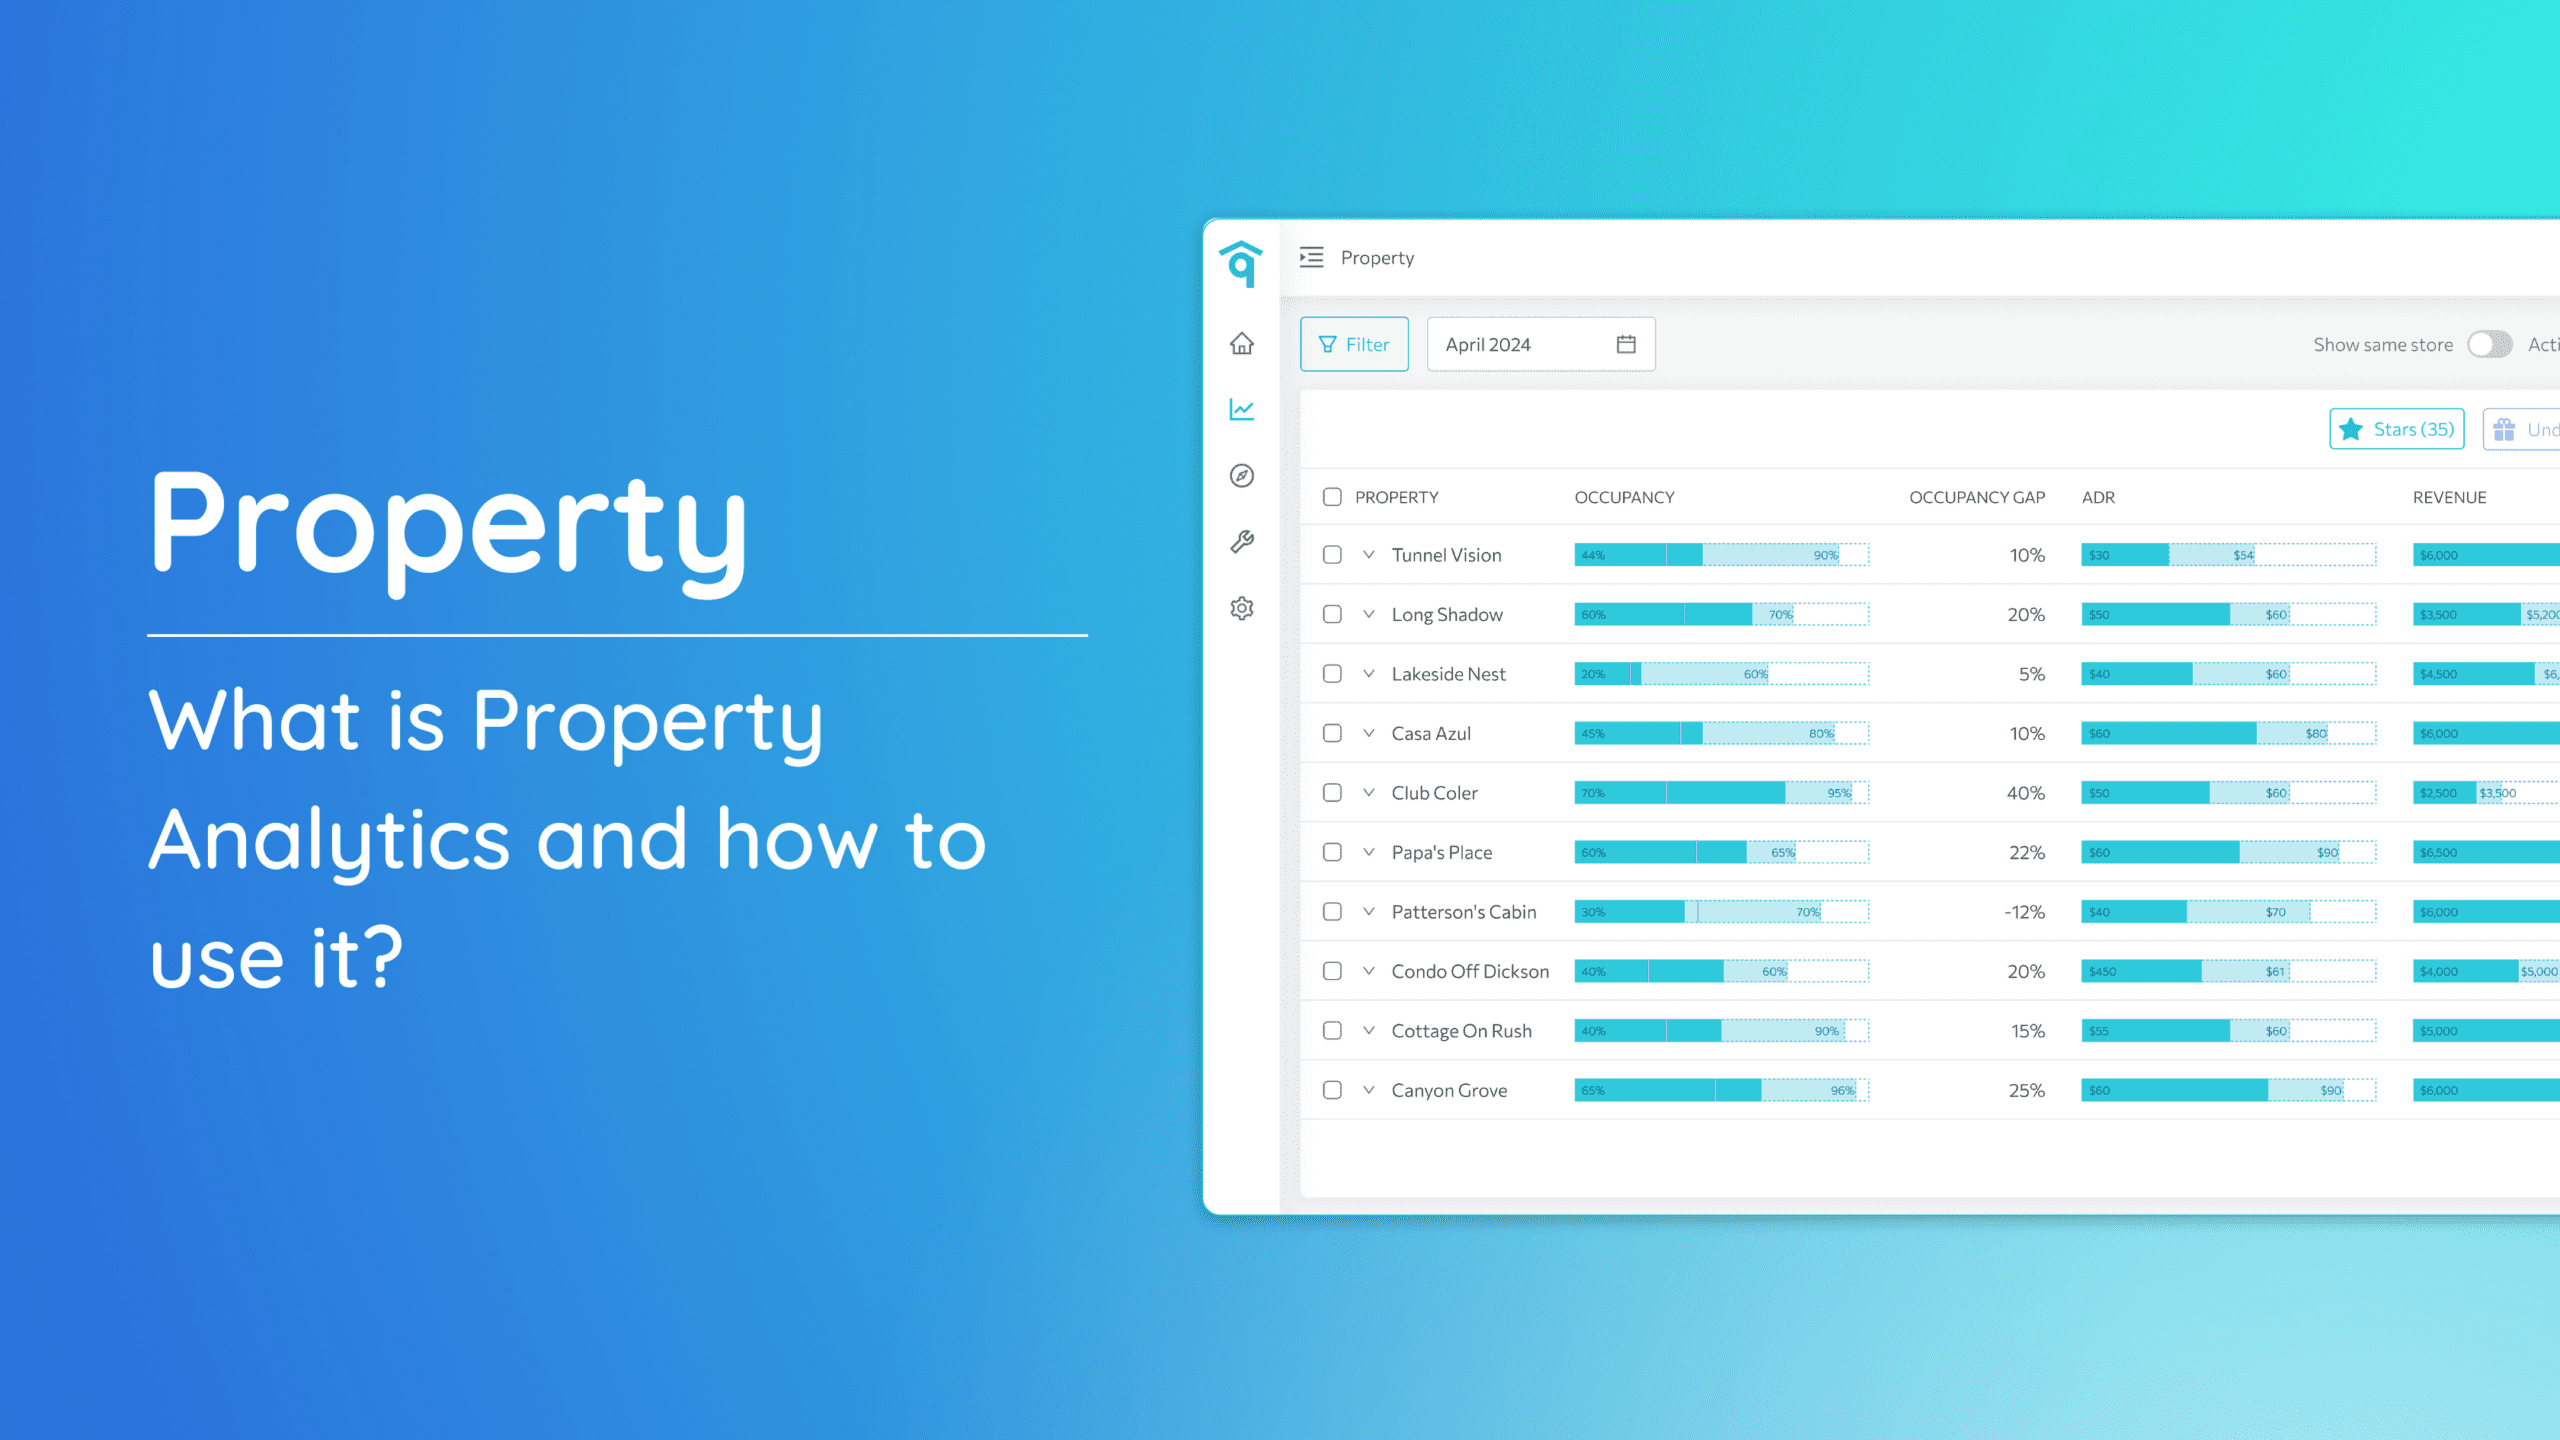
Market Details
Clicking on a specific market brings you to the Market Details page. Here, you can effortlessly target pertinent property data using our user-friendly filter options. These filters, including Stars, Underpriced, Overpriced, and Product Issues, empower you to make well-informed decisions for your pricing strategies.
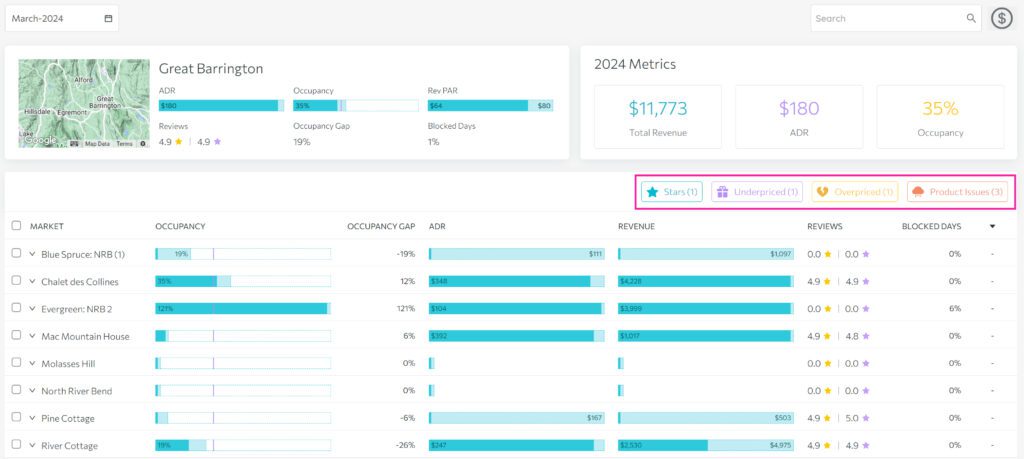
- Stars – Identify markets with higher occupancy than the market average and higher ADR compared to the previous month.
- Underpriced – Locate markets with higher occupancy than the market average but lower ADR than the previous month.
- Overpriced – Find markets with lower occupancy than the market average but higher ADR than the previous month.
- Product Issues – Review markets with lower occupancy than the market average and lower ADR than the previous month.
Join our newsletter
Dominate the short-term rental market with cutting-edge trends


Join our newsletter
Dominate the short-term rental market with cutting-edge trends