The Property Page offers a detailed view of each individual listing in your portfolio, bringing together key performance data, pricing insights, and market context—all in one place. This page is essential for understanding how a specific property is performing and identifying actionable opportunities to optimize its pricing and revenue potential.
Accessing the Property Details Page:
- To access the Property page, from the dashboard navigate to the left-side menu bar.
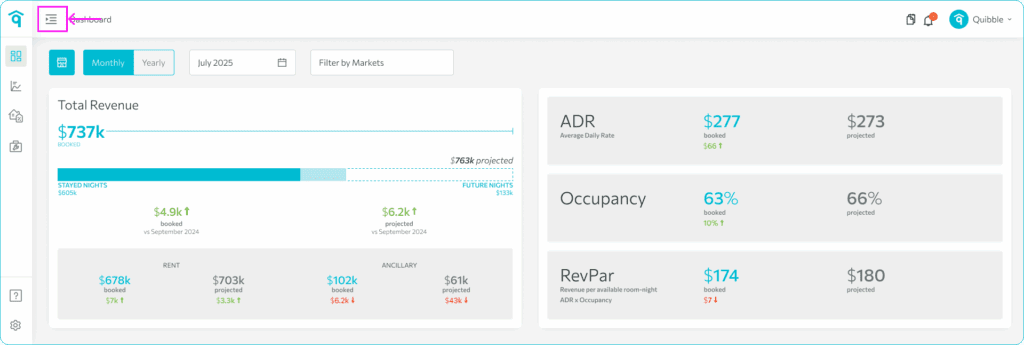
2. Click on the “Analytics” dropdown and select “Property”.
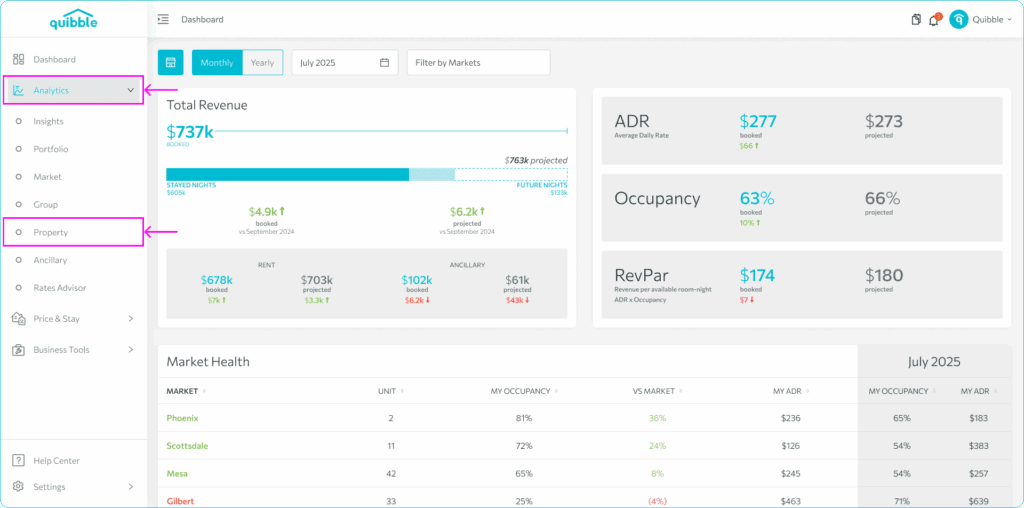
3. On this property list, click on the specific property you wish to view the details of.
Filtering Property Details
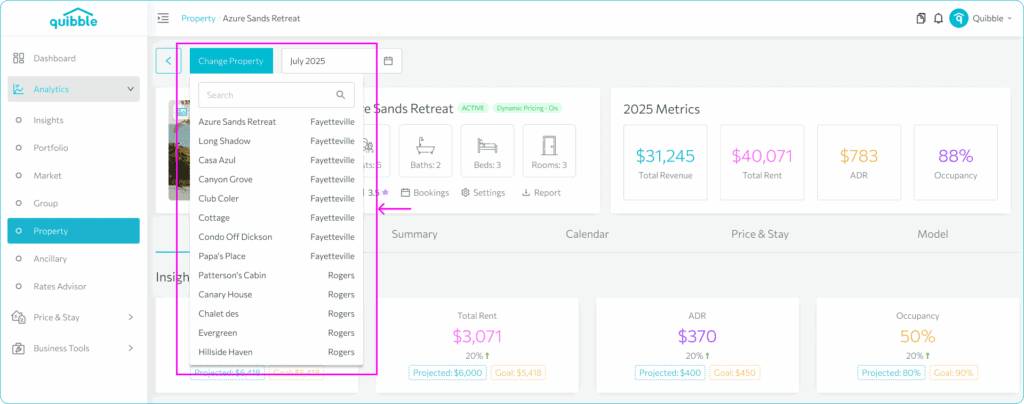
Change Property – this page is filtered to a single property so, it will be selected to the property you’re on. This dropdown allows you to choose other properties you wish to view.
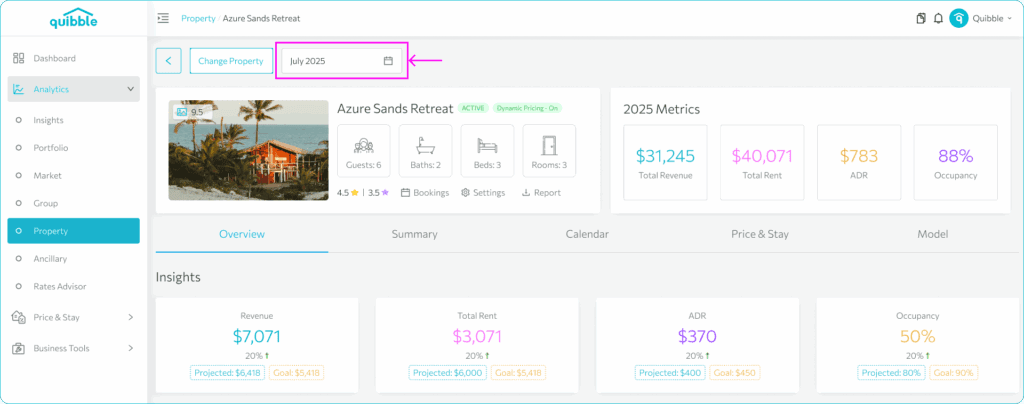
Date selector – this defaults to the current month and drives the data displayed on this page.
On the Property Page you’ll find:
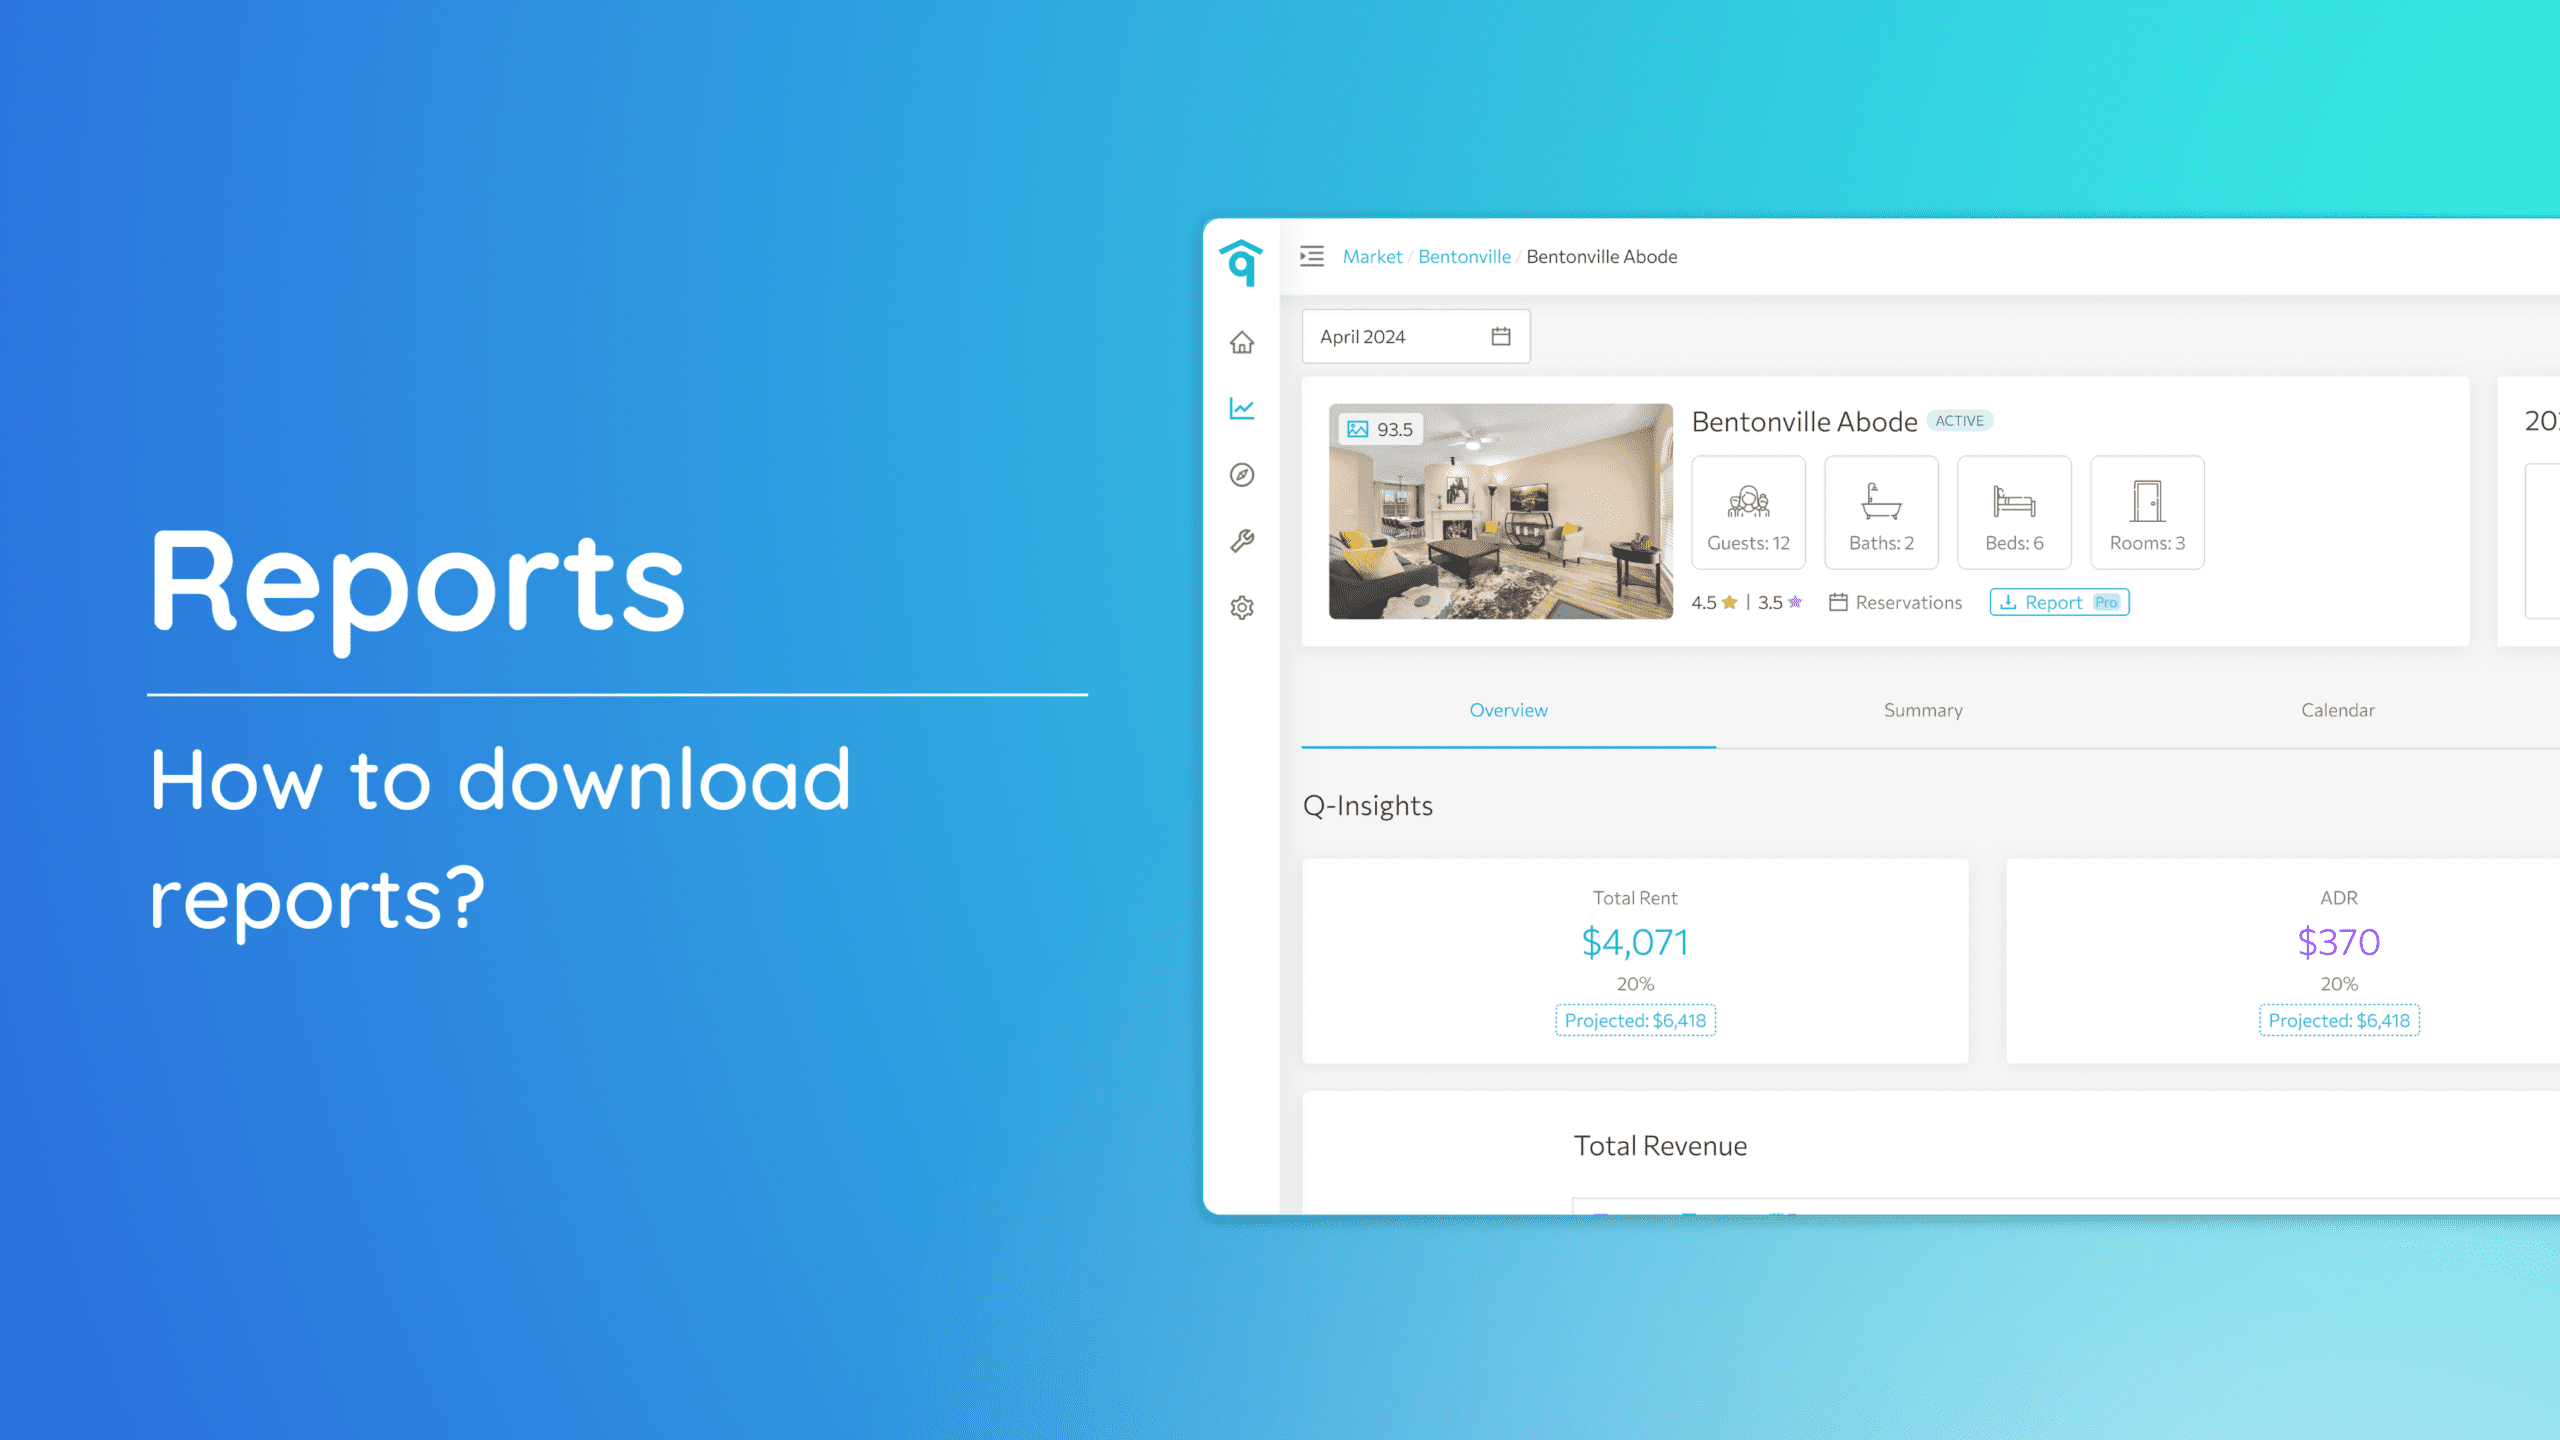
Listing Details shows the essential information about the property.
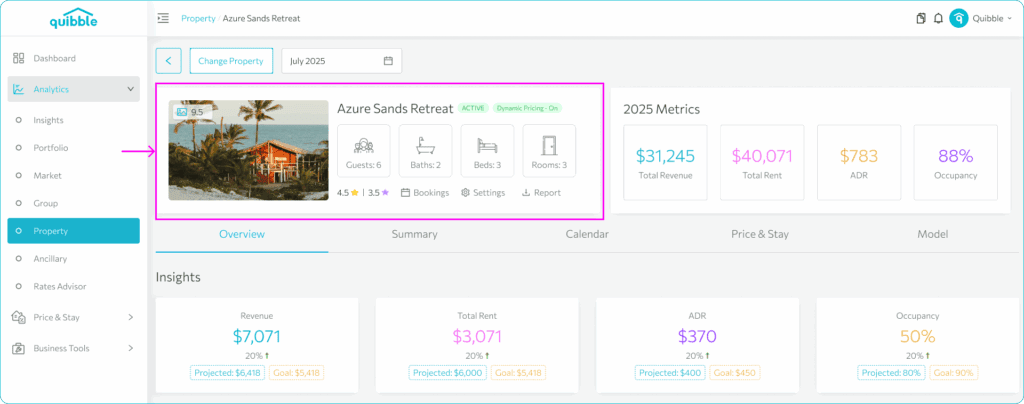
- Listing information shows how many guests can stay at the property and how many bedrooms and bathrooms it has.
- Listing Rating shows our rating versus the competitor ratings.
- Bookings clicking this takes you to a list of all the bookings for this property.
- Settings is where specific rules for setting minimum stays are set like the check in check out restrictions.
- Report button allows you to download detailed property reports.
Annual Metrics shows a high-level summary of the property’s performance over the year, including total revenue, total rent, average price or ADR, and then current occupancy. Hovering on these values also shows the projected and the goal values.
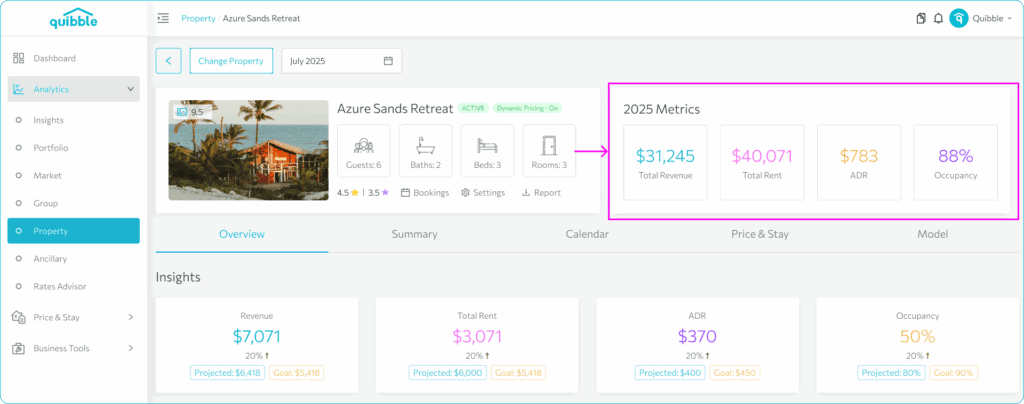
Overview Tab focuses on revenue performance—providing charts and metrics that track the property’s revenue for the month selected above.
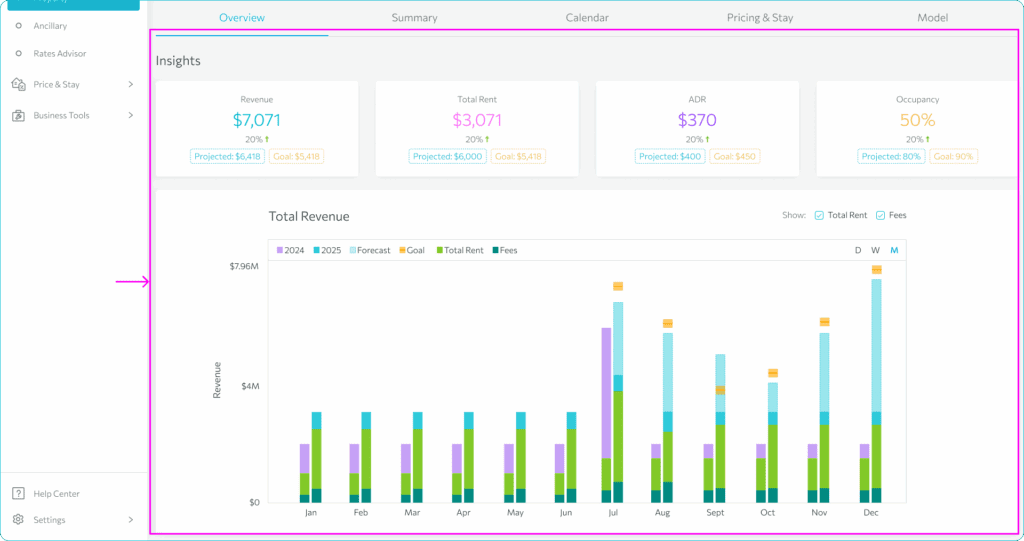
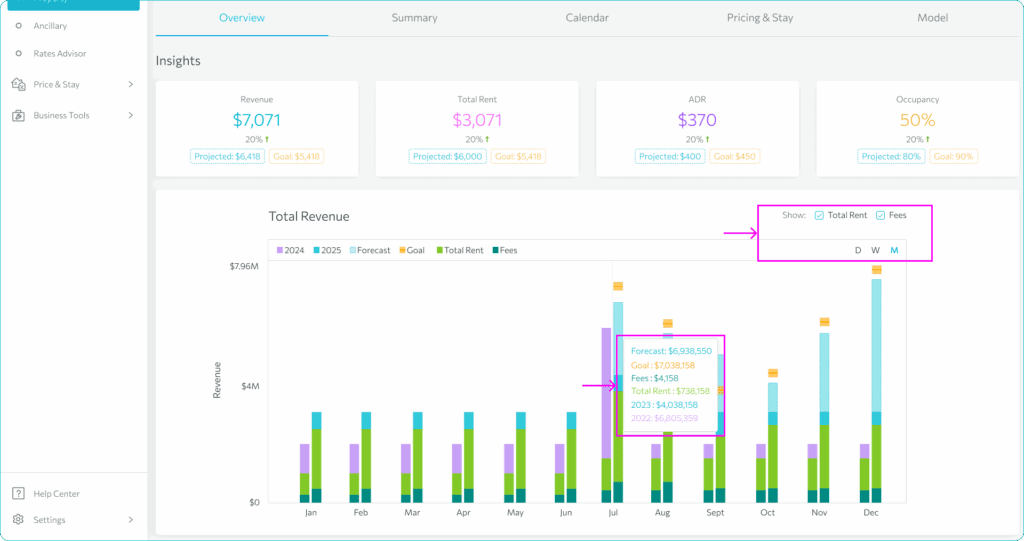
The Total Revenue graph shows the comparison of last year’s total revenue and the current values, also the revenue target and forecast. Hovering on the graph will show the exact values. You also have the option to filter the graph to display the Total Rent or the Fees, as well as the option to view the data either by day, week or month.
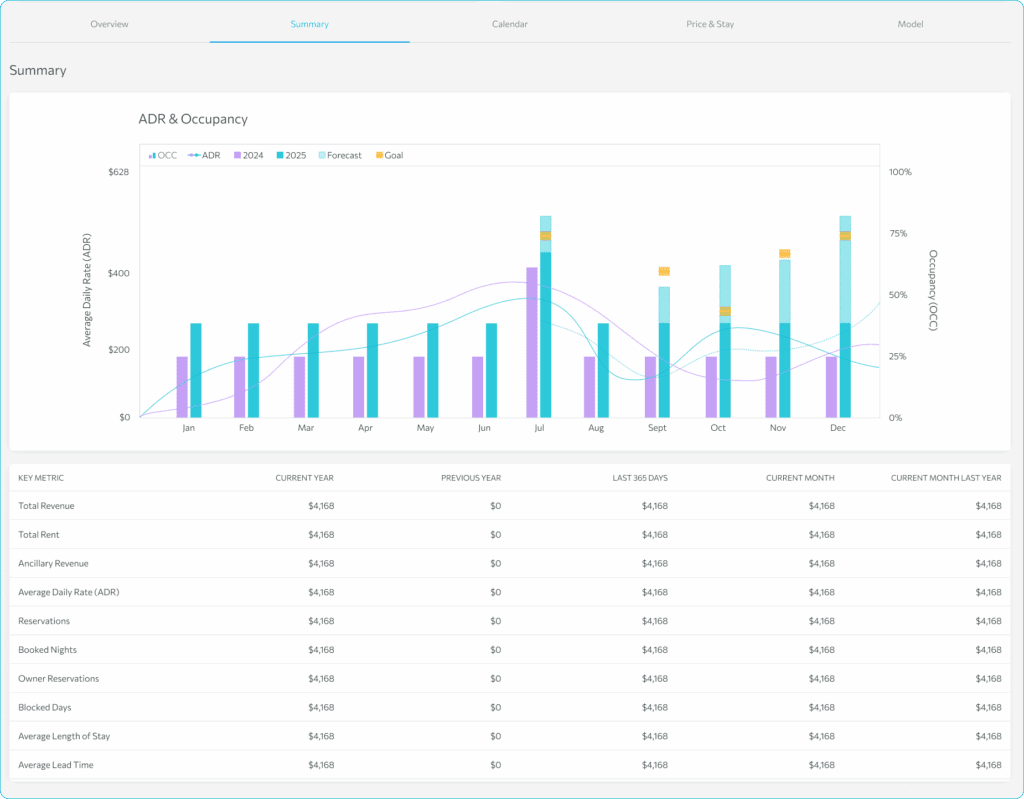
Summary Tab highlights occupancy rates and average daily rate (ADR) to give you a quick read on booking demand and pricing effectiveness.
Pricing Calendar is a visual, date-by-date calendar showing this specific property’s pricing, minimum stay and the reservations that are on or booked.
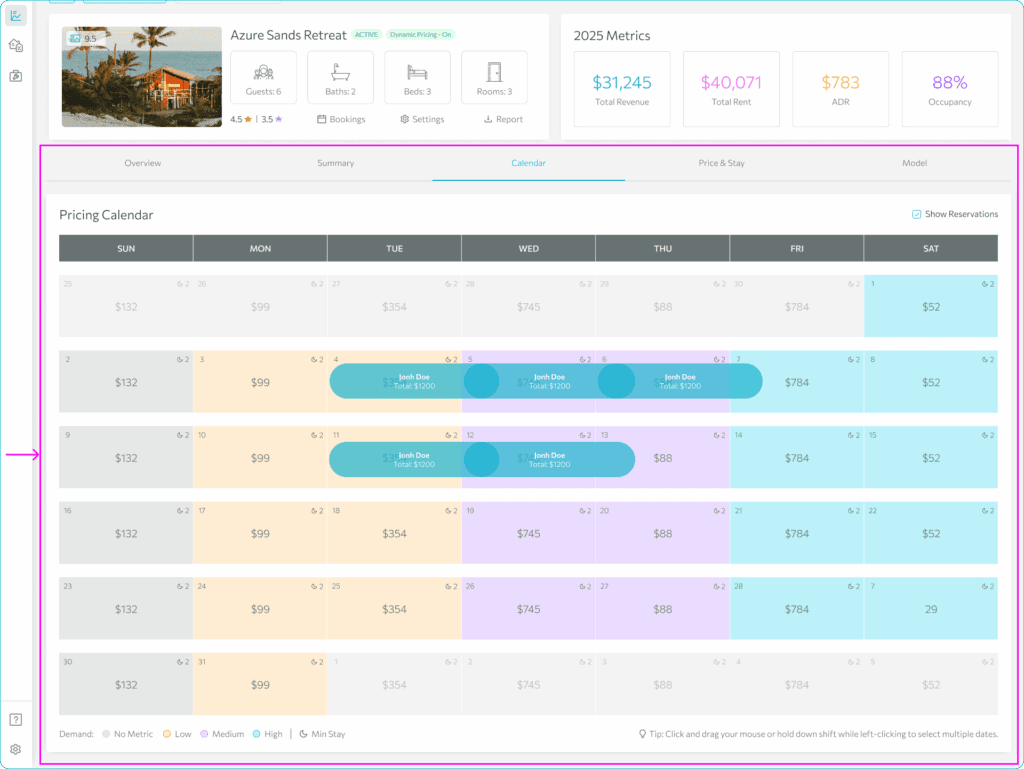
Visit the Pricing Calendar help page here for a detailed explanation of this view.
Price Graph displays the historical and future pricing trends, helping property managers understand how your current rates compare to past performance and your competitors, and be able to adjust them as necessary.
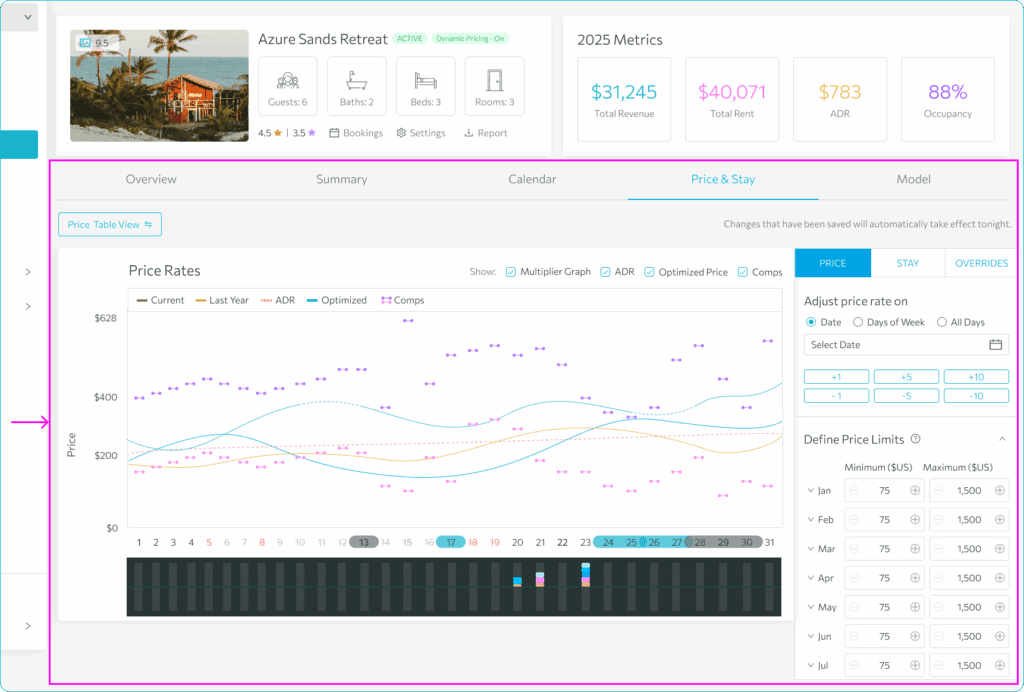
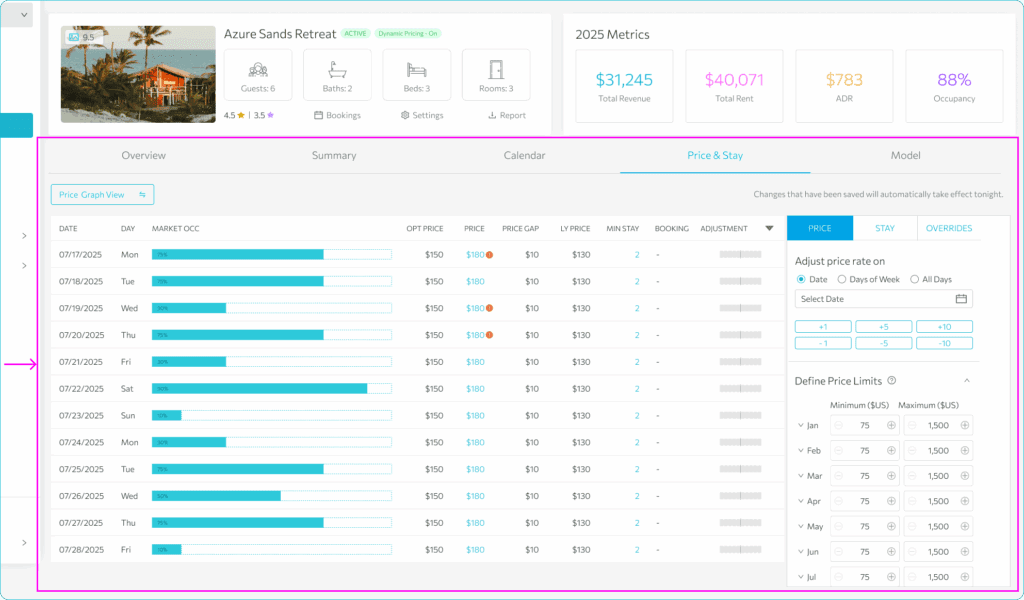
Visit the Price Graph help page here for a detailed explanation of this view.
Competitor Model tab displays your competitor data which allows you to gain market context by viewing competitive pricing benchmarks, allowing you to evaluate how your property stacks up against similar listings in the area.
Understand how the Competitor Model works by checking the help page here.
Join our newsletter
Dominate the short-term rental market with cutting-edge trends


Join our newsletter
Dominate the short-term rental market with cutting-edge trends