✅ The Basics of Forecasting
The term forecasting can be intimidating for those who have not done it before, but it does not need to be that way. In its most basic form, a forecast is just a guess at what will happen in the future. As humans, we are guessing the future all the time. Every time you save money for retirement, you are making a measured bet to make your future self happier. It is impossible to say if your retirement investments will be optimally placed. You merely are using the best information you have today to make decisions about the future.
The principal is the same in your short-term rental business. It is impossible to say precisely how much revenue your properties will produce in 2021, but you have access to information and intuitions about what will happen. Forecasting is just formalizing these into real numbers. A reasonably accurate forecast can help you set your marketing budget for the year and decide the best prices to charge for each of your properties each night.
💡 Why is Forecasting 2021 worth my time?
Forecasting is an effort aimed at improving your decision-making today for things that will happen in the future. If you are a property manager or owner, you will likely sell your inventory 365 days into the future. To maximize your properties’ potential revenue, you need to set the prices for all of that inventory now. You can update your pricing at any time before the inventory either books or goes unused. To set the exact optimal price 365 days before the night stay is very challenging and unexpected. With the methods described below, you will have an excellent indication of market demand for your property set, which is a powerful indication of your pricing strategy’s effectiveness. This process allows you to update your prices to better match market demand, which drives better revenue performance.
It’s common for a novice manager that has never built a forecast before to be off by 50%-70% on their first attempt. Simulations have shown that even a modest 10% improvement in forecast accuracy will result in an approximate increase in revenue of 1.0% (Weatherford and Belobaba, 2002). Imagine your revenue improvement if you have not built a forecasting process at the moment. To get these revenue gains, you have to develop a forecast, update your forecast, and take action based on your learnings. Forecasting is not a one-time project. It is an ongoing process of continuous improvement. There is no direct cost to get started besides your time, and you already have all the data you need!
🤔 Is it possible to forecast 2021?
The short answer is YES! Not only is it possible, but it is also imperative. Despite the impacts that COVID-19 has had on our industry, forecasting 2021’s revenue requires the same process as forecasting any other year. This year you will have to estimate the impact of one additional variable.
Often overlooked when claiming 2021 is impossible to forecast is the fact that everything we predict has an inherent amount of error, from vacation rental demand to who will win the Super Bowl. When forecasting human behavior, there is a high degree of unpredictability.
Building the most accurate forecast possible is undoubtedly worth the effort. What is most important is making a process to improve your forecast as new data comes in continually. The most sophisticated revenue forecasting tools on the market (I have used many of them in my ten years of Pricing and Revenue Management) accept high error levels, significantly far from the event taking place. Below is a table describing acceptable levels of error in revenue forecasting. (Barlow, 2013).
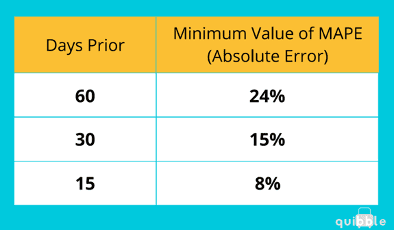
This table should give even the most novice of forecasters great confidence. It says that 60 days before a night stay, your forecast should be within 24% of the final revenue number. It is possible to overestimate the revenue or underestimate it. Let me give a concrete example, so it is clear how big of a gap that is. If your forecasted revenue for all of your properties is $25,000 on a future night stay, the final revenue for that night stay can be -24%, $18,750, or +24%, which is $31,250.
At 30 days before the night stay, the expectation of accuracy will tighten. That is because we have had 30 additional days to take reservations and evaluate market patterns and demand conditions. We should know more and be prepared to improve our forecast to be within 15% of the final revenue number. A $25,000 forecast now could be as low as $21,250 or as high as $28,750.
At 15 days prior, the estimate should be pretty close to the final number. By this point, customers will have booked much of the available supply. Now you have a much better estimate of the number of the remaining properties that will be booking soon. You also know how your Average Daily Rate’s (ADR) are doing and the pace at which bookings are coming in. This point in the forecasting process has a much lower tolerance.
The most important part of forecasting is not the initial forecast. When forecasting 60-90 days before the event, the revenue expectation is likely to be off by 24% or more. The most crucial part is that your forecast continues to improve over time. The impacts of COVID-19 can undoubtedly make this more challenging, but it is not impossible. When events occur that make forecasting more unpredictable, revenue teams will frequently expand the tolerances they are willing to accept for error. They will certainly not throw up their hands and admit defeat, and neither should you.
🏗 Building a Forecast
The starting point to building your forecast is deciding the relevant data that is required. The short-term rental industry has a strong dependency on competitor data. Although this data has an important role to play in other areas of your business, it does not belong as a primary data source in your 2021 forecast. The best data for forecasting YOUR property performance is YOUR reservations data. If you have no reservation data, competitor data is the only option until the next year.
YEAR
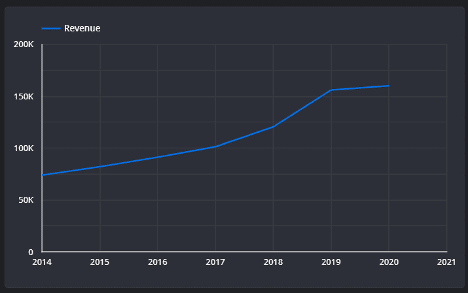
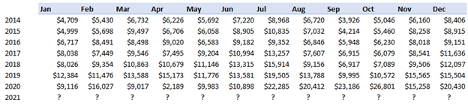
Developing a forecast for 2021 can seem complicated, but with just a few numbers, you can get it done. Trending the total revenue by year can give you a good idea of what might happen next. Total Revenue in this chart is all revenues earned for night stay in that year.
The graphical representation below makes the trend easier to observe. In the graph below, we have a historical dataset to evaluate that goes back to 2014. The trend leading up to 2019/2020 was a healthy, positive growth rate. The rate of growth slowed in 2020 due to COVID-19. If that slower growth trend continues, the 2021 revenue will be up 2%-3%.
YEAR/SEASON
A slightly more complex forecast includes both the year and season(month). A significant advantage of this added complexity is that it shows us more granularity where things are over and underperforming. It also gives us 12 separate forecasts to manage. There will be lessons learned in January that we can apply to our February forecast. That will also be the case as we move forward along the year. These changes and fine-tunings are the keys to improving our forecast over time.
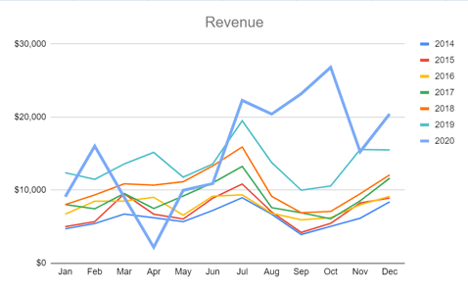
We have established in our YEAR forecast that we anticipate a 2%-3% revenue increase in 2021. This expected assumption carries over into our estimate for our seasonal forecast. First, we need to validate that we have a consistent seasonal pattern in our 2014-2020 dataset.
From the graphical view below, there is a distinct seasonal pattern that follows year after year. The 2020 data breaks the seasonal trend in March, April, May, and June. Before using this seasonal data, we need to clean or adjust it for the impact of COVID-19. A method of correcting this data would be to replace the 2020 observations with 2019.
YEAR/SEASON/PROPERTY
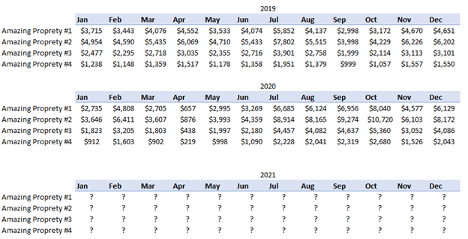
Since the above data does not show the detail of revenue for each property, it is impossible to see if you are managing more properties in 2021 than you were in 2015. The increases in revenue happening over the past could be driven by adding new properties to the portfolio. That is essential information for the forecast.
The more complete view below includes the same data values with the property values now added in. Unfortunately, this becomes a much bigger set of tables and does not graph well. But this is the appropriate level to build, store, and update your forecast.
📊 How to update your forecast?
Now that we have a forecast built at the appropriate level, it will require some maintenance. Every passing day that we do or do not receive a booking for 2021, we learn something about 2021 demand. We understand the most about booking activity within the three months leading up to the check-in date, as most bookings will occur within this time. We will apply these learnings to future months.
To update our forecast, we need to set a benchmark dataset. This benchmark will help us understand if the sales revenue is happening faster or slower than expected. Then we can increase or decrease our forecast based on our comparison to the benchmark. Year-over-year (comparing this year’s data to the same data last year) is a standard method for comparing data like this. In the months of 2020, we saw some anomalies in the March-June data, so those months need either excluded or adjusted before they make a good benchmark.
In the graph below, the “Jan 2020 Revenue” curve shows the cumulative build-up over time for all reservations that occurred in a single month, January 2020. This is what we will use as a benchmark for 2021. Where the line terminates represents the total revenue generated for all reservations that are staying in January, it is the end of that month. It is the revenue curve for January 2020. The “Jan 2021” line represents the same revenue as it is booking for January 2021. You will see that this line has not yet terminated and still has more revenue to build from new sales. This is because the month is not yet over. The slope of each line and the gap between the lines tell us what we need to know to update our forecast.
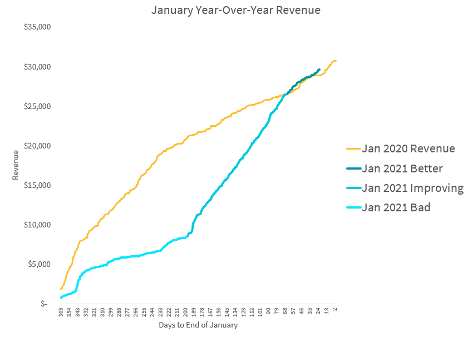
The “Jan 2020 Revenue” curve is used to set our expectations for 2021. If reservations are booking slower this year than in 2020, the blue line will be below the yellow line. This is an indication that this year’s performance will be worse than last year. I have indicated the booking period where our expectations for 2021 were worse than 2020, labeled Jan 2021 Bad.
There is another period on the chart where we perform worse than last year, but our booking pace is faster than last year, labeled Jan 2021 Improving. This means the blue line (This Year) is below the yellow line (Last Year), but the rate we are taking bookings is faster. This is a vital metric because it lets us know if we are in a bad position and getting worse or a bad position and getting better. It is precisely what we need to know to update our expectations for 2021.
The third period marked on the chart shows where we are doing better than last year, labeled Jan 2021 Better. We were doing worse at the beginning of the year, but things got better and better until we overtook the previous year’s revenue performance. Building a chart using these revenue curves is the best way to evaluate your performance and update your forecast. This is all done using data you already have, which is highly reliable and costs you nothing.
🌟 Getting started with your 2021 revenue forecast
2020 was a strange year for our industry and the entire globe. The ongoing pandemic is an excellent example of why forecasting is so important. It was impossible to forecast the impact of COVID-19 before it happened. With a well-developed forecasting process in place, we would be better suited to react to the effects. COVID-19 highlights our need for a 2021 forecasting process.
To help you get started, plug in some of your figures here as a starting point.
References
- Barlow, J. (2013). Revenue Management Improvement Plan Final Report. Unpublished paper.
- Weatherford, L.R., and Belobaba, P.P. (2002) Revenue impacts of fare input and demand forecast accuracy in airline yield management.
- Journal of the Operational Research Society, 53, 811–821.


Join our newsletter
Dominate the short-term rental market with cutting-edge trends