How to configure the Portfolio charts
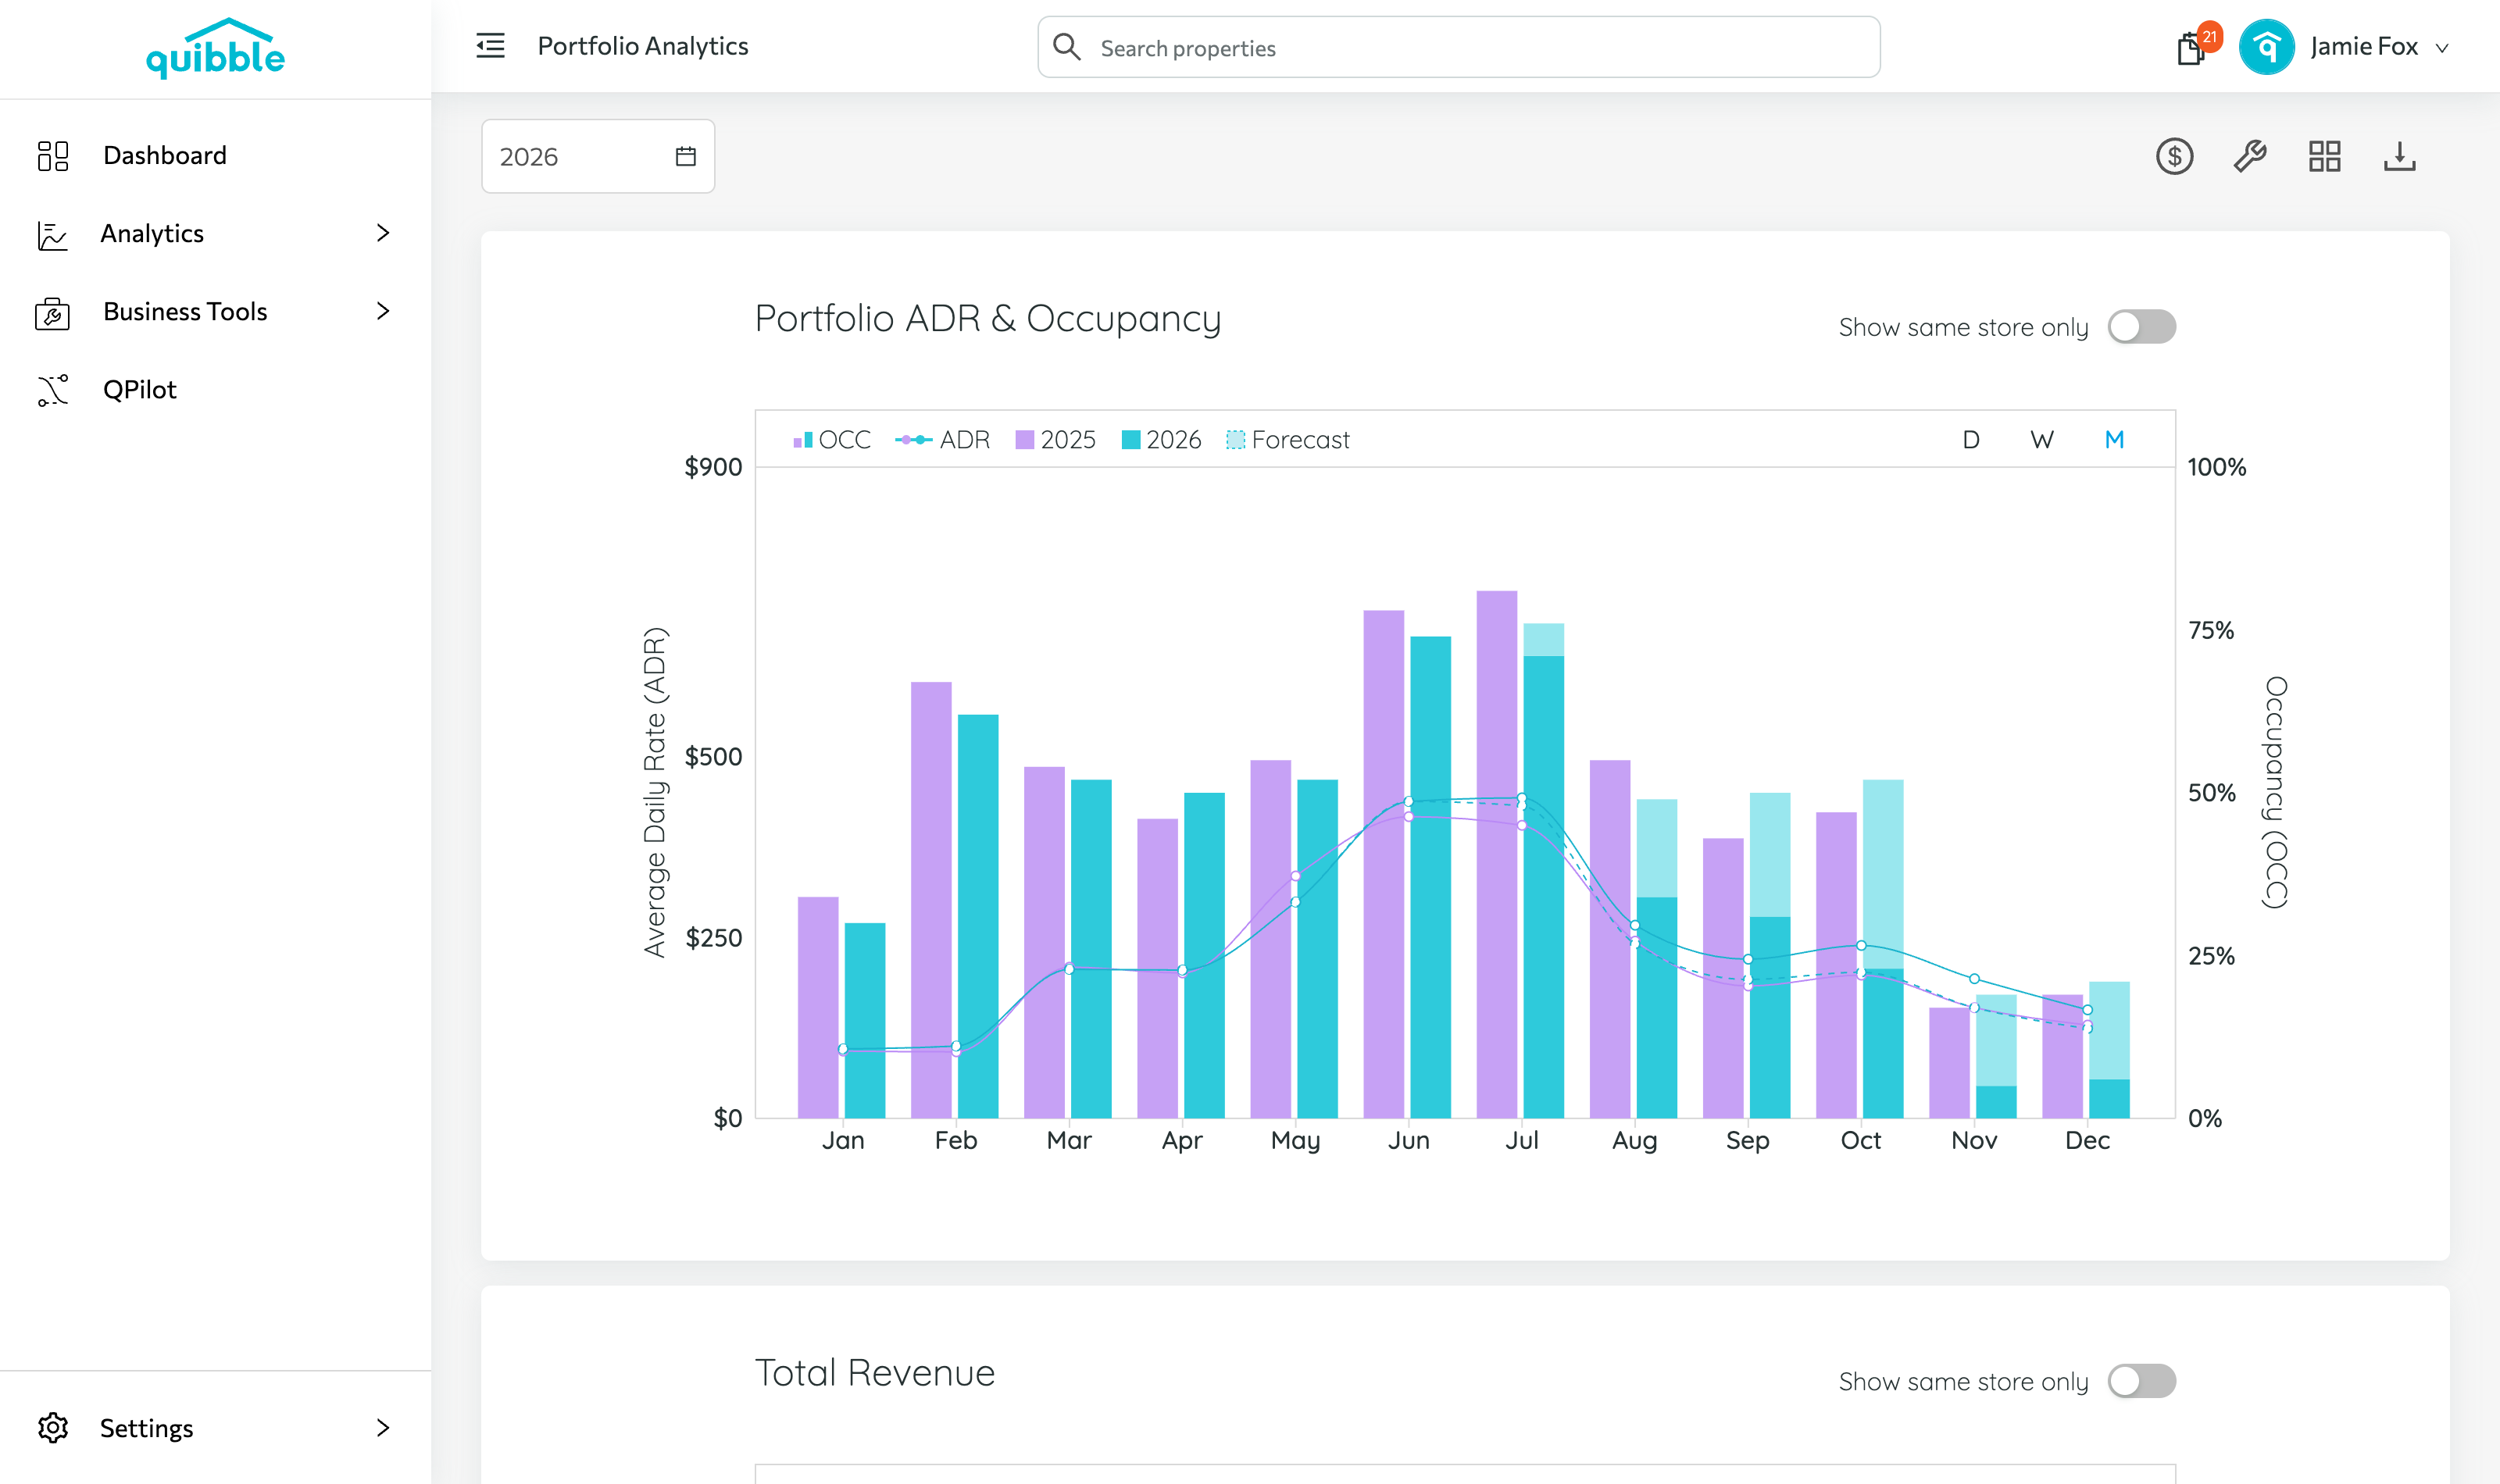
The Portfolio Analytics page surfaces seven essential metrics. Use the wrench icon to choose which charts show, then read each one.
Click the wrench icon in the upper-right of the Portfolio Analytics page to choose which charts appear.
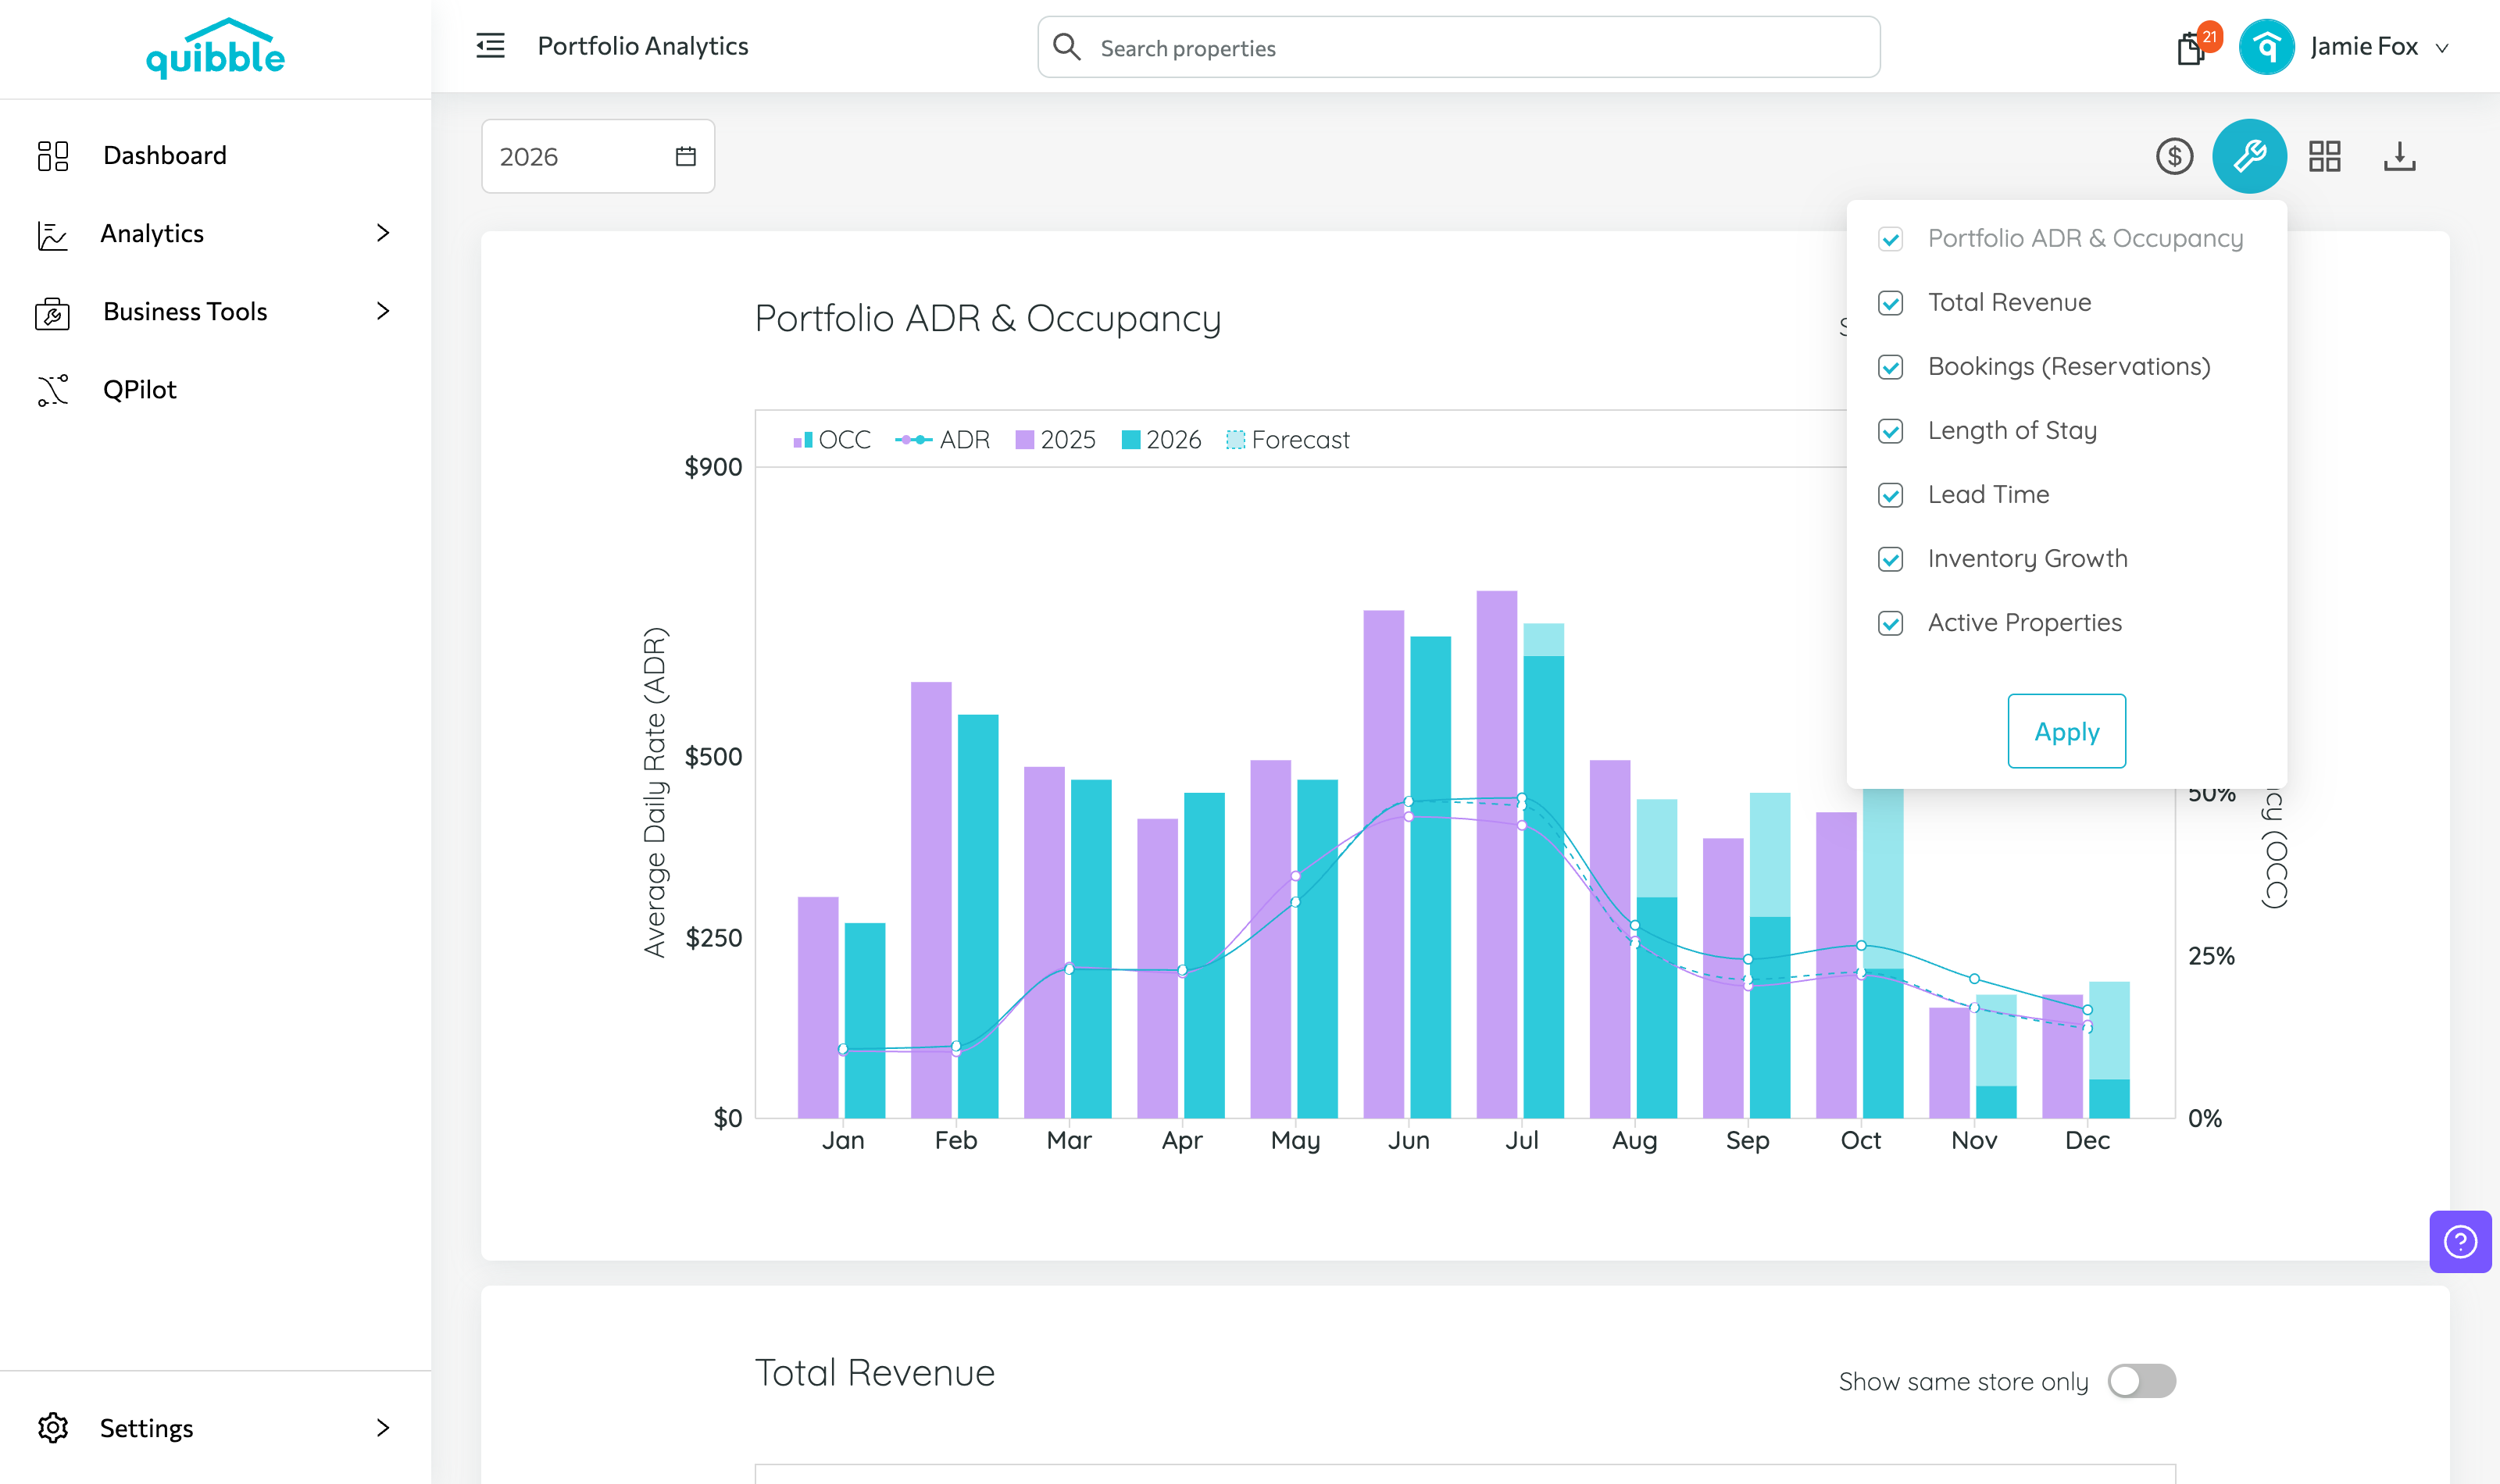
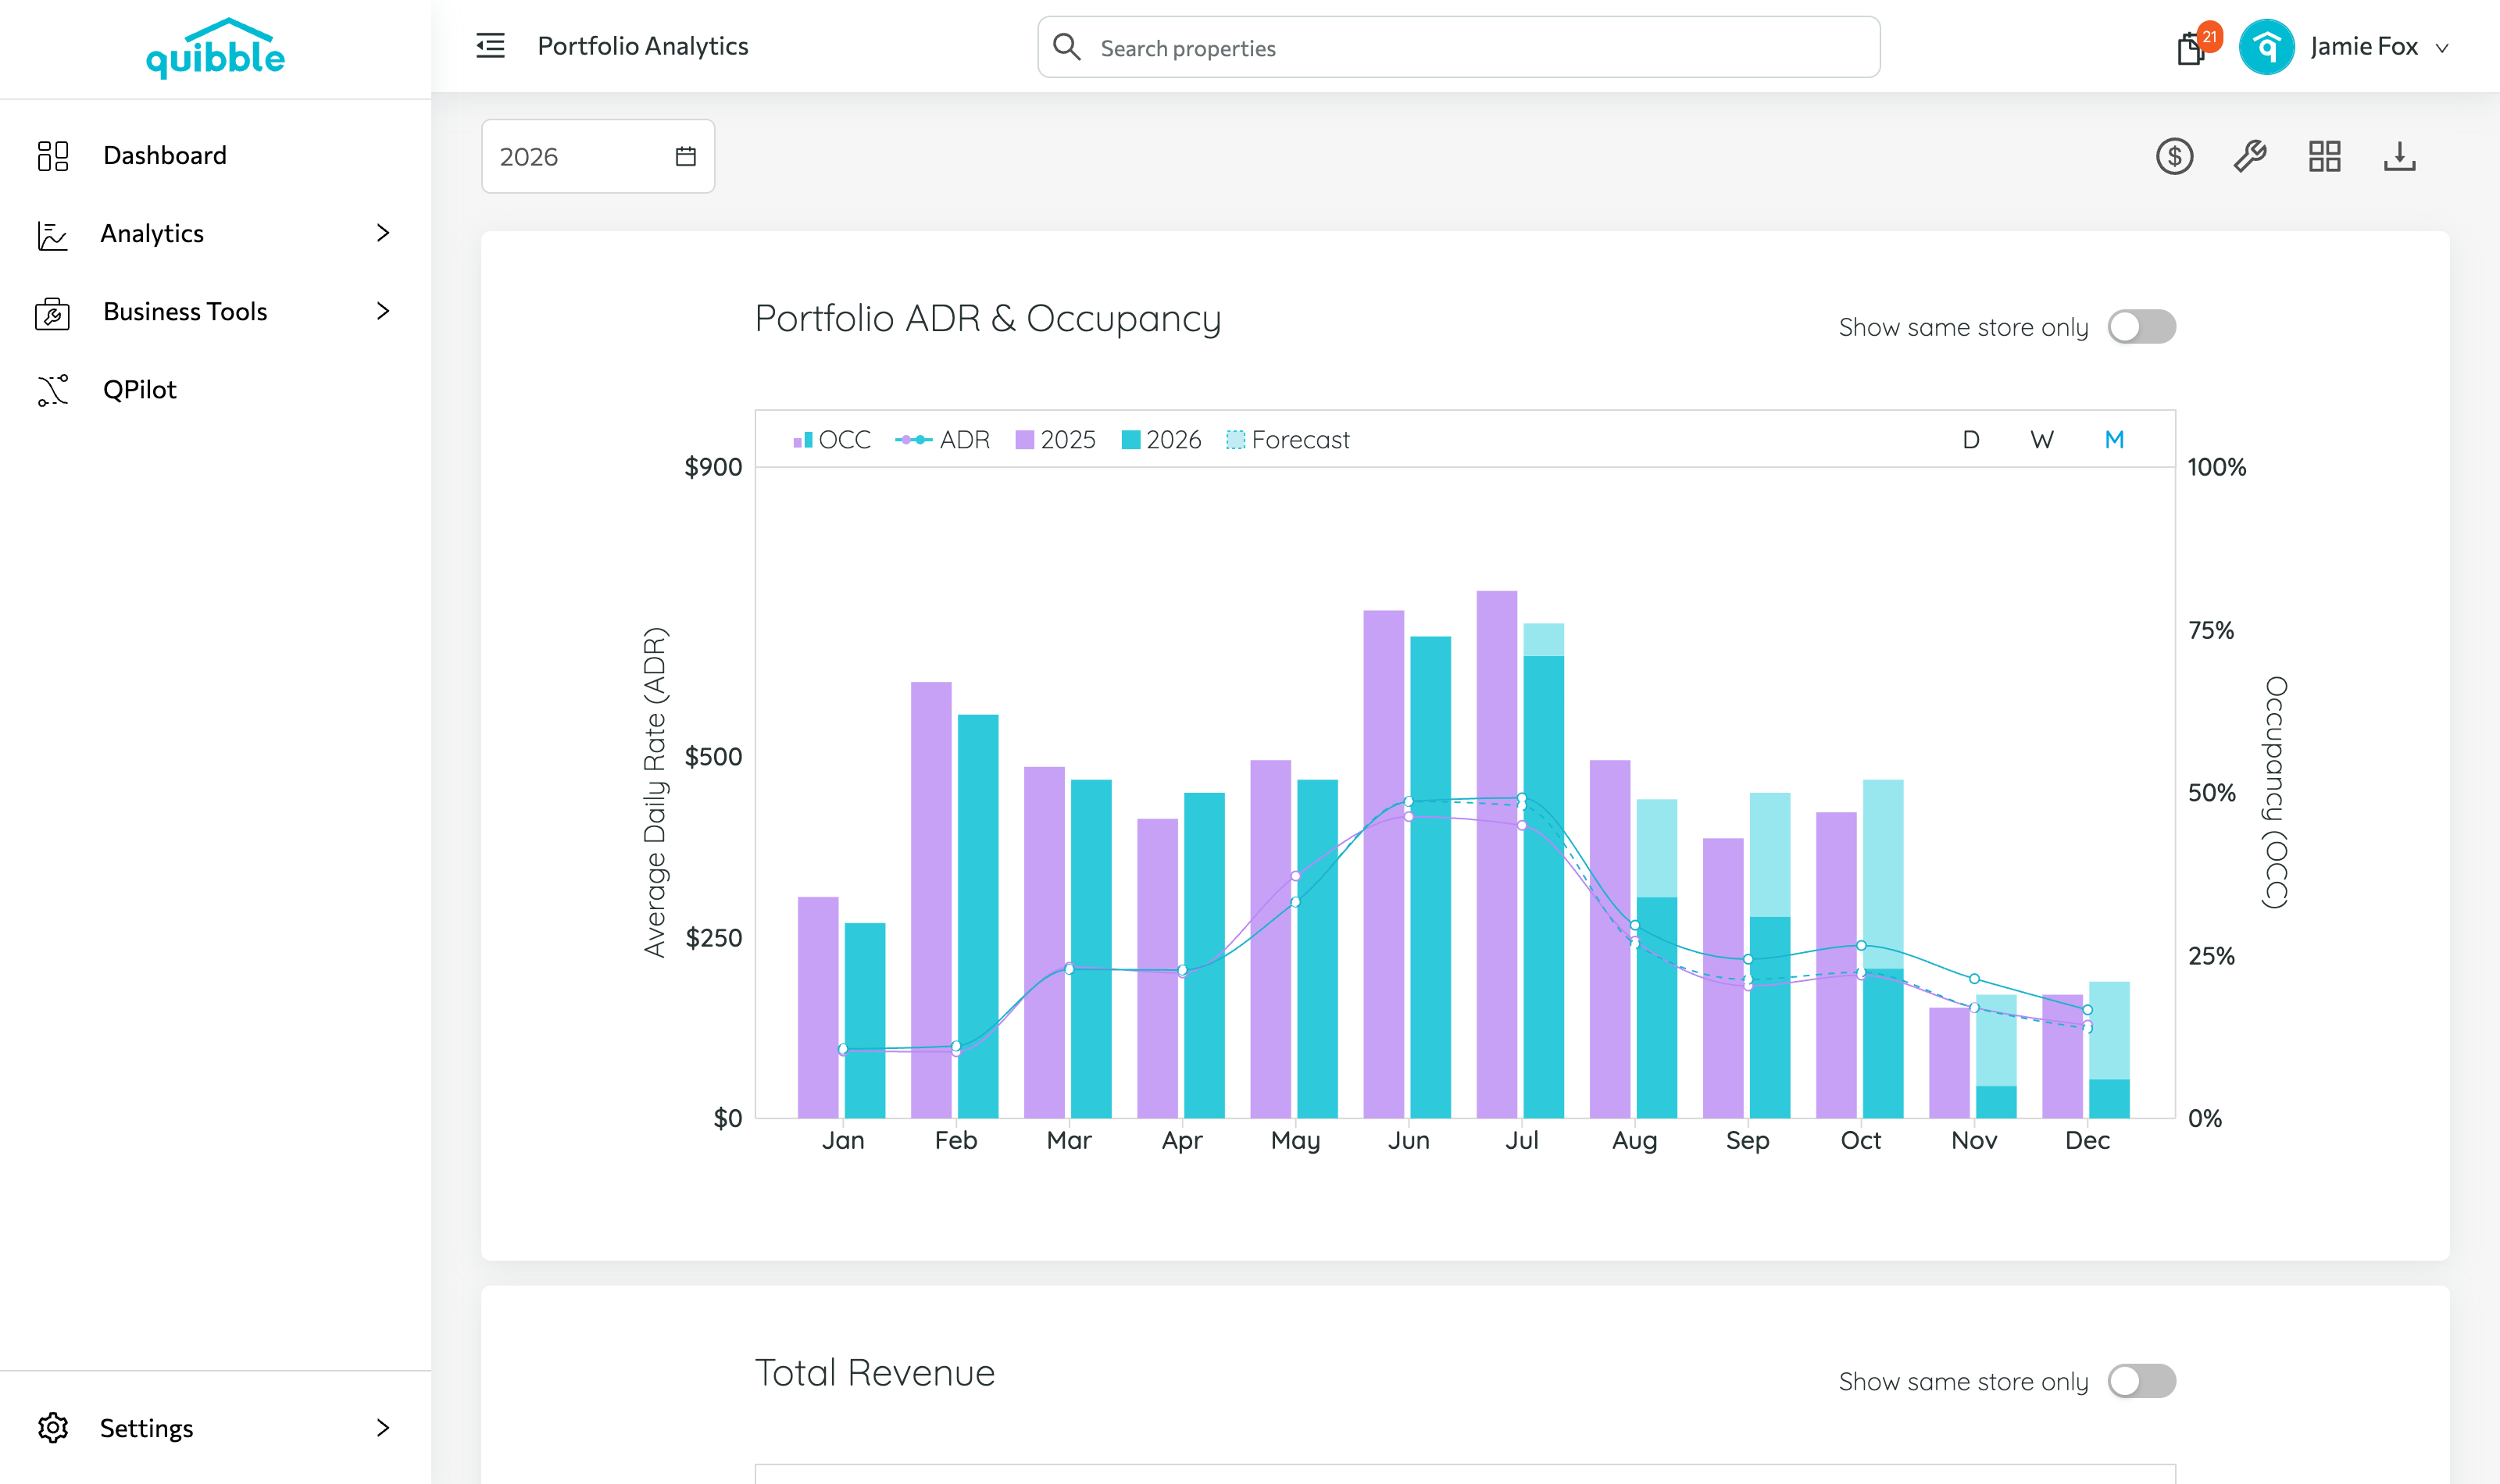
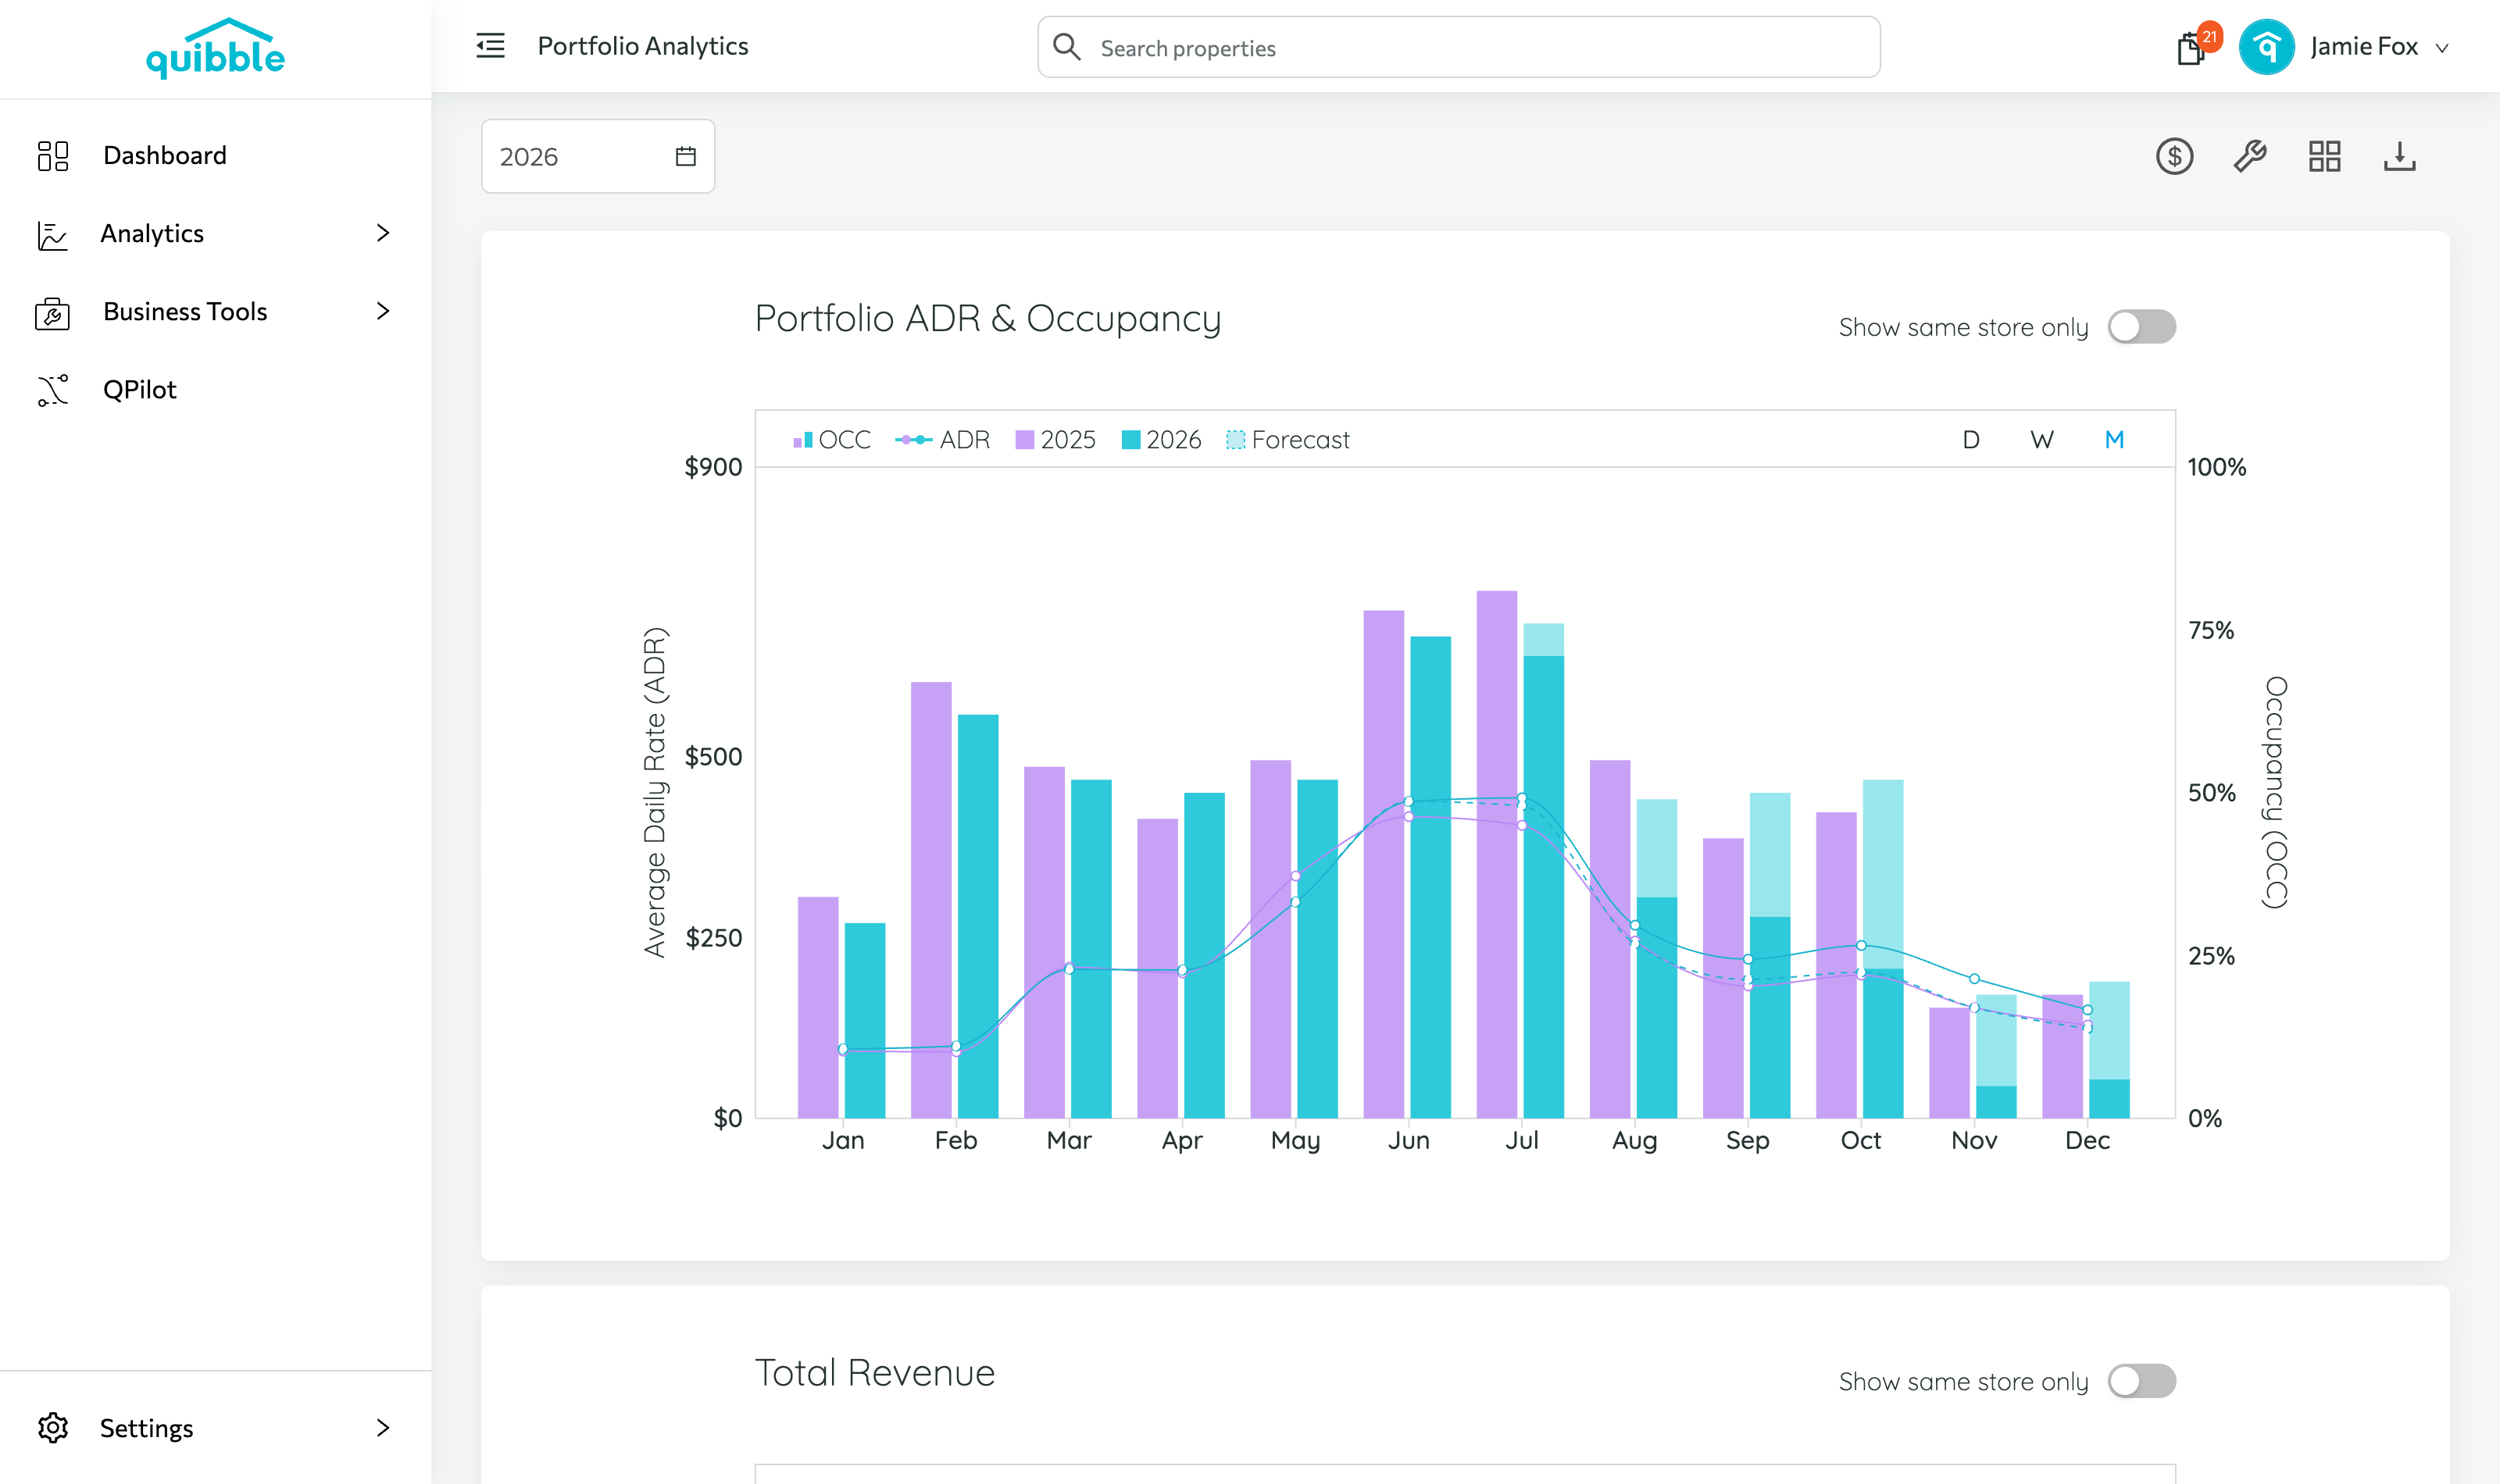
Portfolio ADR & Occupancy — average daily rate and occupancy, the two crucial indicators.
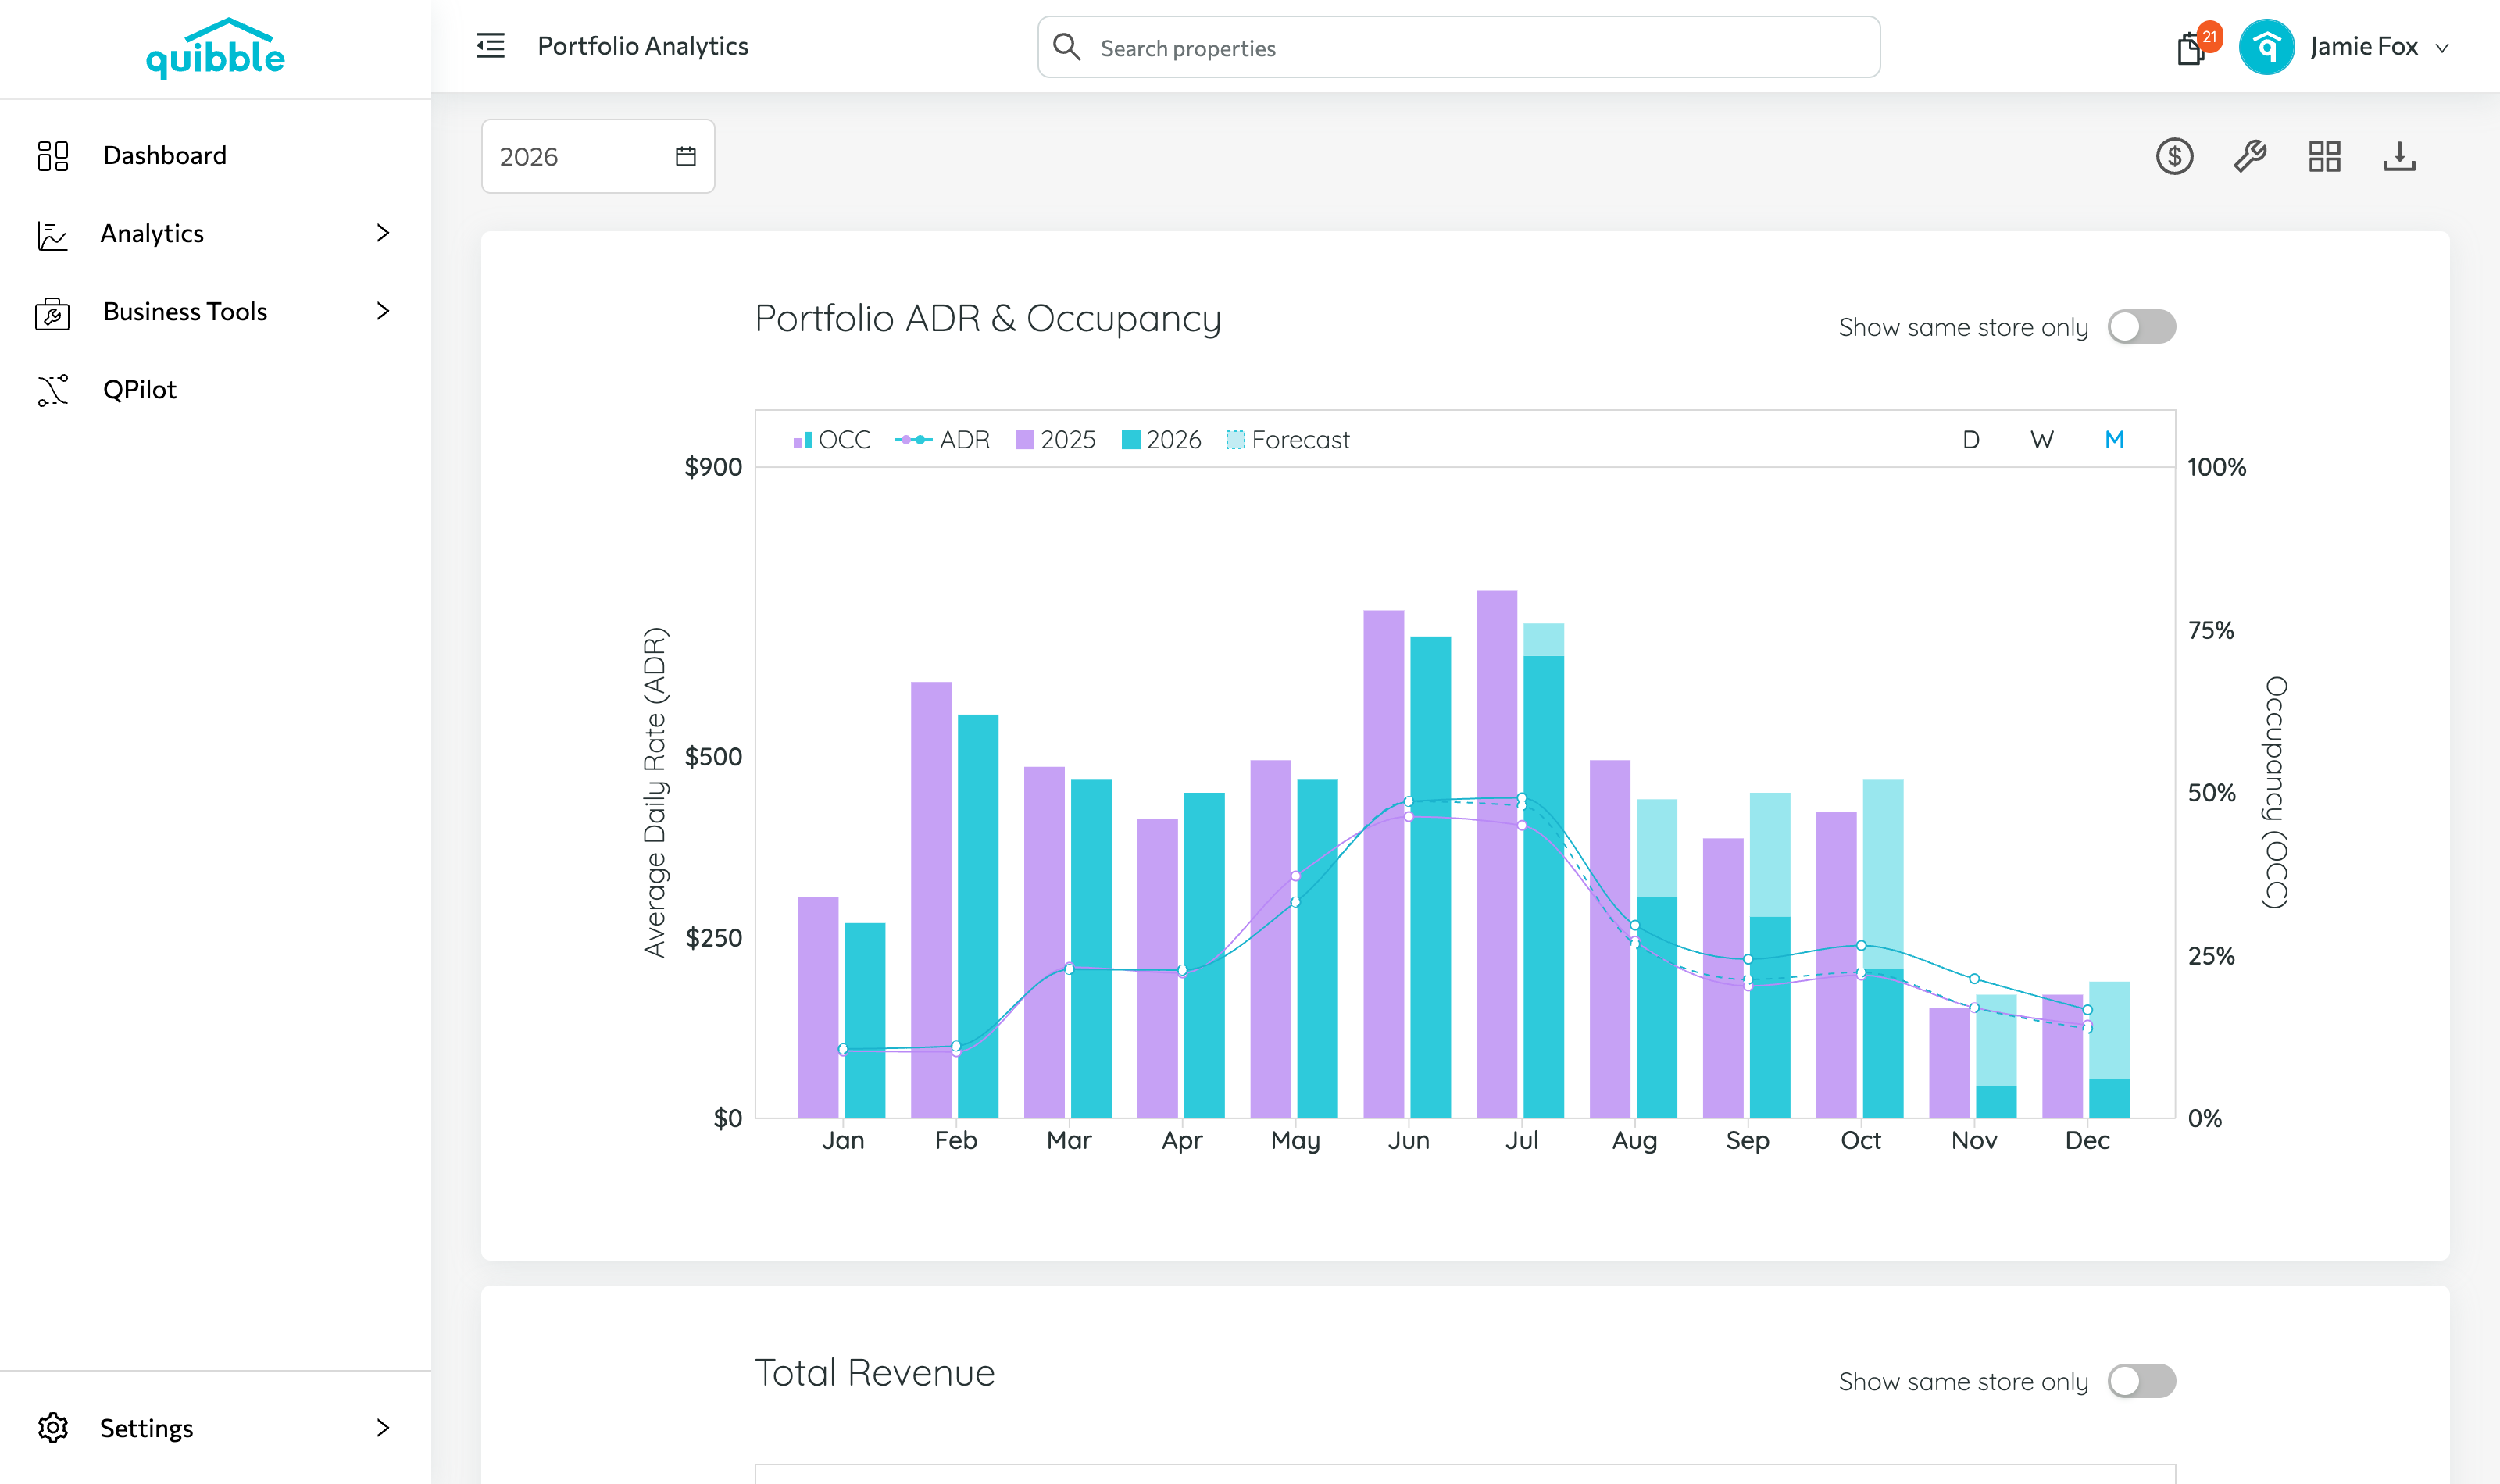
Each chart compares year-over-year, with exact values on hover; the forecast is generalized from historical trends.
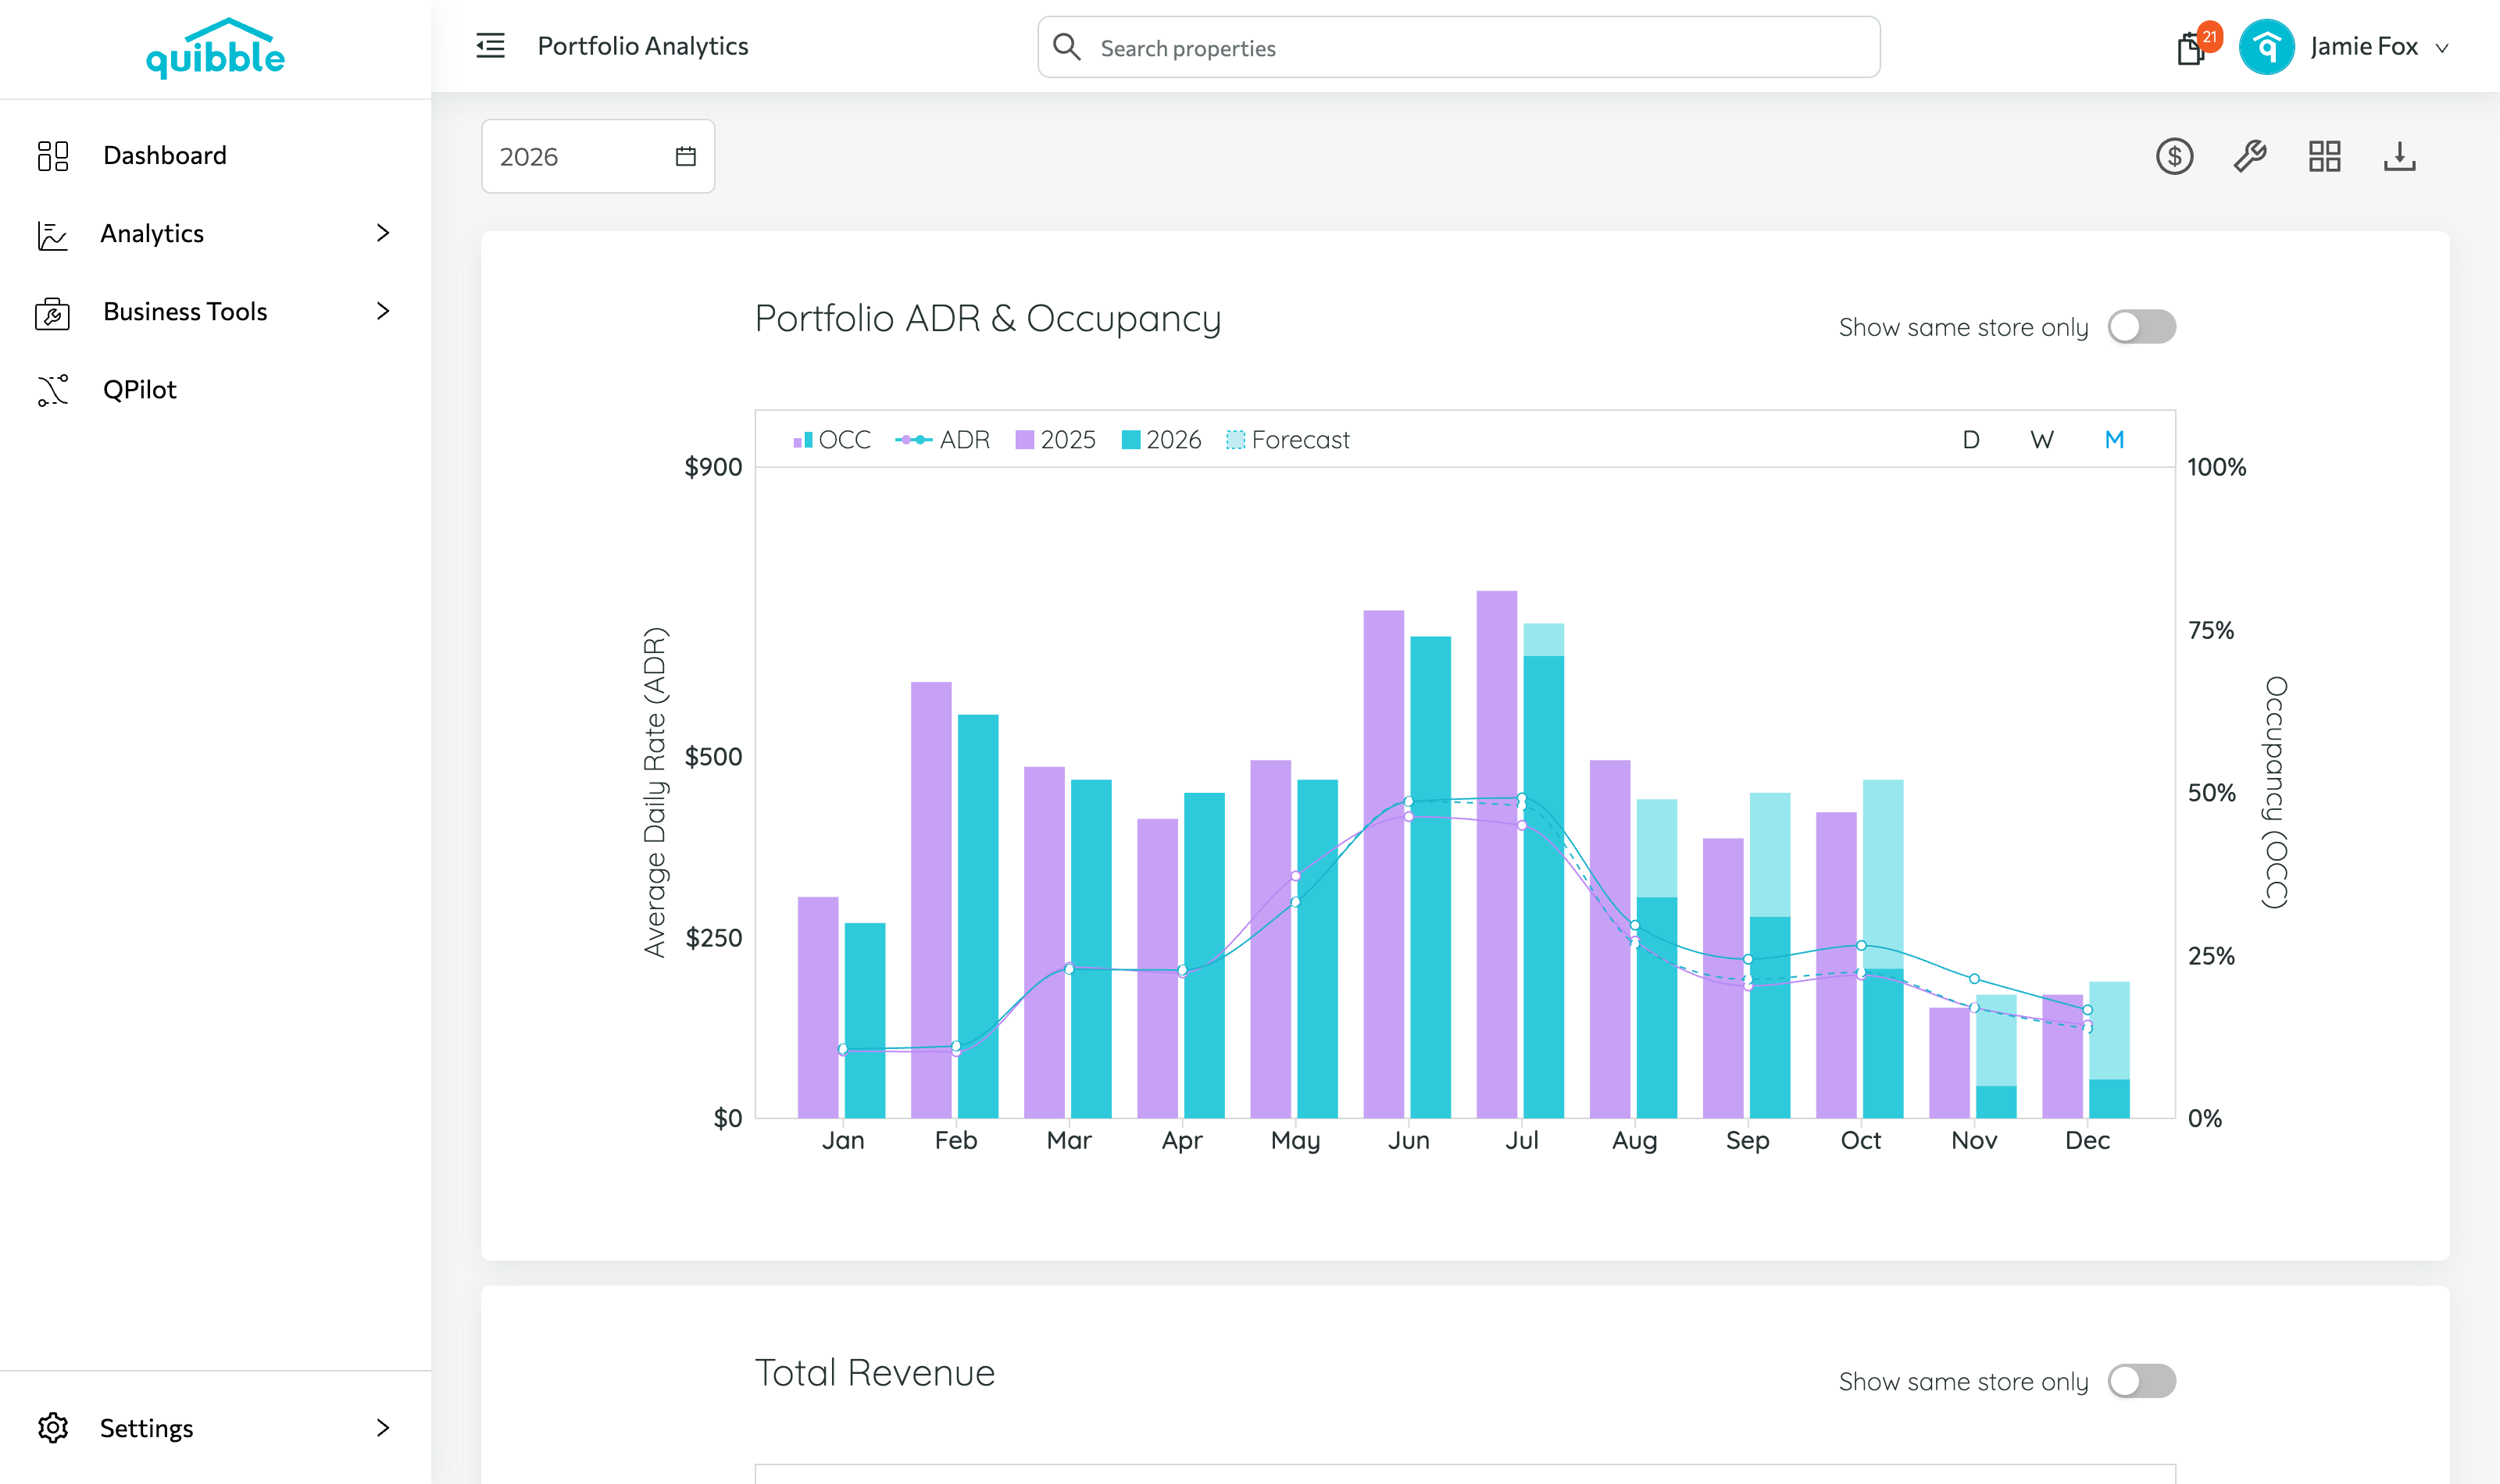
An Adjust Pricing button jumps straight to the price-adjustment page.
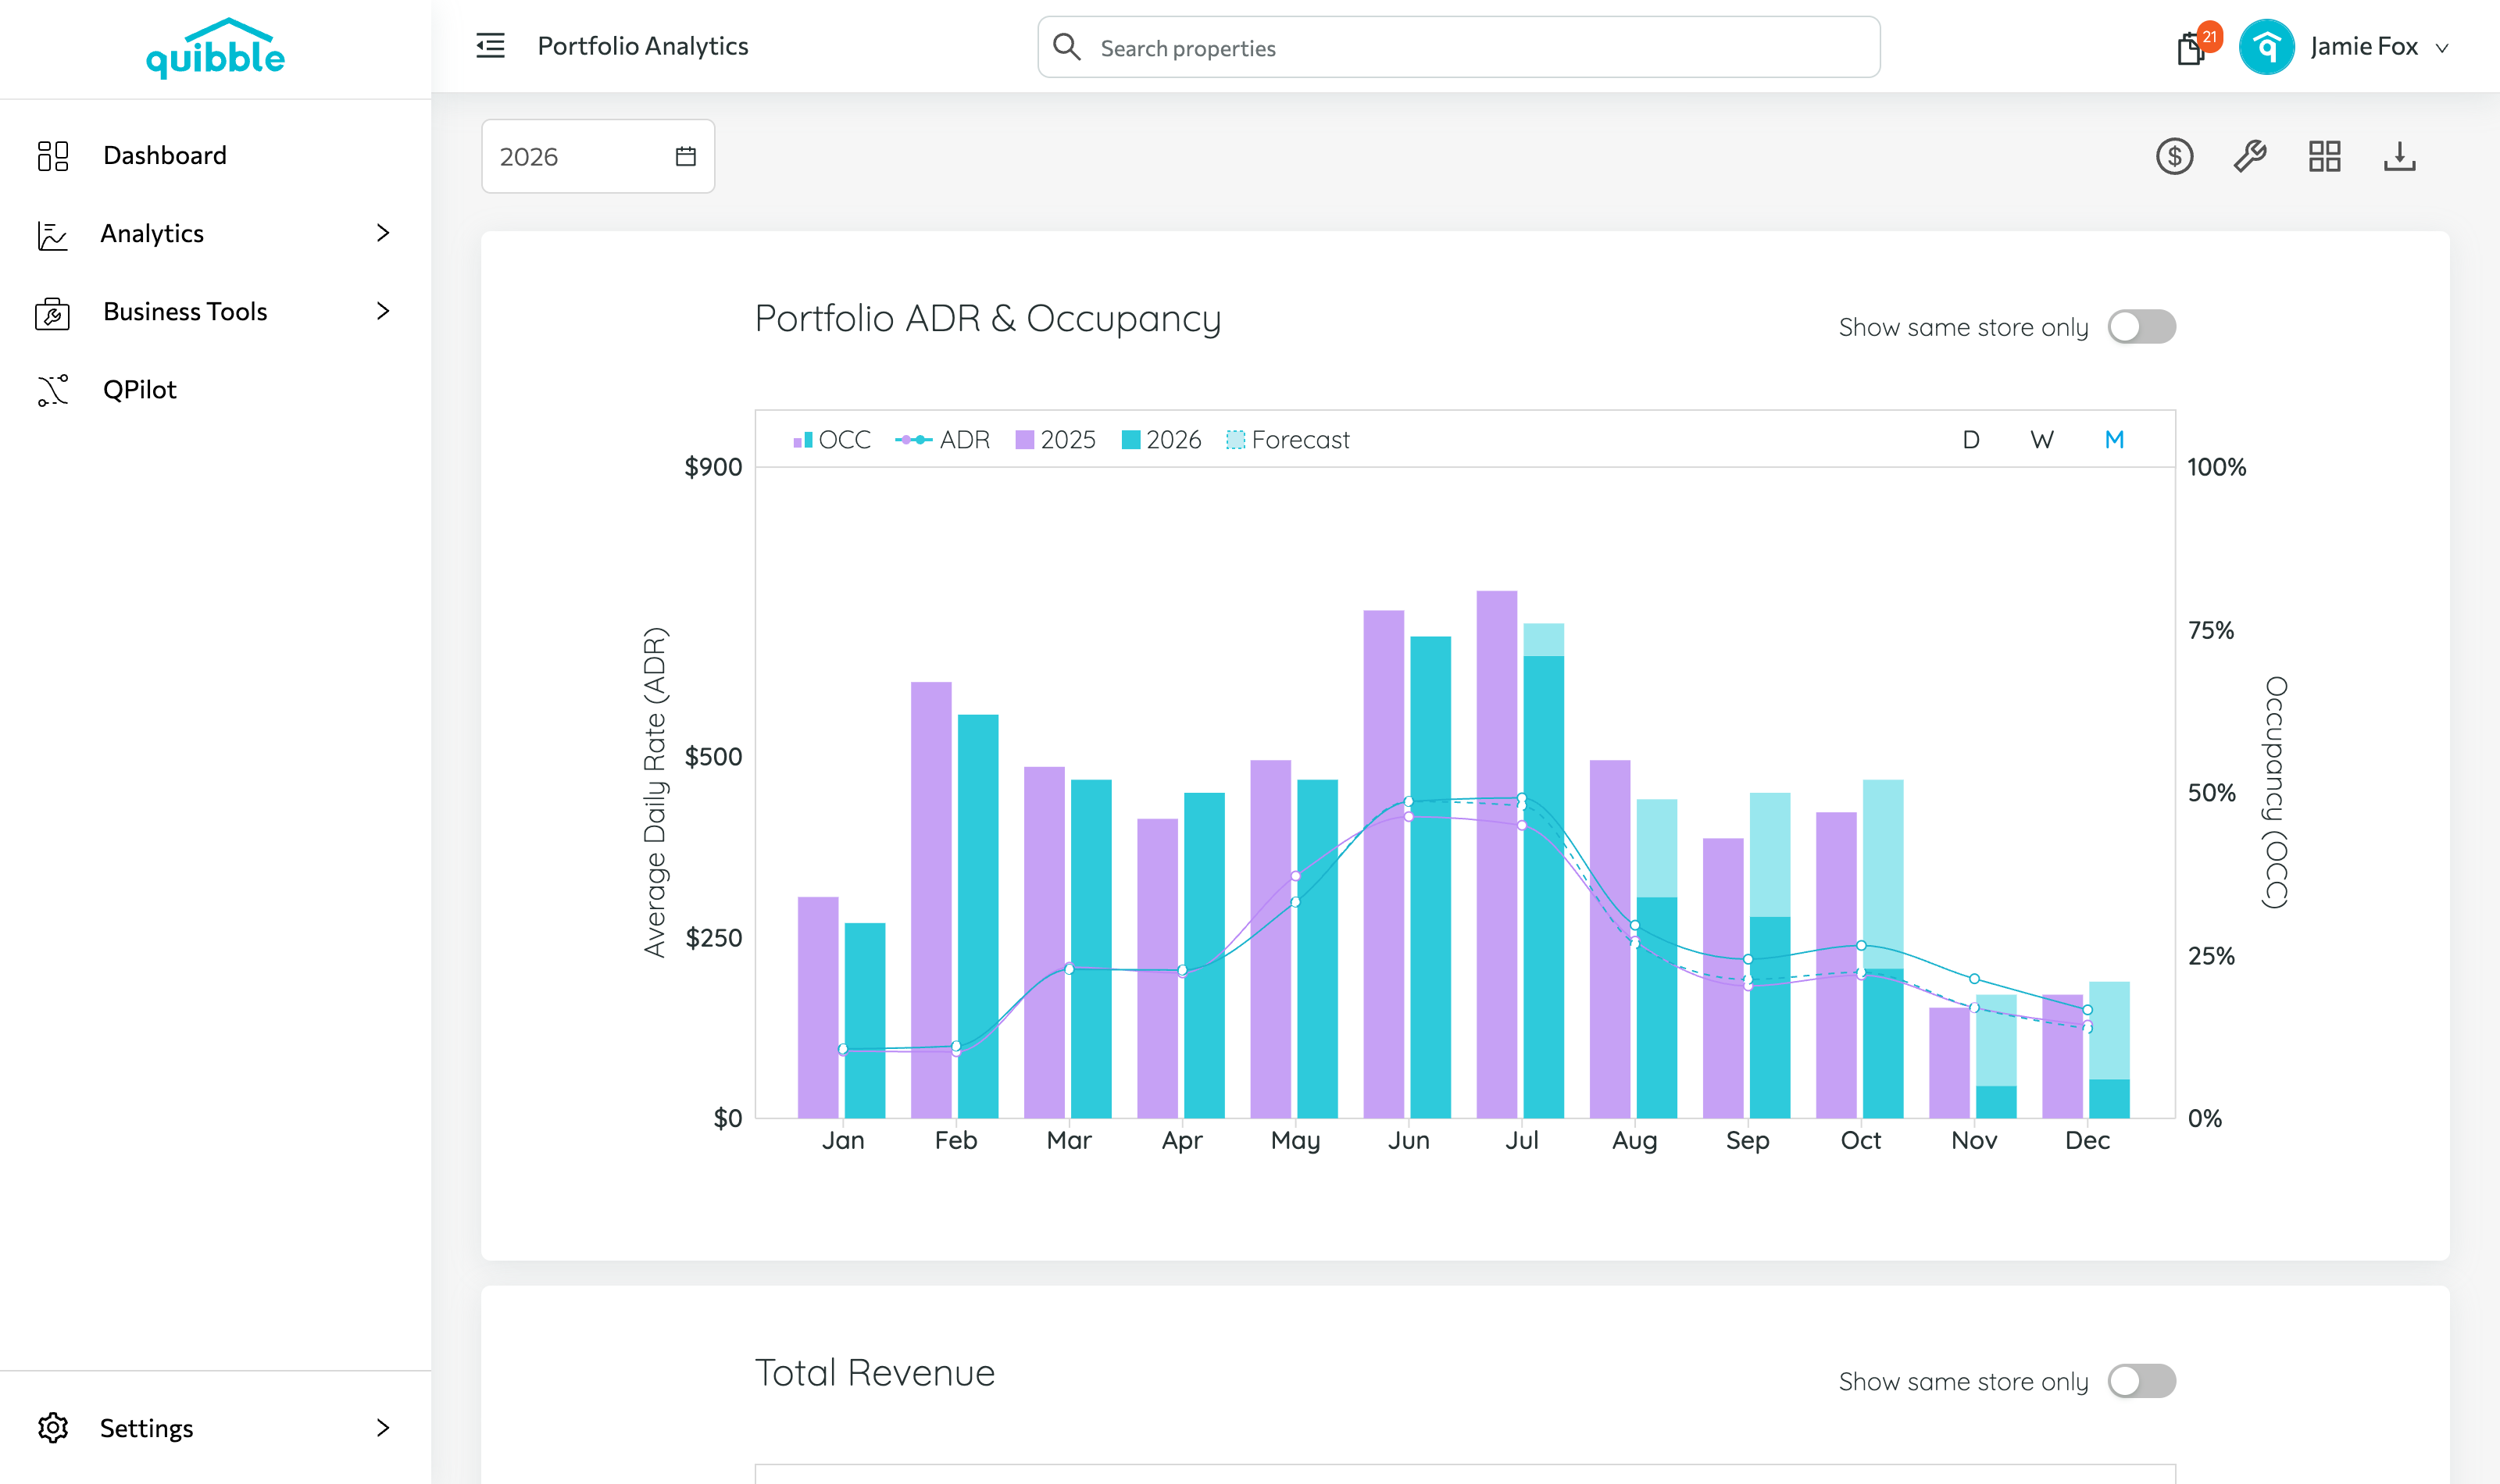
Total Revenue — overall portfolio revenue including rent and ancillary fees.
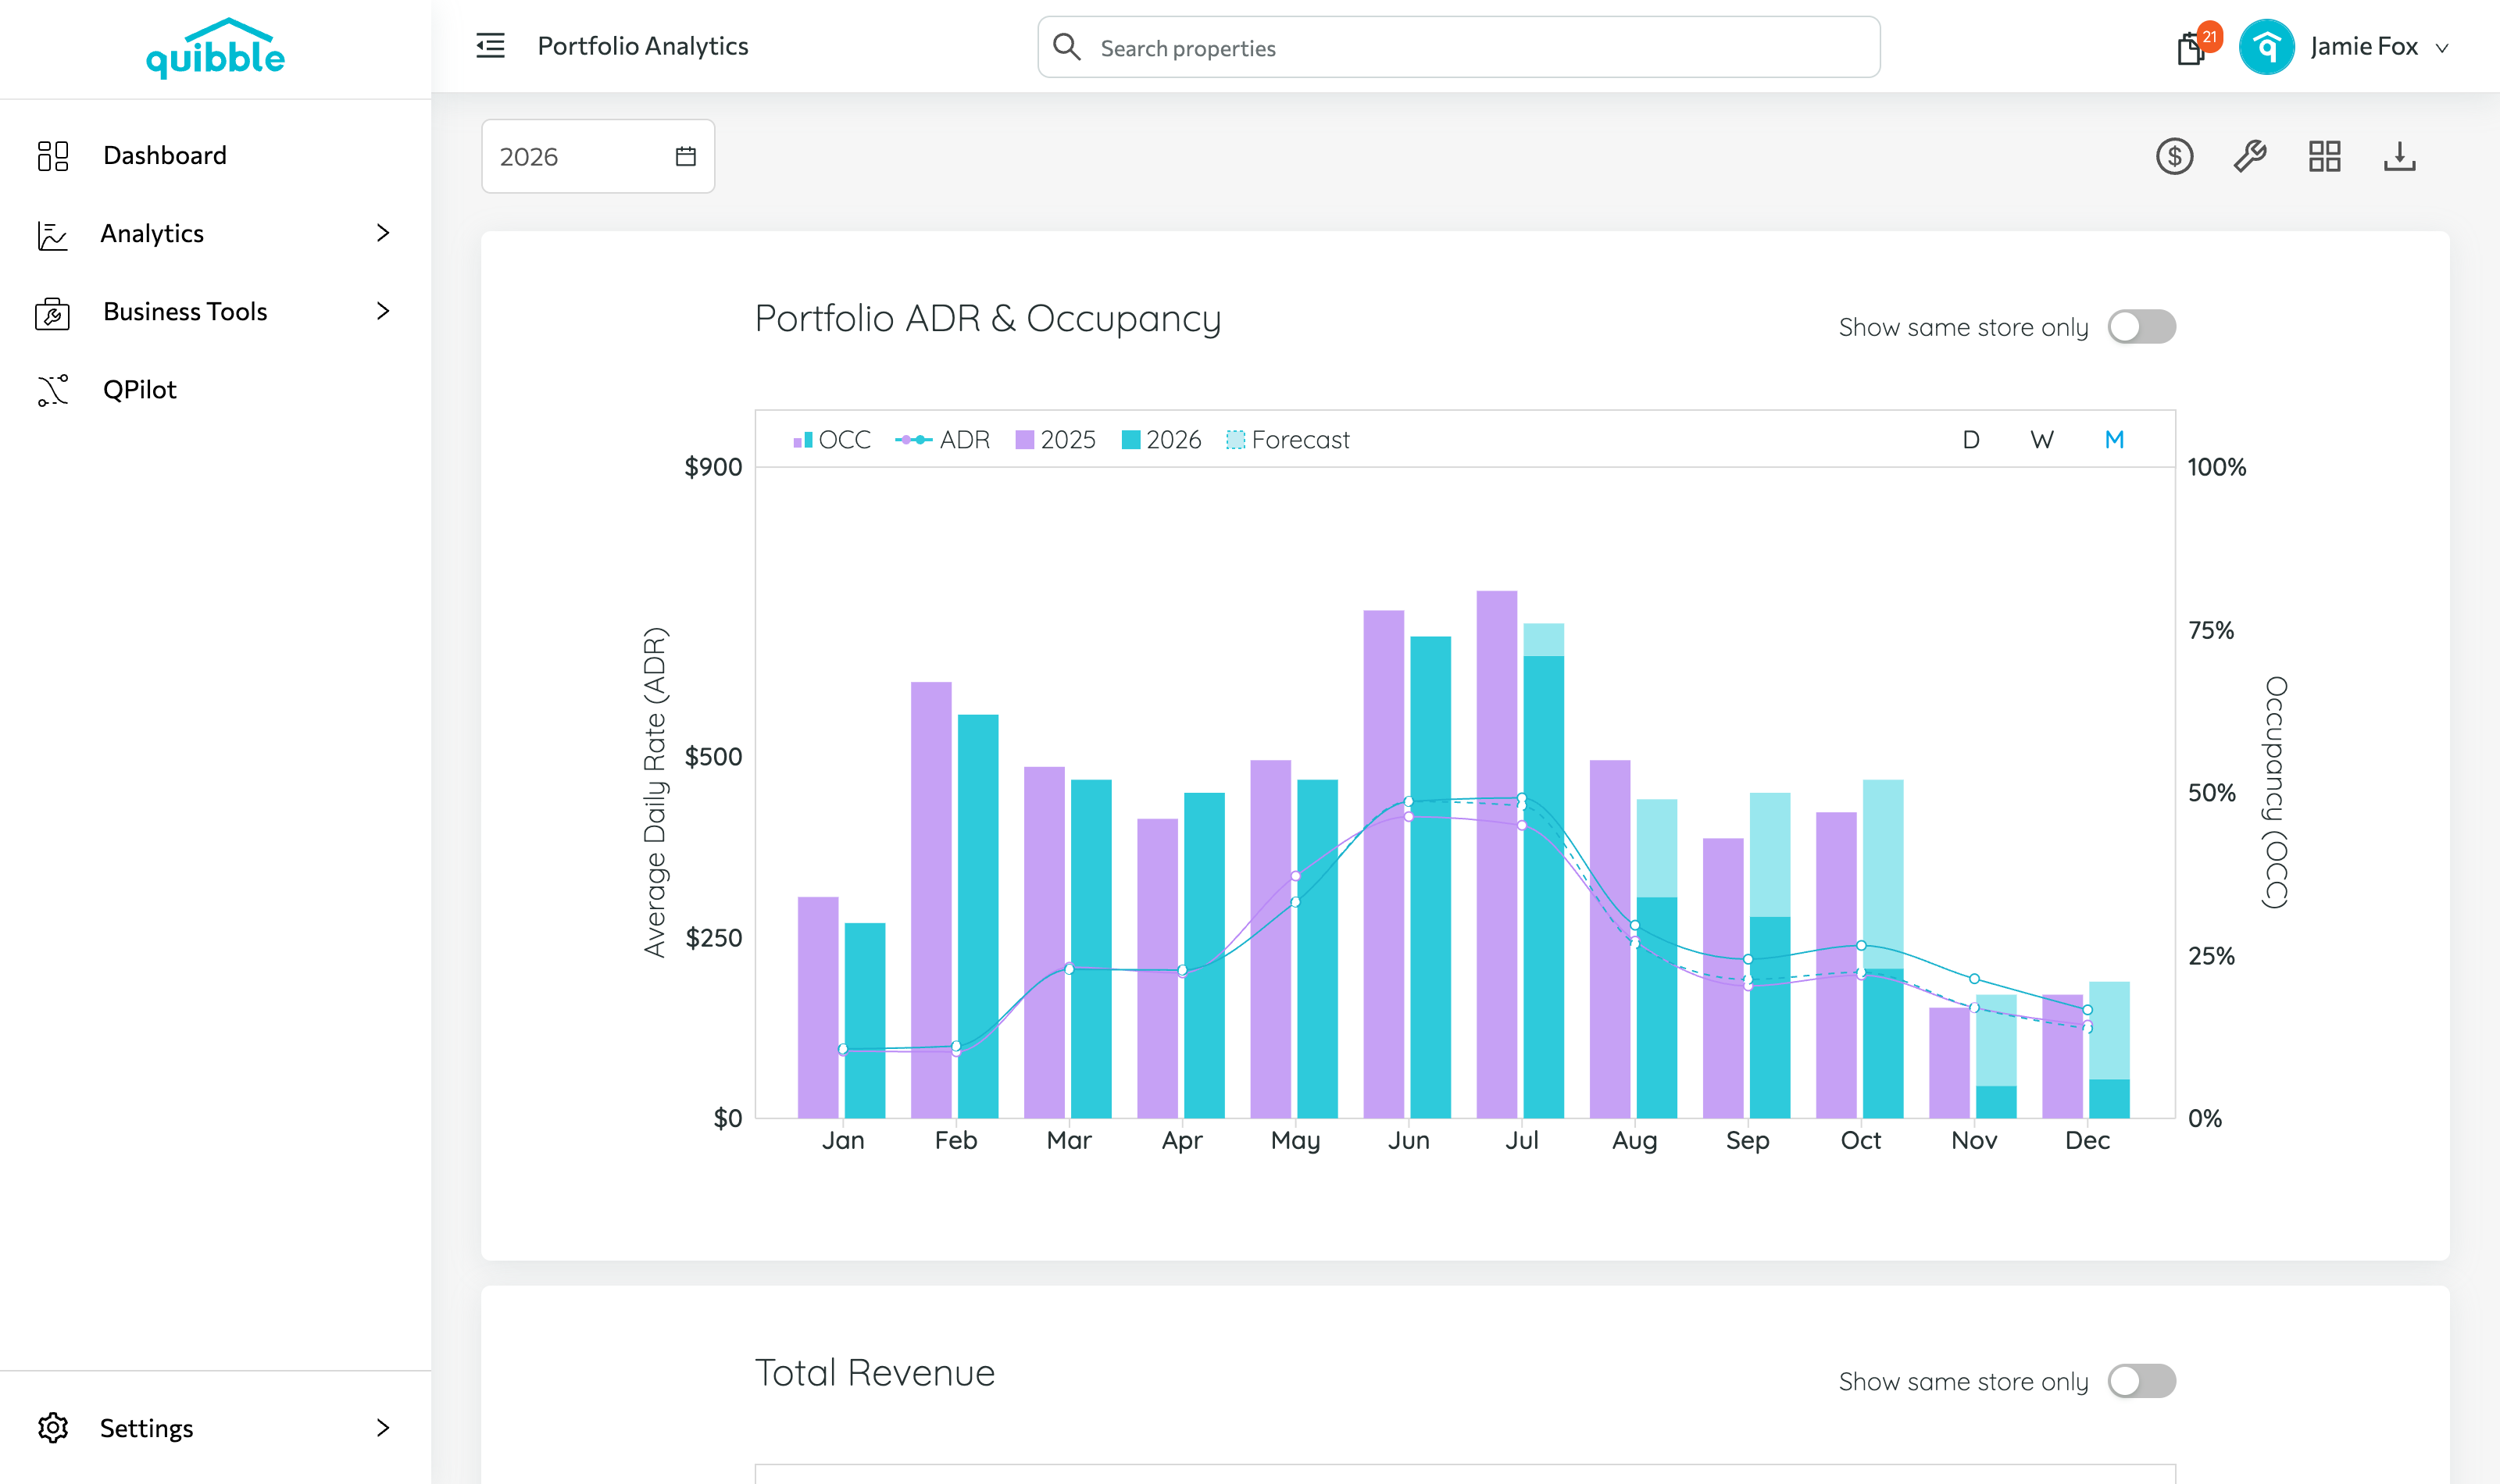
Bookings / Reservations — booking counts split by owner or guest bookings per year.
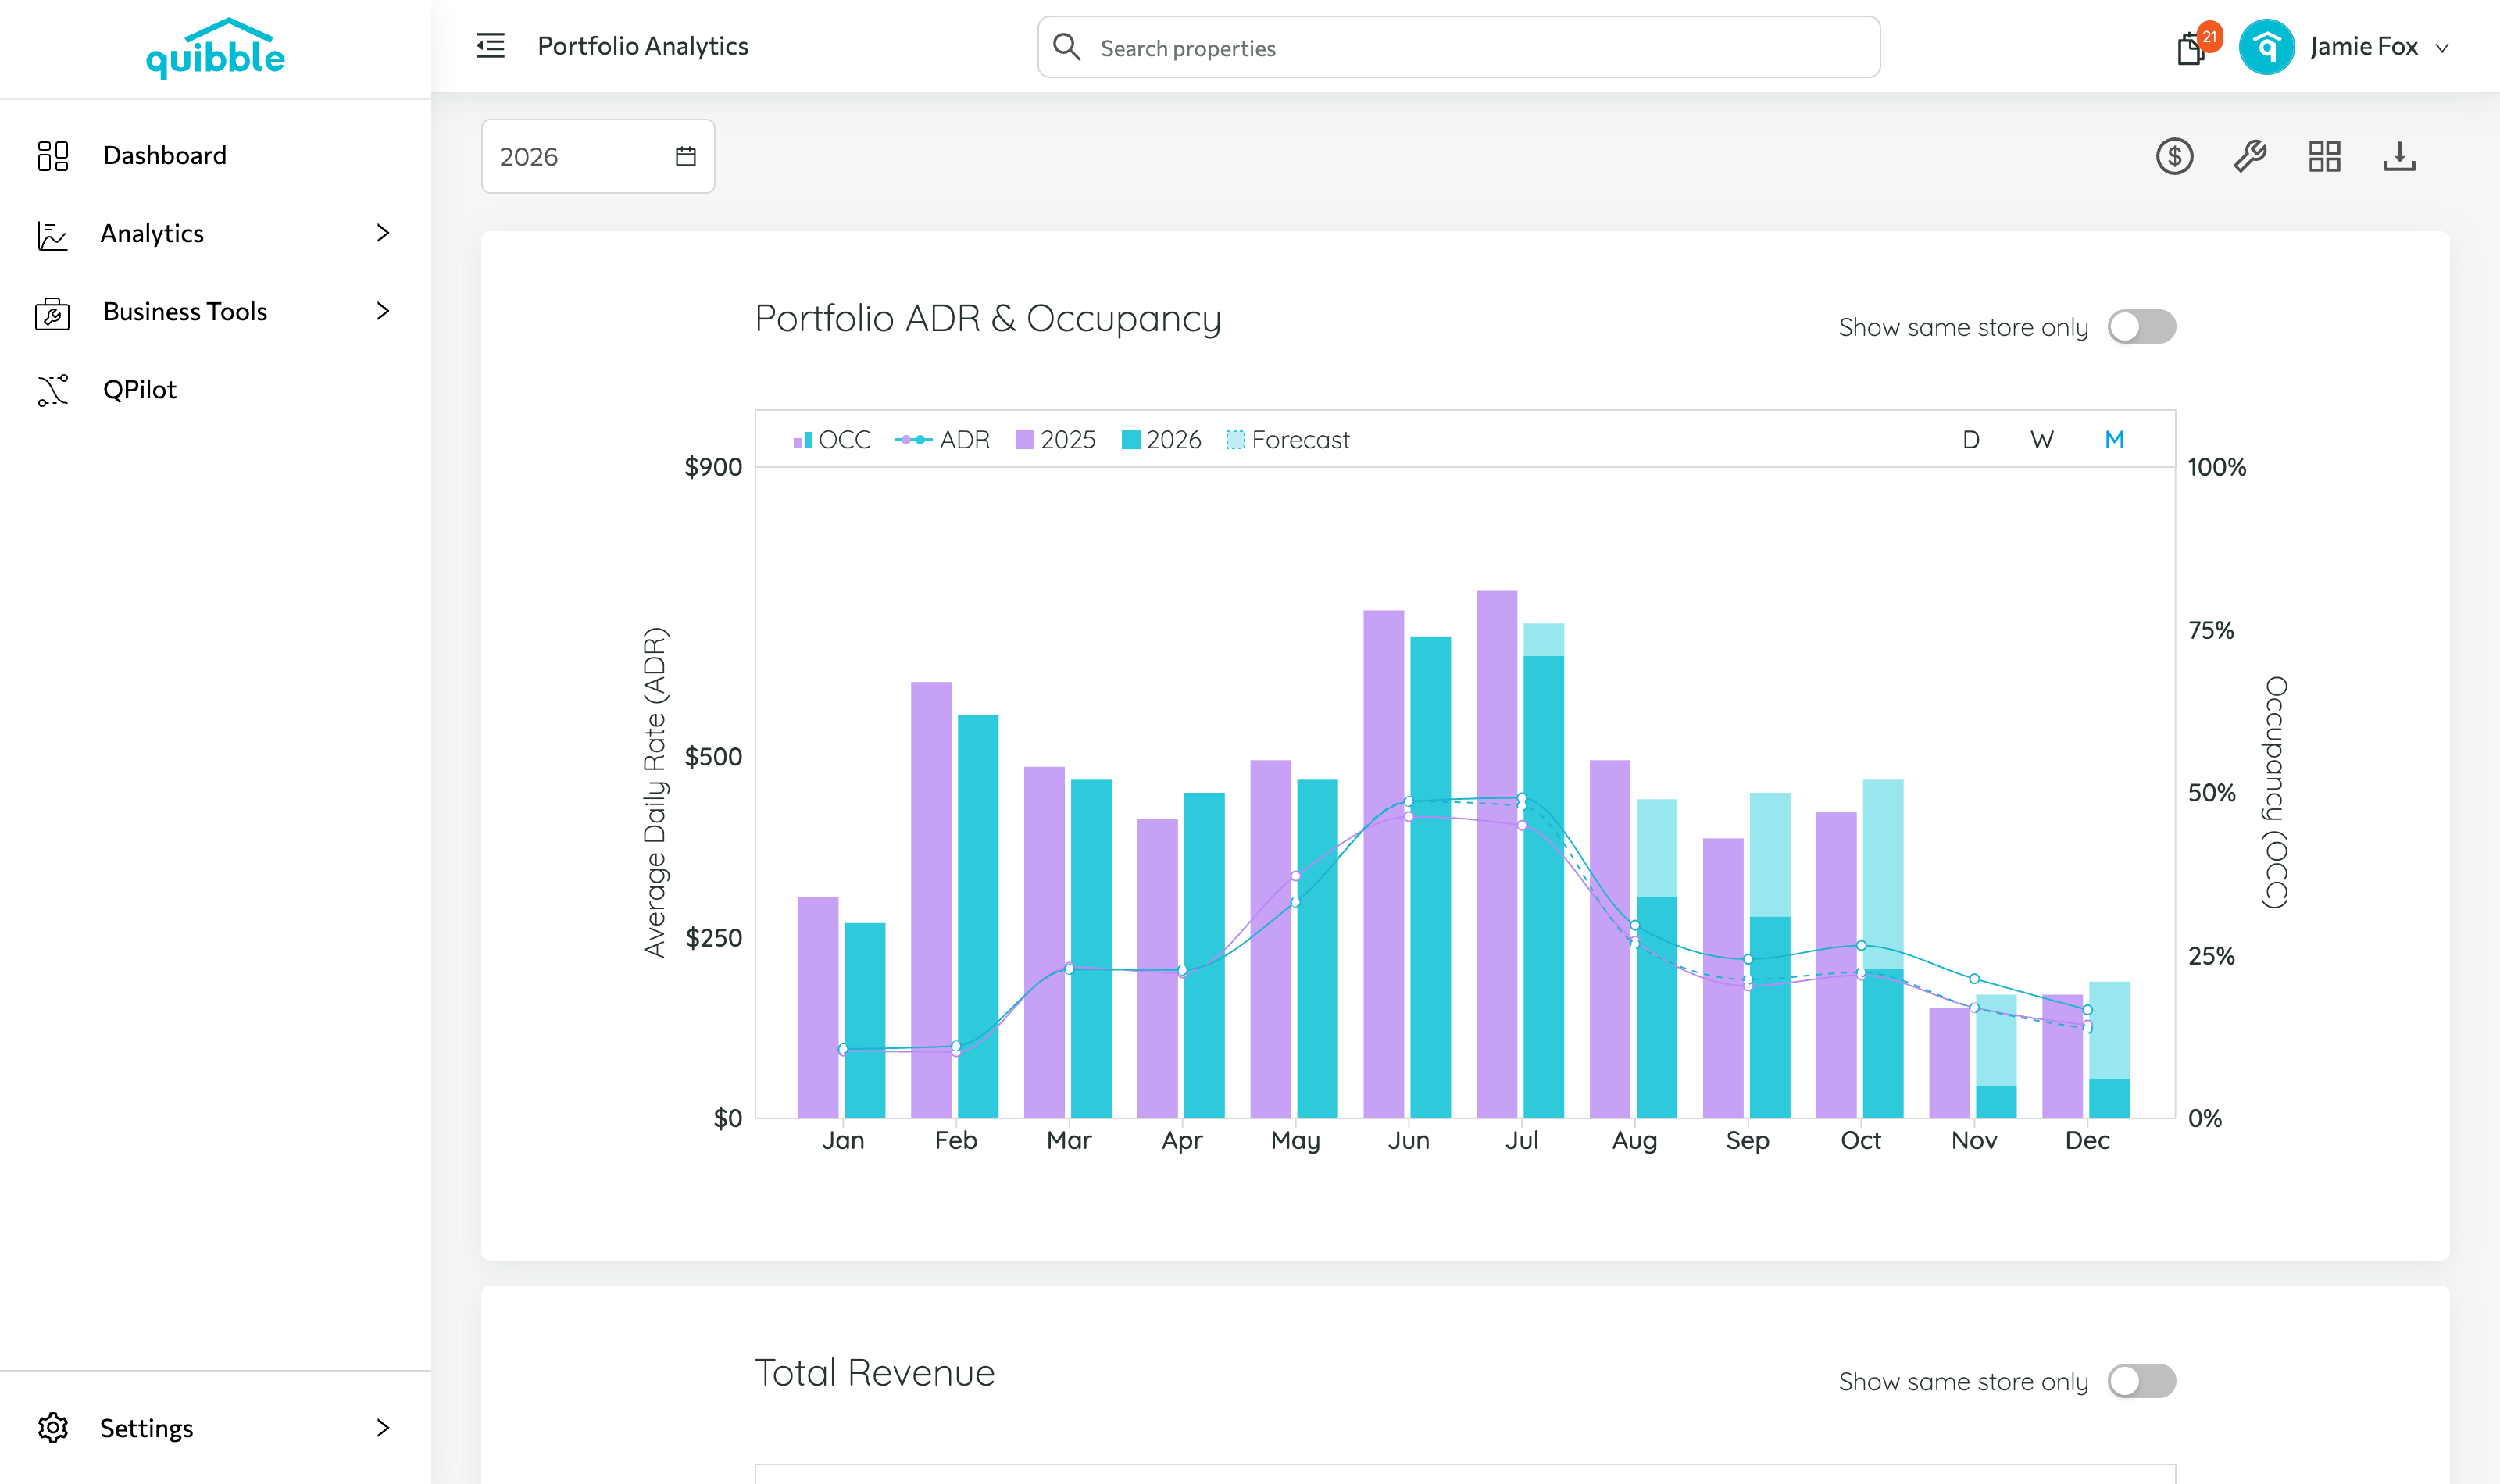
Length of Stay — the average guest stay length, to optimize booking strategy.
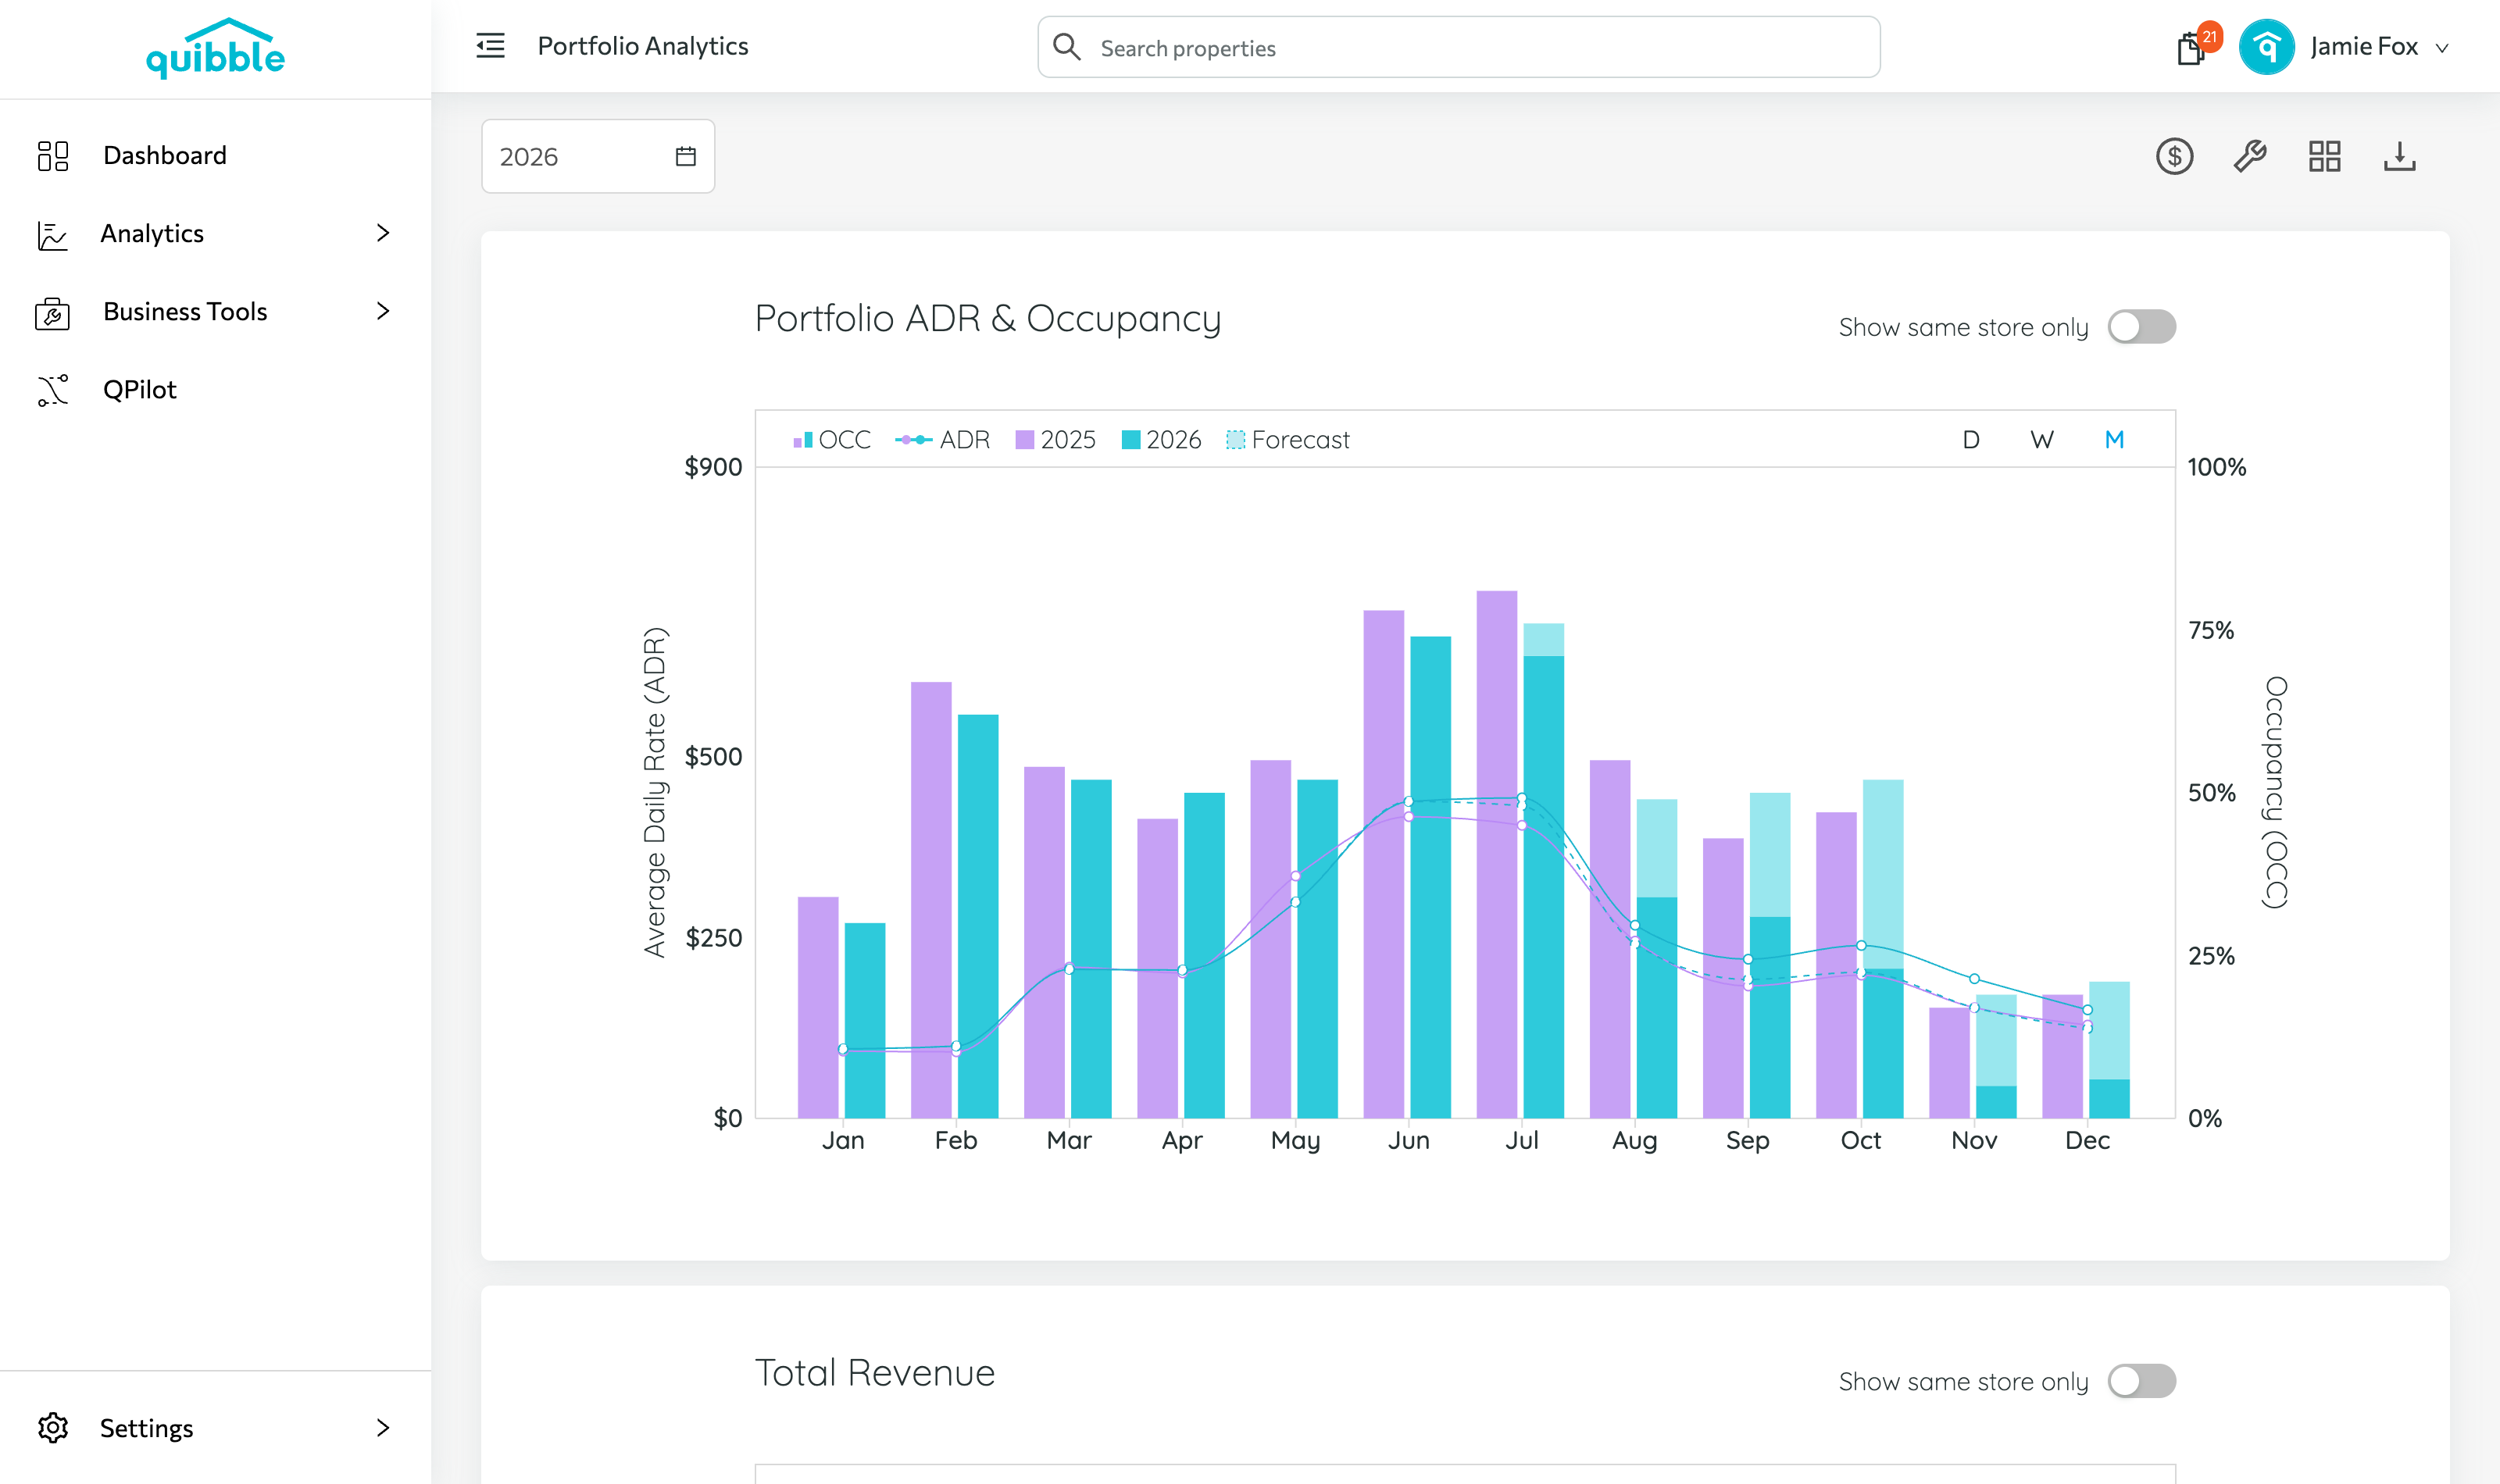
Lead Time — the gap between booking and check-in.
Inventory Growth — expansion and performance accounting for rents and price variability.
Active Properties — the number of active properties over time.