The only model that optimizes for revenue.
Dynamic pricing ≠ optimized pricing. Quibble comps like-kind units instead of nudging an arbitrary base price — solving directly for the rate the market will actually pay, every night.
Solves for revenue
Not a base price with rules — a model that searches for the rate that maximizes revenue on each night.
Like-kind comps
Prices against units genuinely similar to yours, not a regional average.
1.3× average uplift
Versus 1.1× for base-price tools and 1.0× for manual.
A comp set you can actually read
The engine builds a comp set of genuinely similar units — not studios five miles inland — grades it for trading, confidence, fit, and depth, and shows you every unit in it. When your rate moves, you can see exactly why.
Past dynamic, into optimized
Reacting to demand is table stakes. Quibble reads how your comps price into events, how fast they discount, where they hold — and solves for the rate the market will pay on every night. Small, consistent gains compound across a portfolio and a season.
Warm up silently, go live with confidence
Silent mode runs the full engine without touching your channels, so you can watch it price before you hand it the keys. Set a target, keep your floors and ceilings — the engine respects every guardrail.
How the model works
Seven parts, in the order the model uses them.
Expected revenue = price × booking probability
Dynamic pricing changes price over time by rules and signals such as season, day of week, lead time, and occupancy. Revenue management goes a step further: for each night it sets the price where expected revenue, the price times the probability the night books at that price, is highest. The price is the output of the optimization. Base-price tools multiply one reference price by adjustments; they do not estimate where each night’s revenue-maximizing price is.
A discrete choice model
The method is discrete choice (multinomial logit), developed largely by Daniel McFadden, who shared the 2000 Nobel Memorial Prize in Economic Sciences for theory and methods for analyzing discrete choice. The science is in estimating booking probability accurately. Once the probability is known, choosing the price is arithmetic.
Comp sets matched the way a guest compares
Quibble matches comps the way a guest would compare them: it looks within a radius starting at 10 km, takes same-bedroom listings first and backfills, keeps listings within a 75–200% rate band, and scores candidates on bedrooms, rate and distance. About 30 are attached to each listing, and for each night the 10 best matches that are still available go into the model, because shoppers screen down to a small consideration set of about 10 rather than weighing hundreds. Comp rates are all-in, fees included, and are compared with the guest-facing price. On the Comp Model tab you can replace a comp only when it is flagged Needs revision: Quibble offers up to 5 candidates and the replacement reprices on the next nightly run. Adding a listing by URL is a read-only inquiry that shows how it compares without adding it to the set. Comp Model → Simulator shows your share of a night, the best comps, and what-ifs.
Thin data: predict the set, then split it
When one listing has thin data, Quibble predicts total demand across the small comp set and splits it by choice probability: expected bookings = set demand × your choice probability.
Bookable Search™ sets seasonality
Bookable Search™ counts only searches that ended in a purchase: your listing appeared in the search and the shopper booked something very similar. Predicted bookings across the comp set set the seasons. Revenue managers do not hand-pick them.
Market share is a probability
Market share is the probability that the next qualified shopper, someone who will book something in the set, picks your listing. Price, amenities, ratings, reviews, and photos all move it.
Your controls: multipliers first, overrides last
Price = clamp(optimized × (1 + Σ multipliers ÷ 100), floor, max), unless an override is set. Multipliers come first and add as percentage points. Floors and a max exist for owner minimums, protection under large negative adjustments, and holiday or peak-season dates; the model rarely prices below the lowest comp. An override pins an exact rate and is the last resort, for when a client explicitly wants a fixed rate. The better the annual rent target is set, the fewer controls a listing needs.
“Comping like-kind units rather than an arbitrary base price is a game changer.” — Mike Springer, Book Nola
The rest of the OS
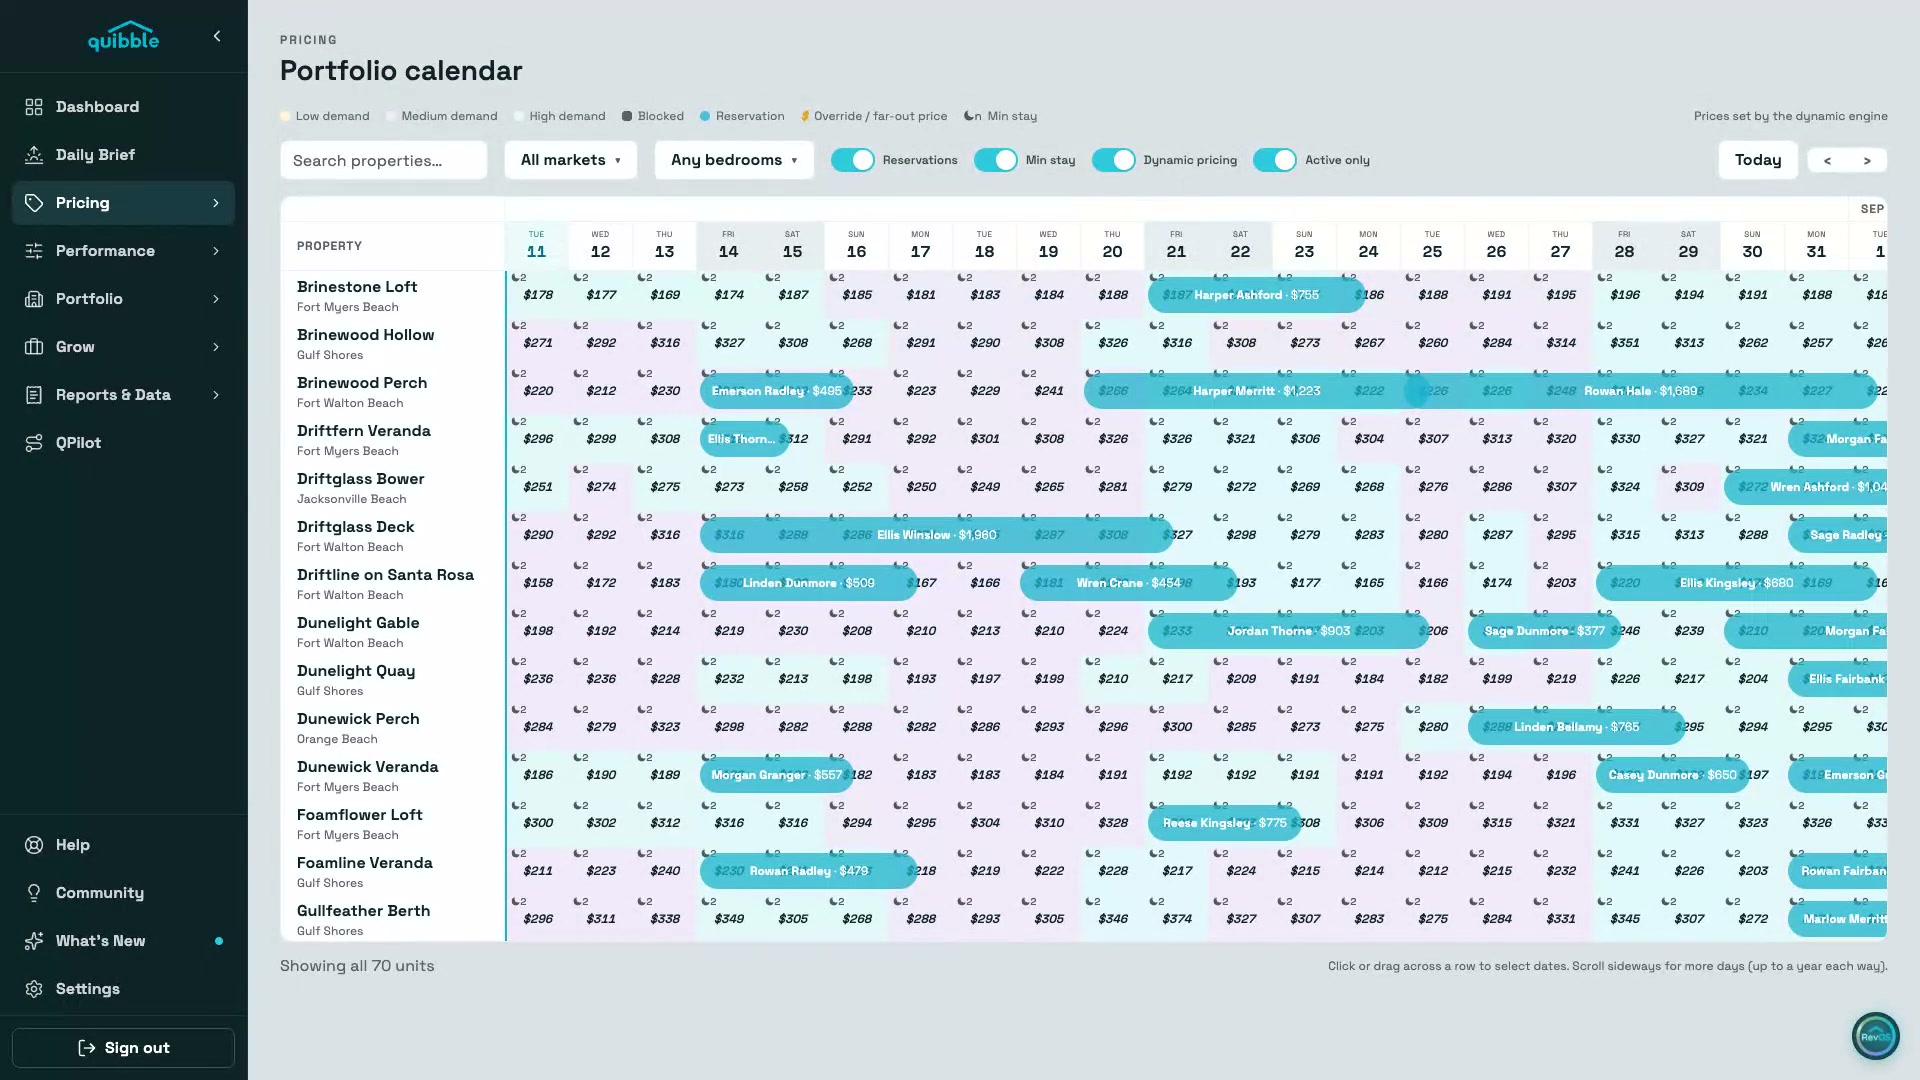
Portfolio Calendar
The whole book on one screen — engine-set prices, reservations, min-stay, and demand painted onto every night, up to a year each way.
Explore →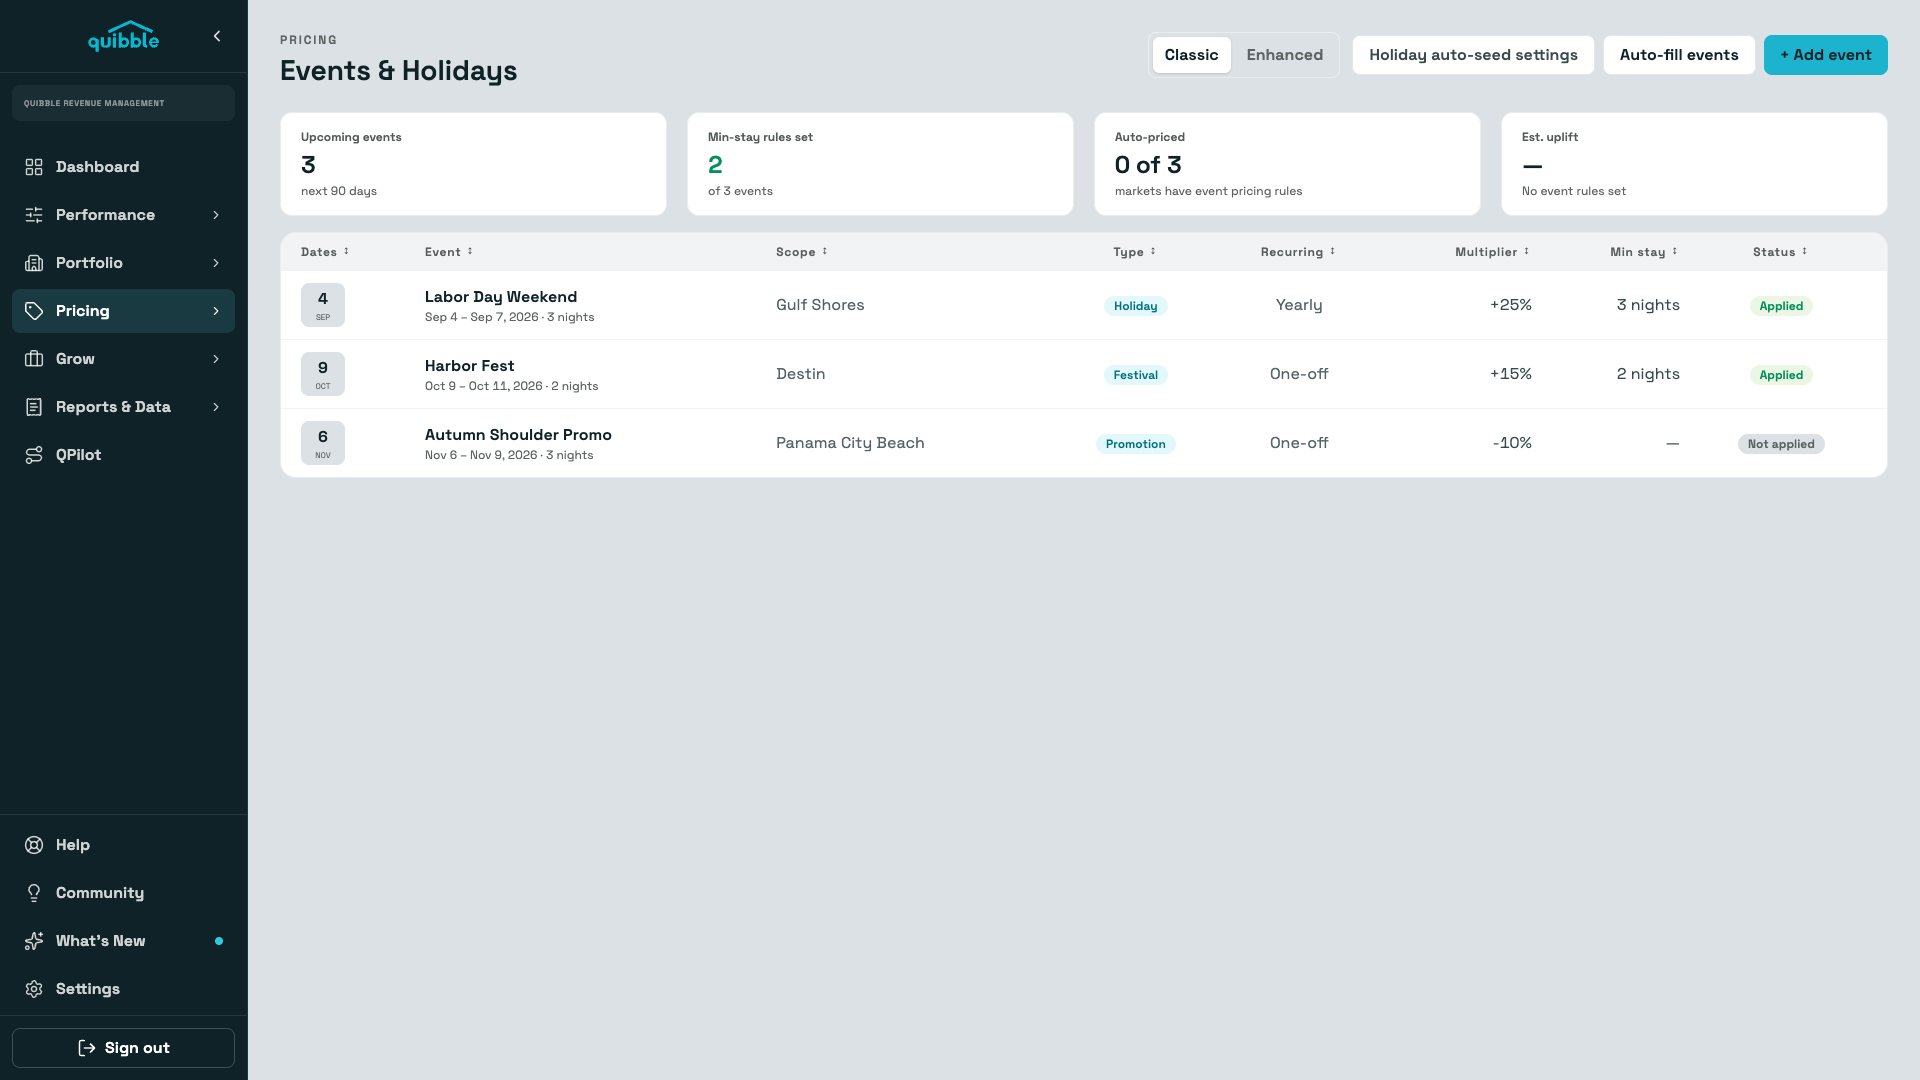
Events & Holidays
Local events detected and priced automatically — with last year’s performance next to this year’s suggestion, so every uplift is a decision, not a guess.
Explore →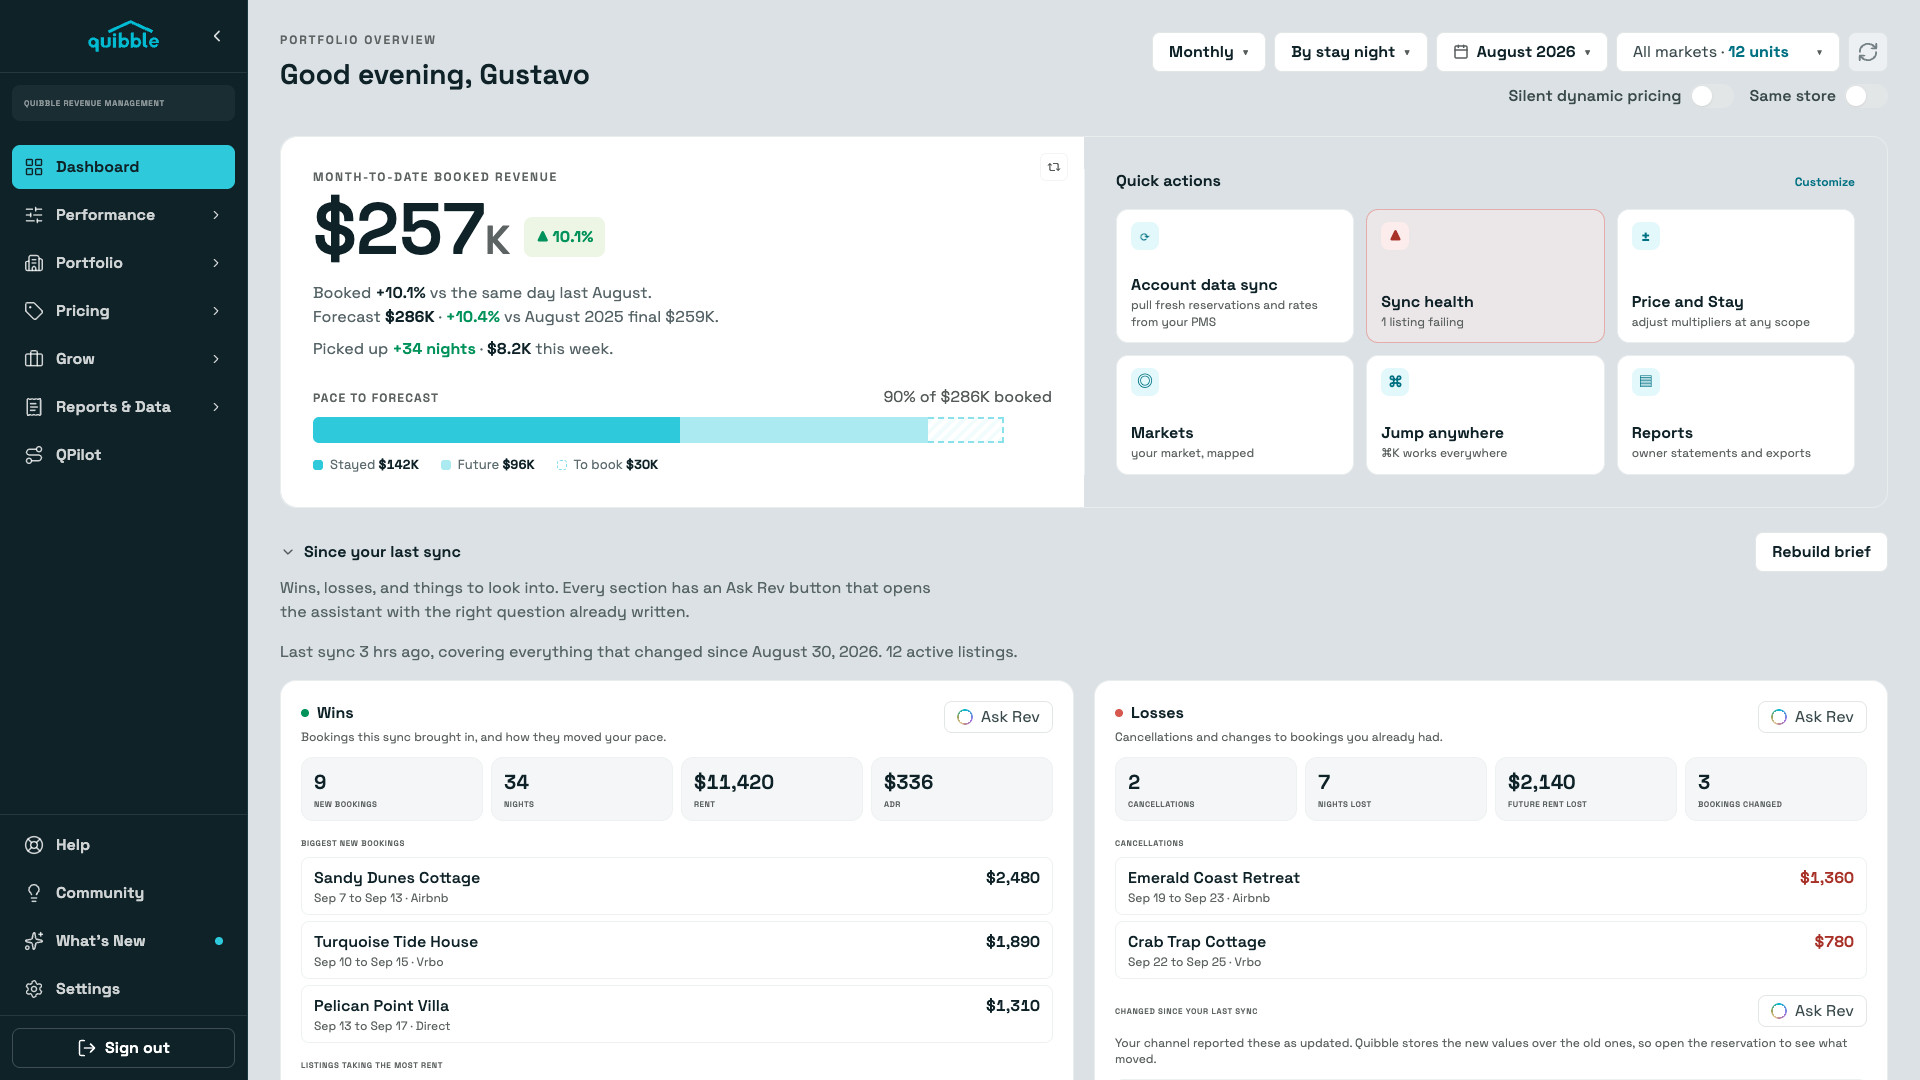
Insights & Daily Brief
A dashboard that reads your portfolio for you every morning — pace against forecast, wins and losses since the last sync, and the units that need attention today.
Explore →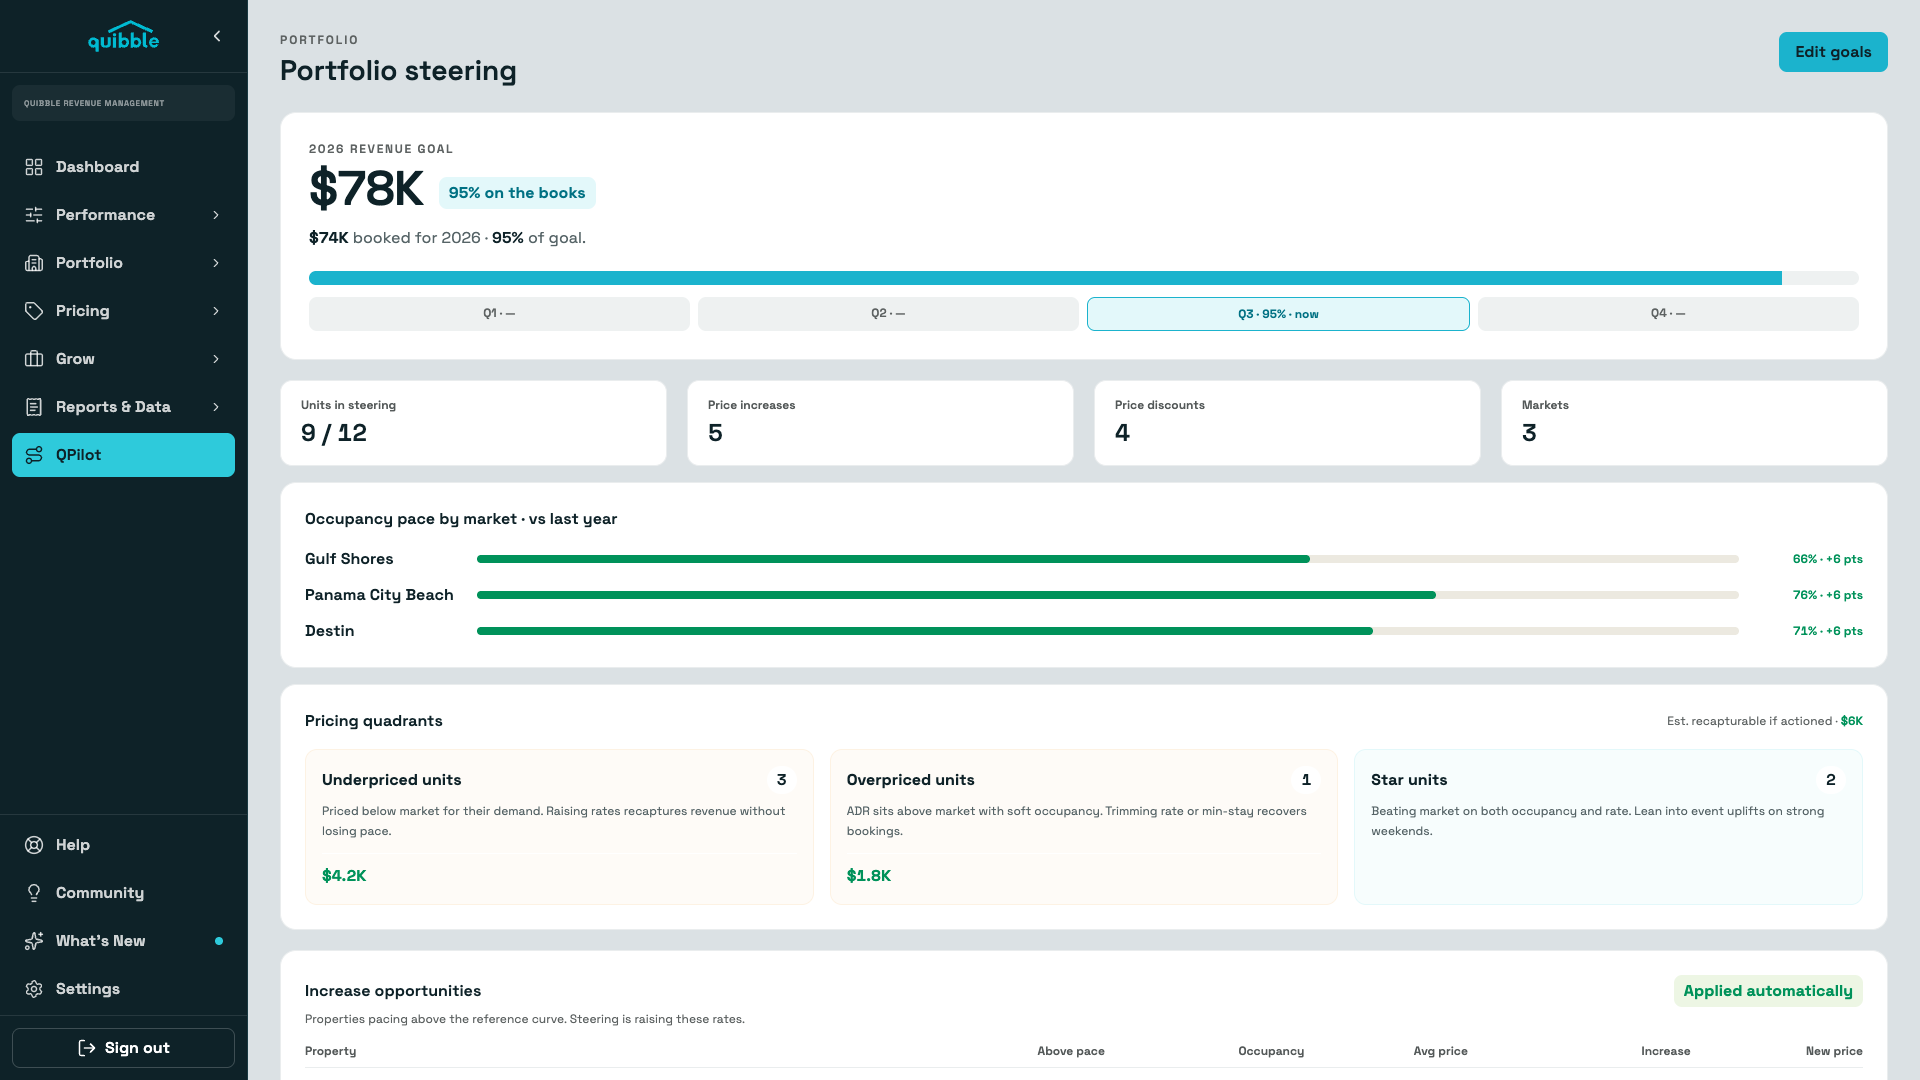
QPilot
Give QPilot a revenue goal and it paces the portfolio toward it — quantifying what’s recapturable, steering prices inside your rules, and flagging the units that need a human.
Explore →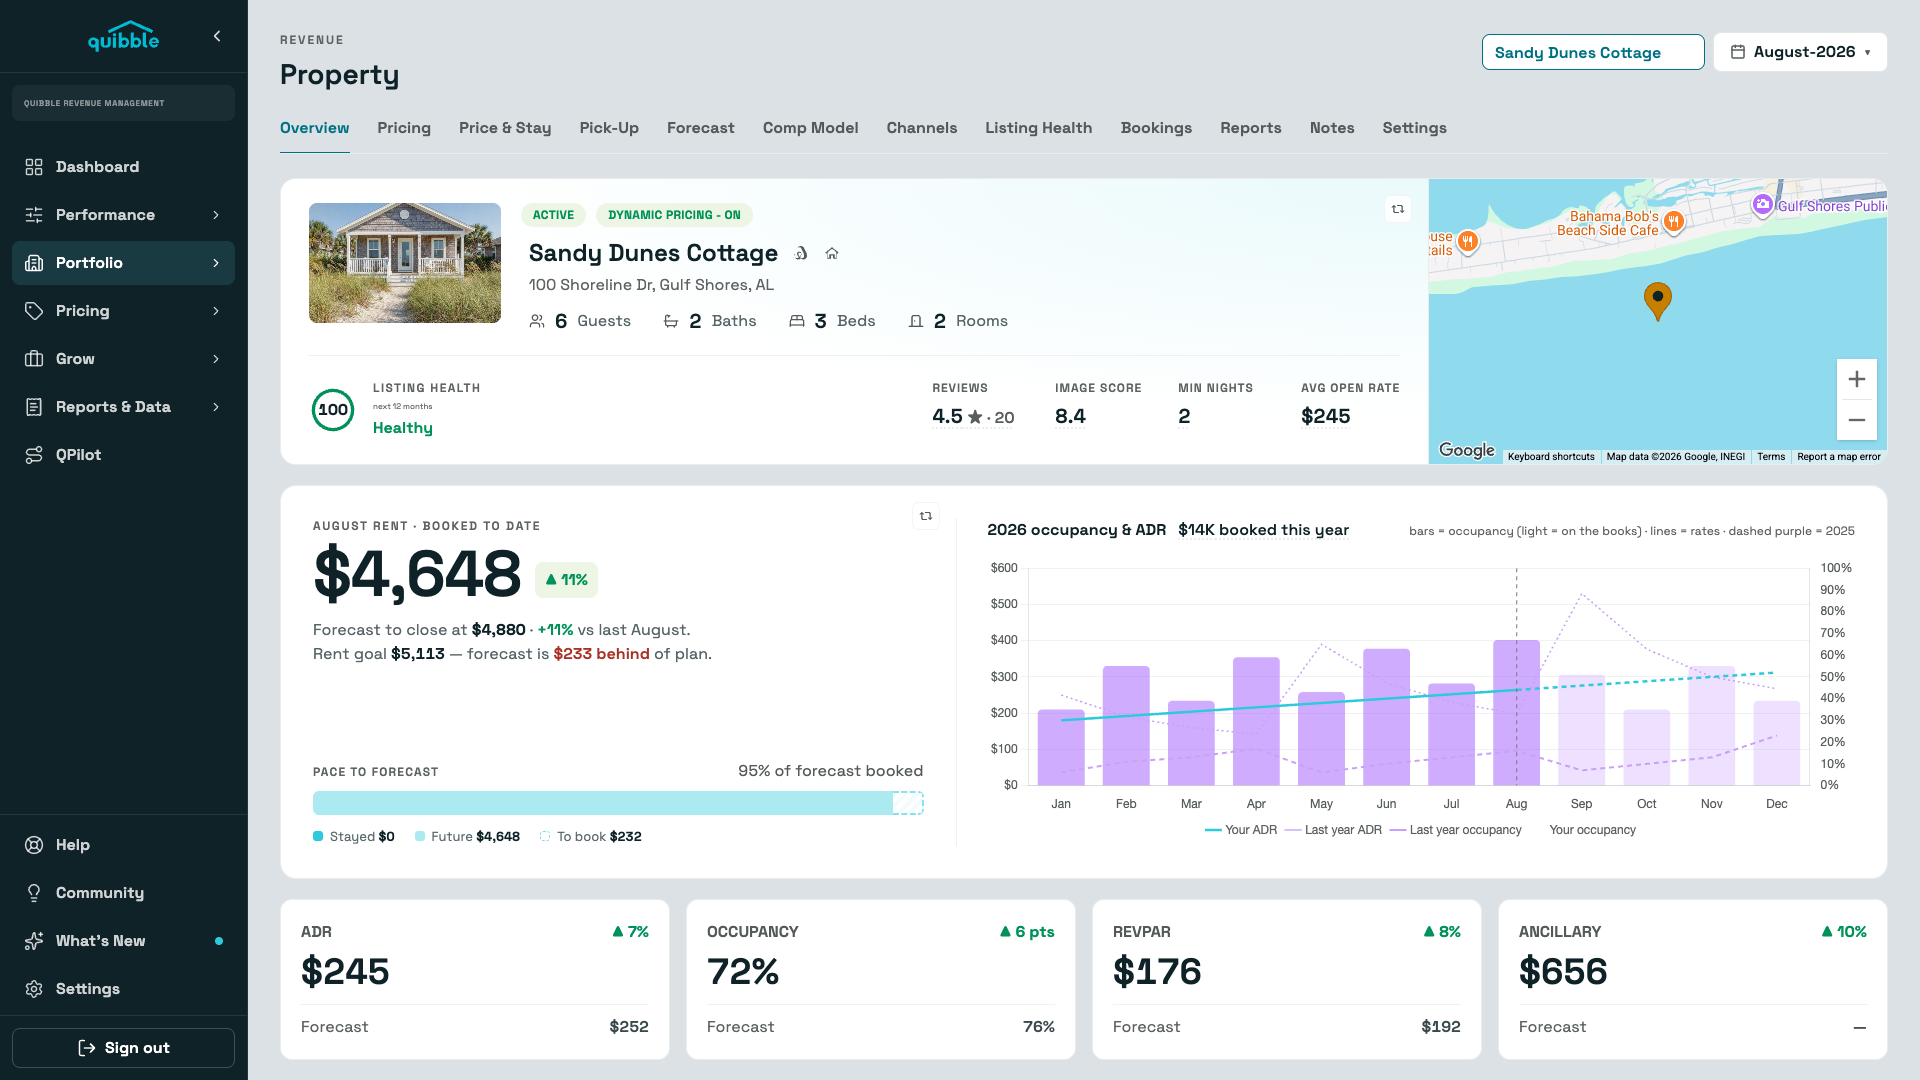
Properties
The whole portfolio ranked by occupancy gap — and a property page with the booking curve, comps, channels, listing health, and pricing history behind every number.
Explore →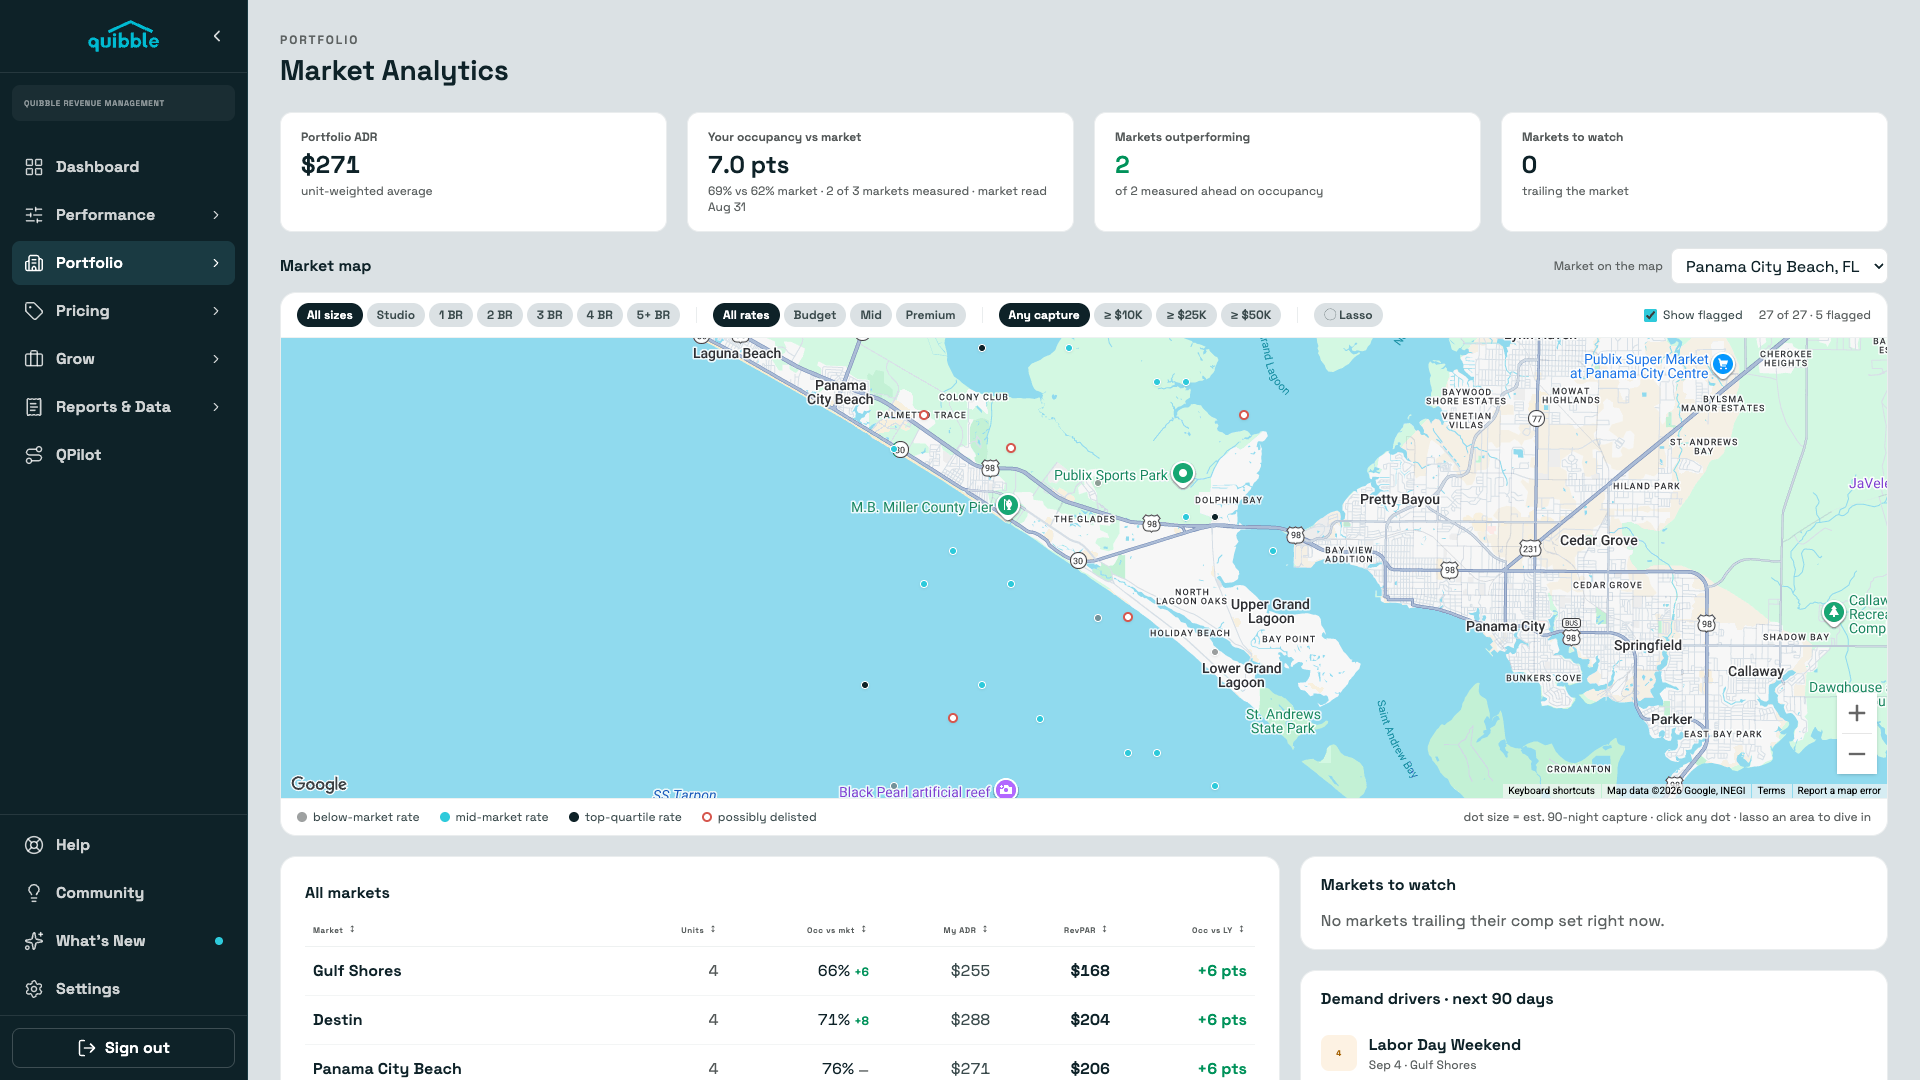
Market Analytics
Your occupancy and ADR against every market you operate in — with the tracked listings behind the comparison on a map, so a soft month gets a diagnosis instead of a guess.
Explore →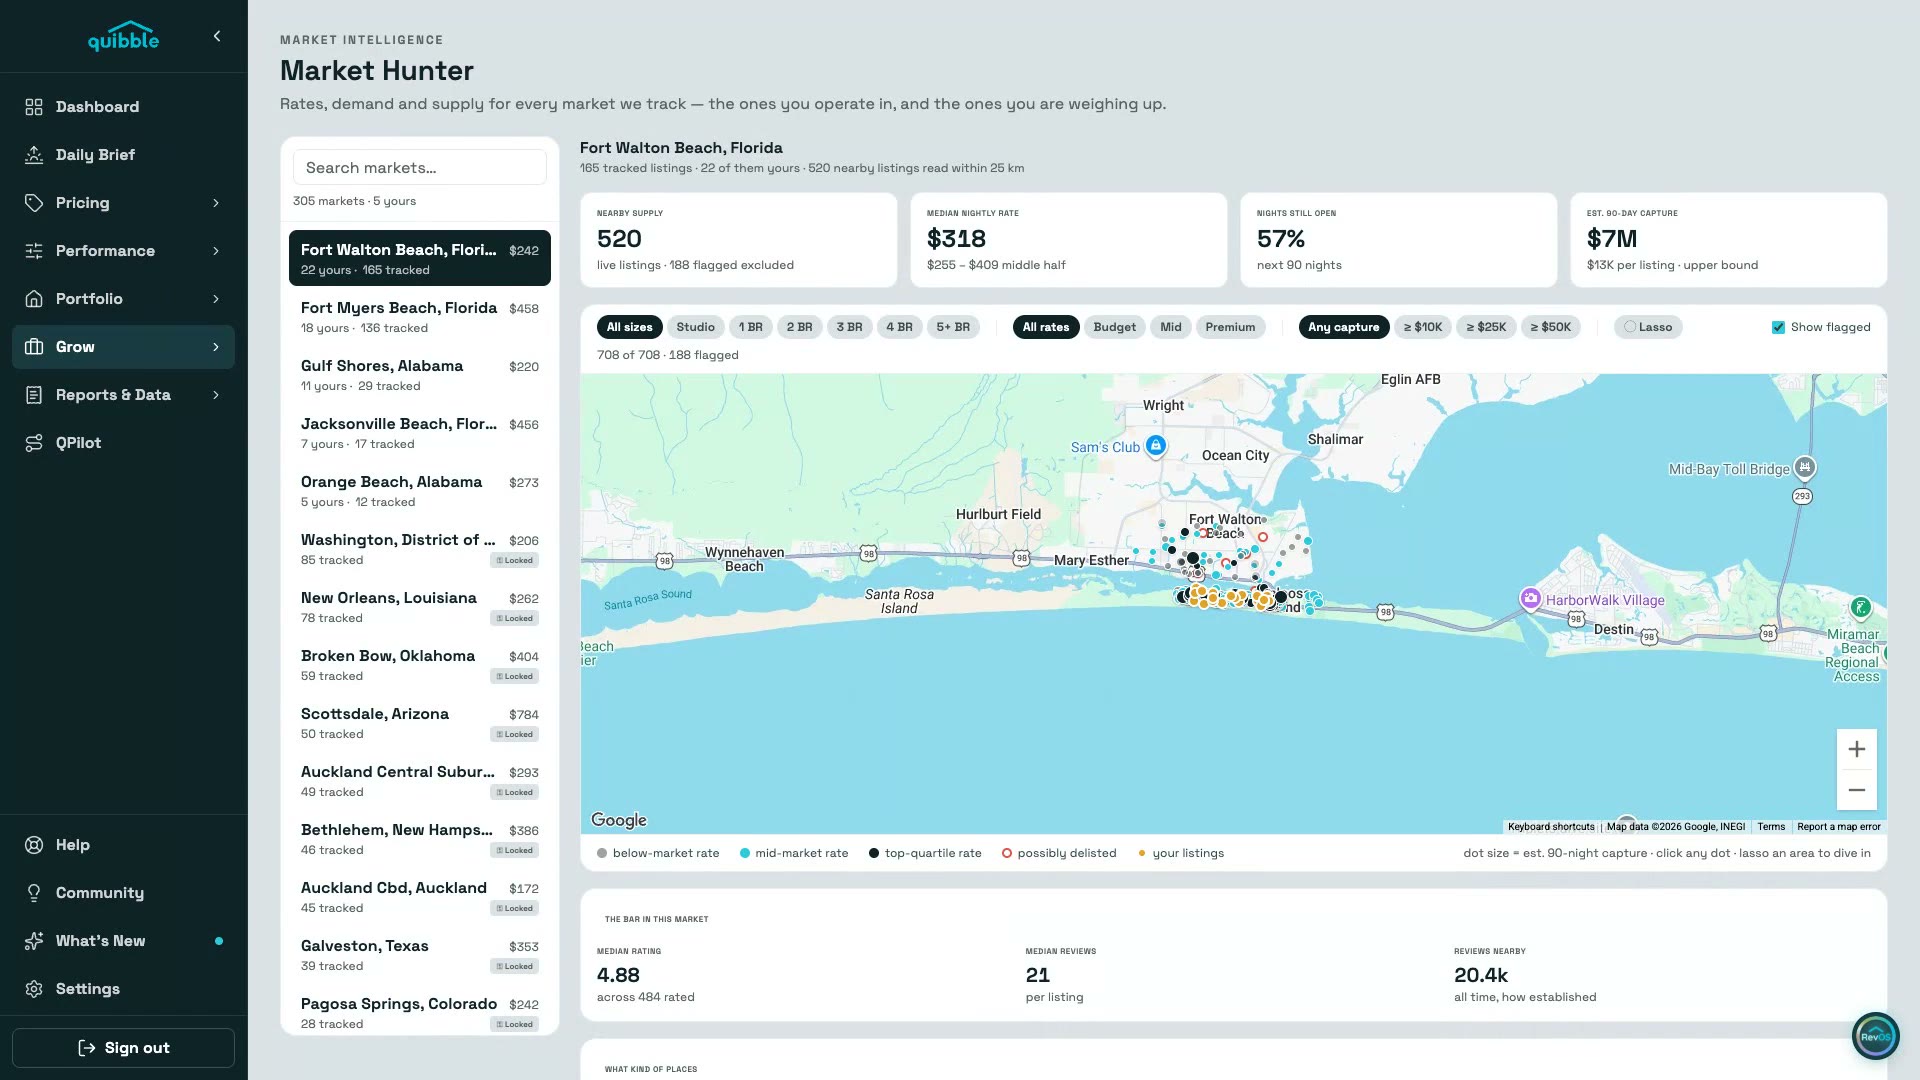
Market Hunter
The markets you operate in and the ones you’re weighing up — live supply, achievable rates, open nights, and the bar you’d have to clear, on a map you can lasso.
Explore →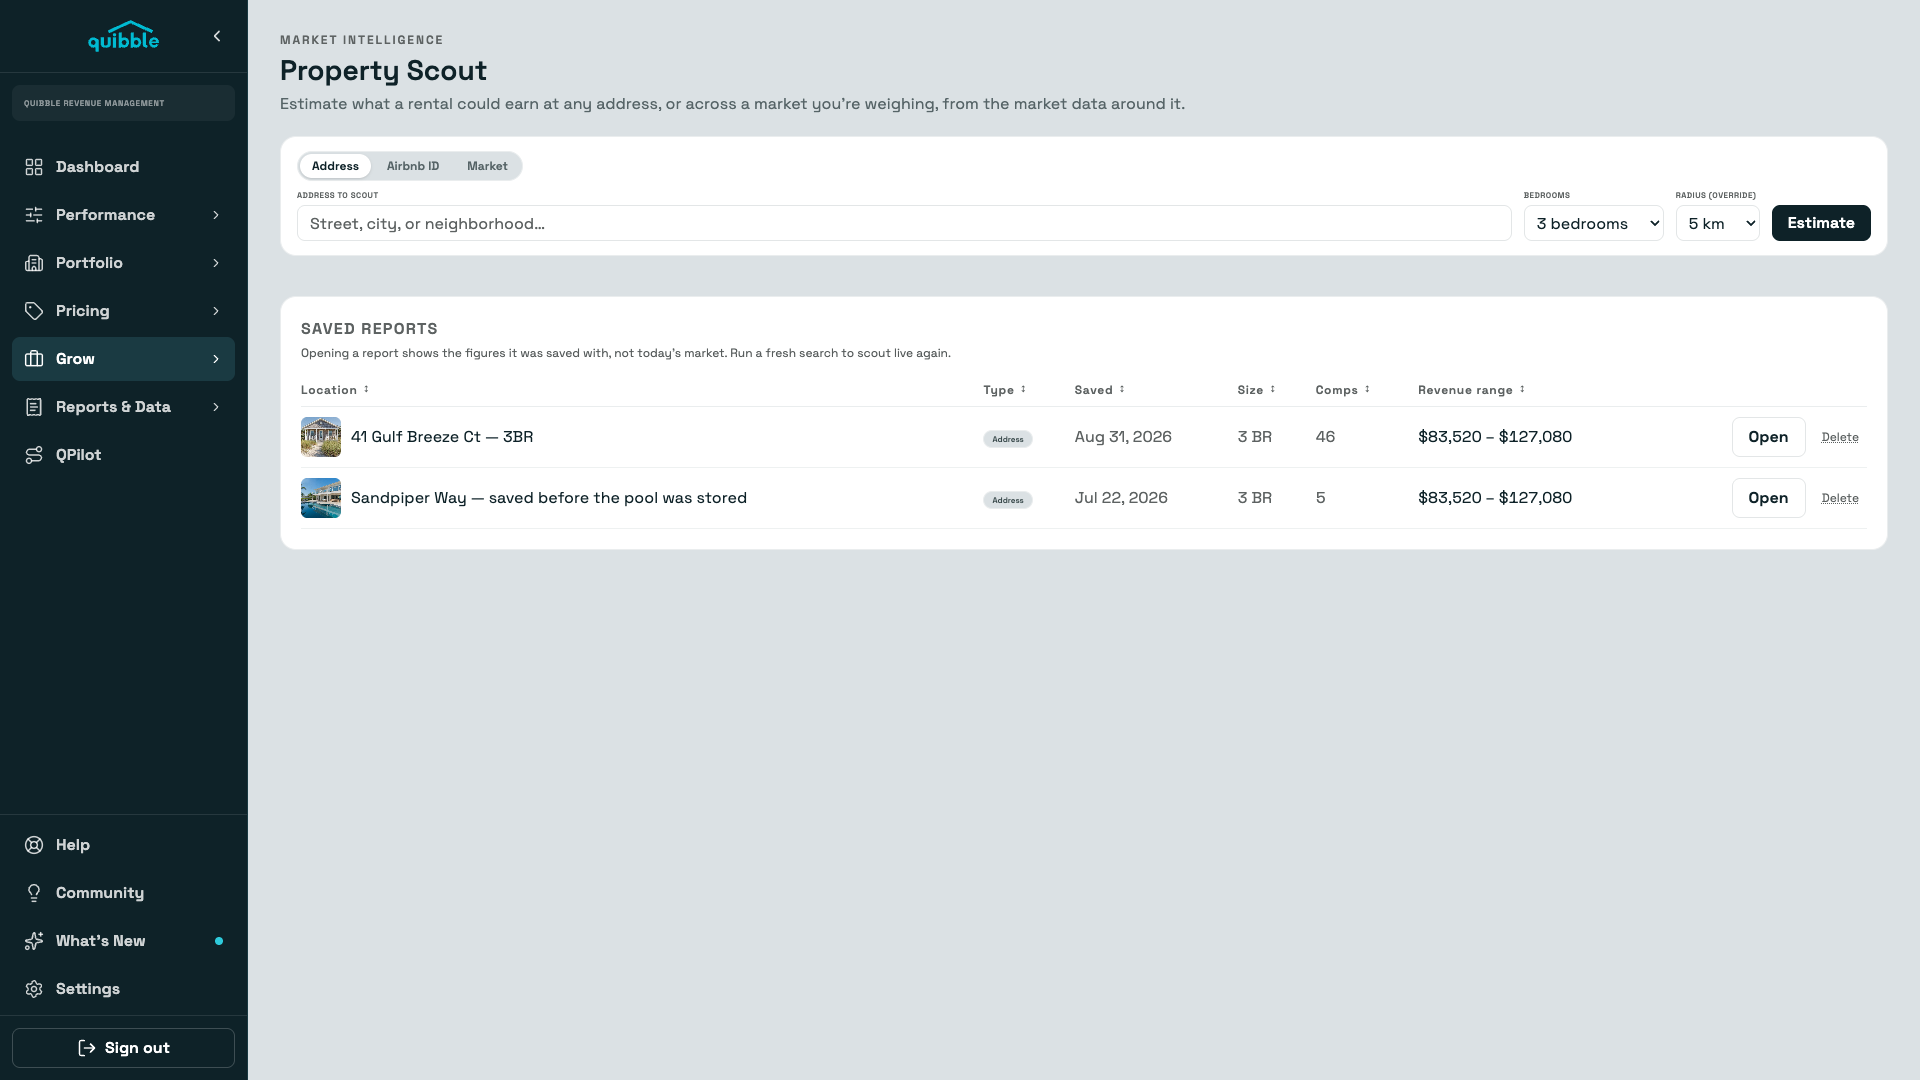
Property Scout
Point Scout at an address, a listing, or a whole market and get a month-by-month revenue picture across three pricing scenarios — built from the competitor rates around it.
Explore →