See the number before it happens.
A dashboard that reads your portfolio for you every morning — pace against forecast, wins and losses since the last sync, and the units that need attention today.
Pace to forecast
Booked, projected, and to-book — the month’s trajectory in one bar.
The Daily Brief
What changed between your two most recent syncs, already written up.
Needs attention
Underpriced, overpriced, and product-issue units surfaced with dollars attached.
Your revenue morning, read for you
The Daily Brief lists every win and loss since the last sync — new bookings with their rates, cancellations with their costs — and each section takes questions. Ask why, get the answer with the data behind it.
Stop pricing in the rear-view mirror
Demand and price behavior, revenue metrics, and pace — for the portfolio, a market, a group, or one unit. Forecasts are tracked against what actually landed, so trust is earned with receipts.
Market health at a glance
Every market you operate in, with your occupancy and ADR against the market’s — so you always know whether it’s you or the market before you touch a price.
The rest of the OS
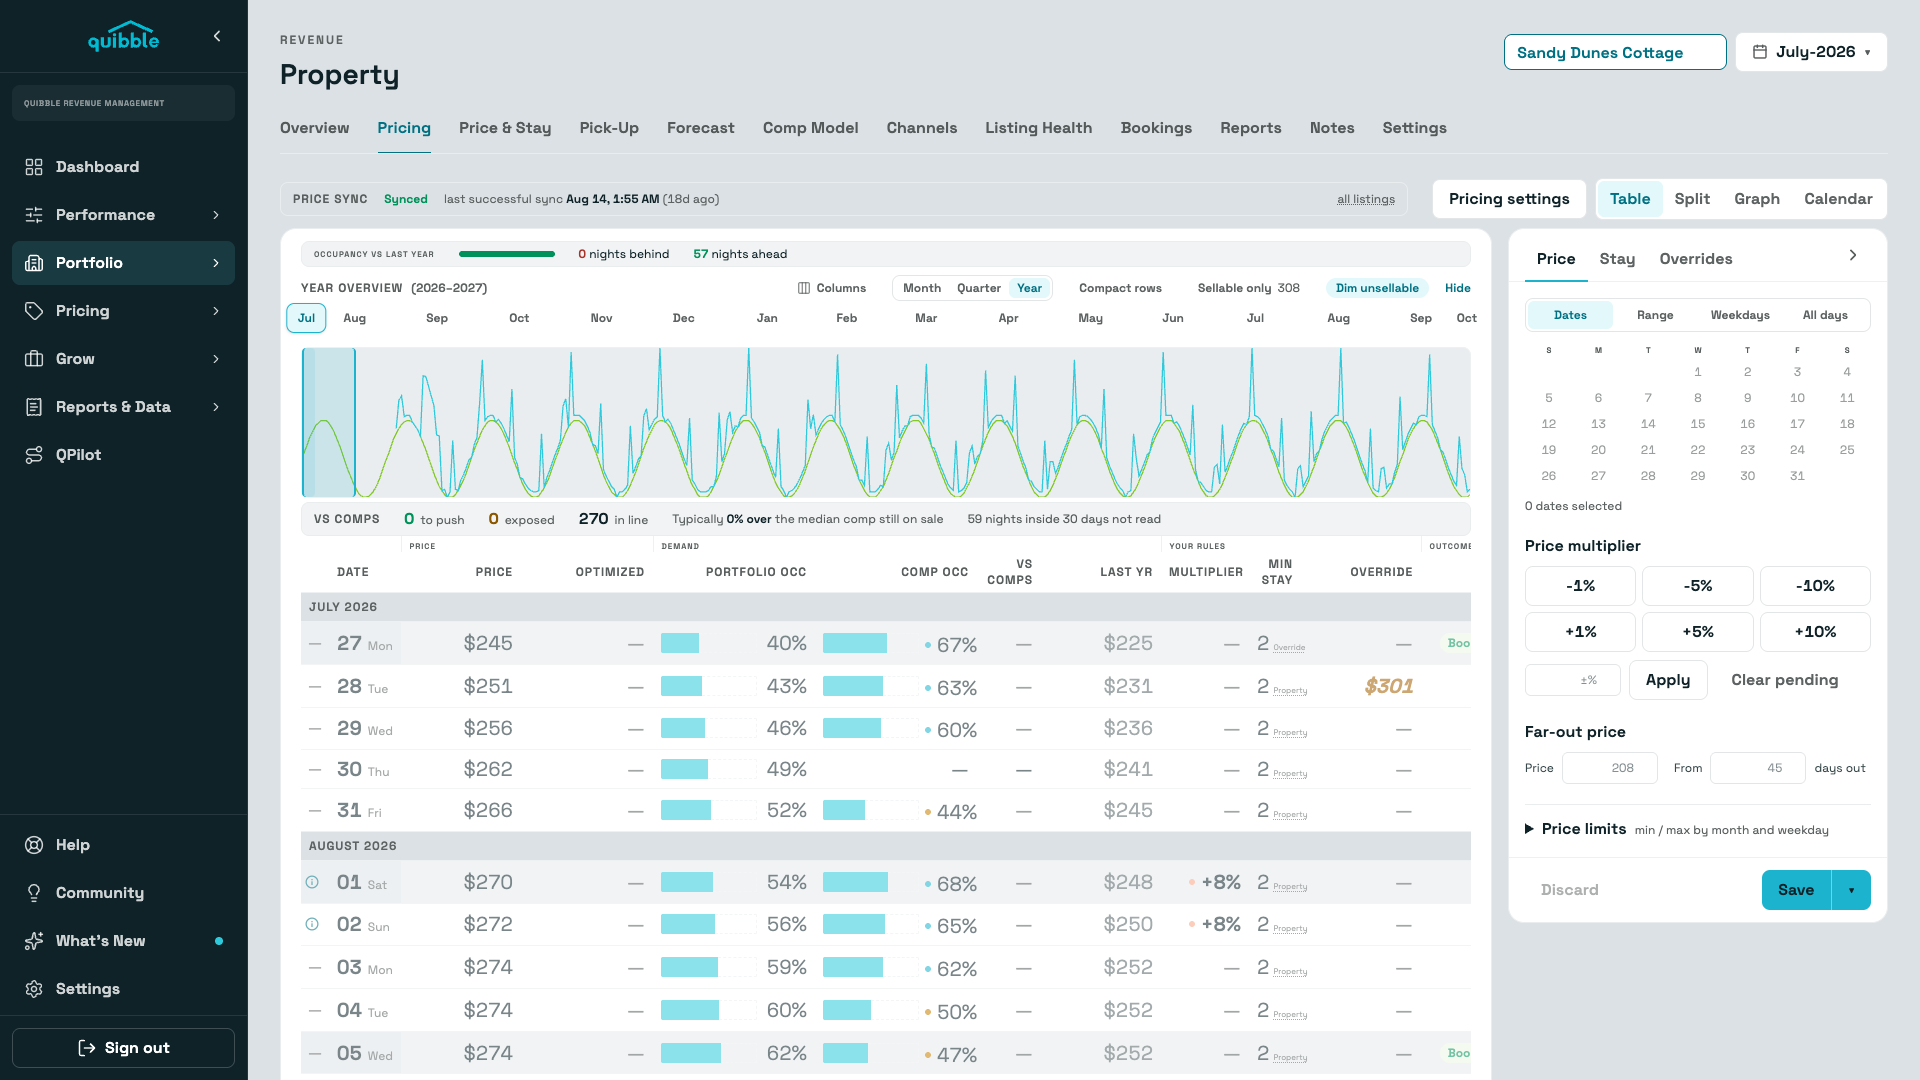
Pricing Engine
Dynamic pricing ≠ optimized pricing. Quibble comps like-kind units instead of nudging an arbitrary base price — solving directly for the rate the market will actually pay, every night.
Explore →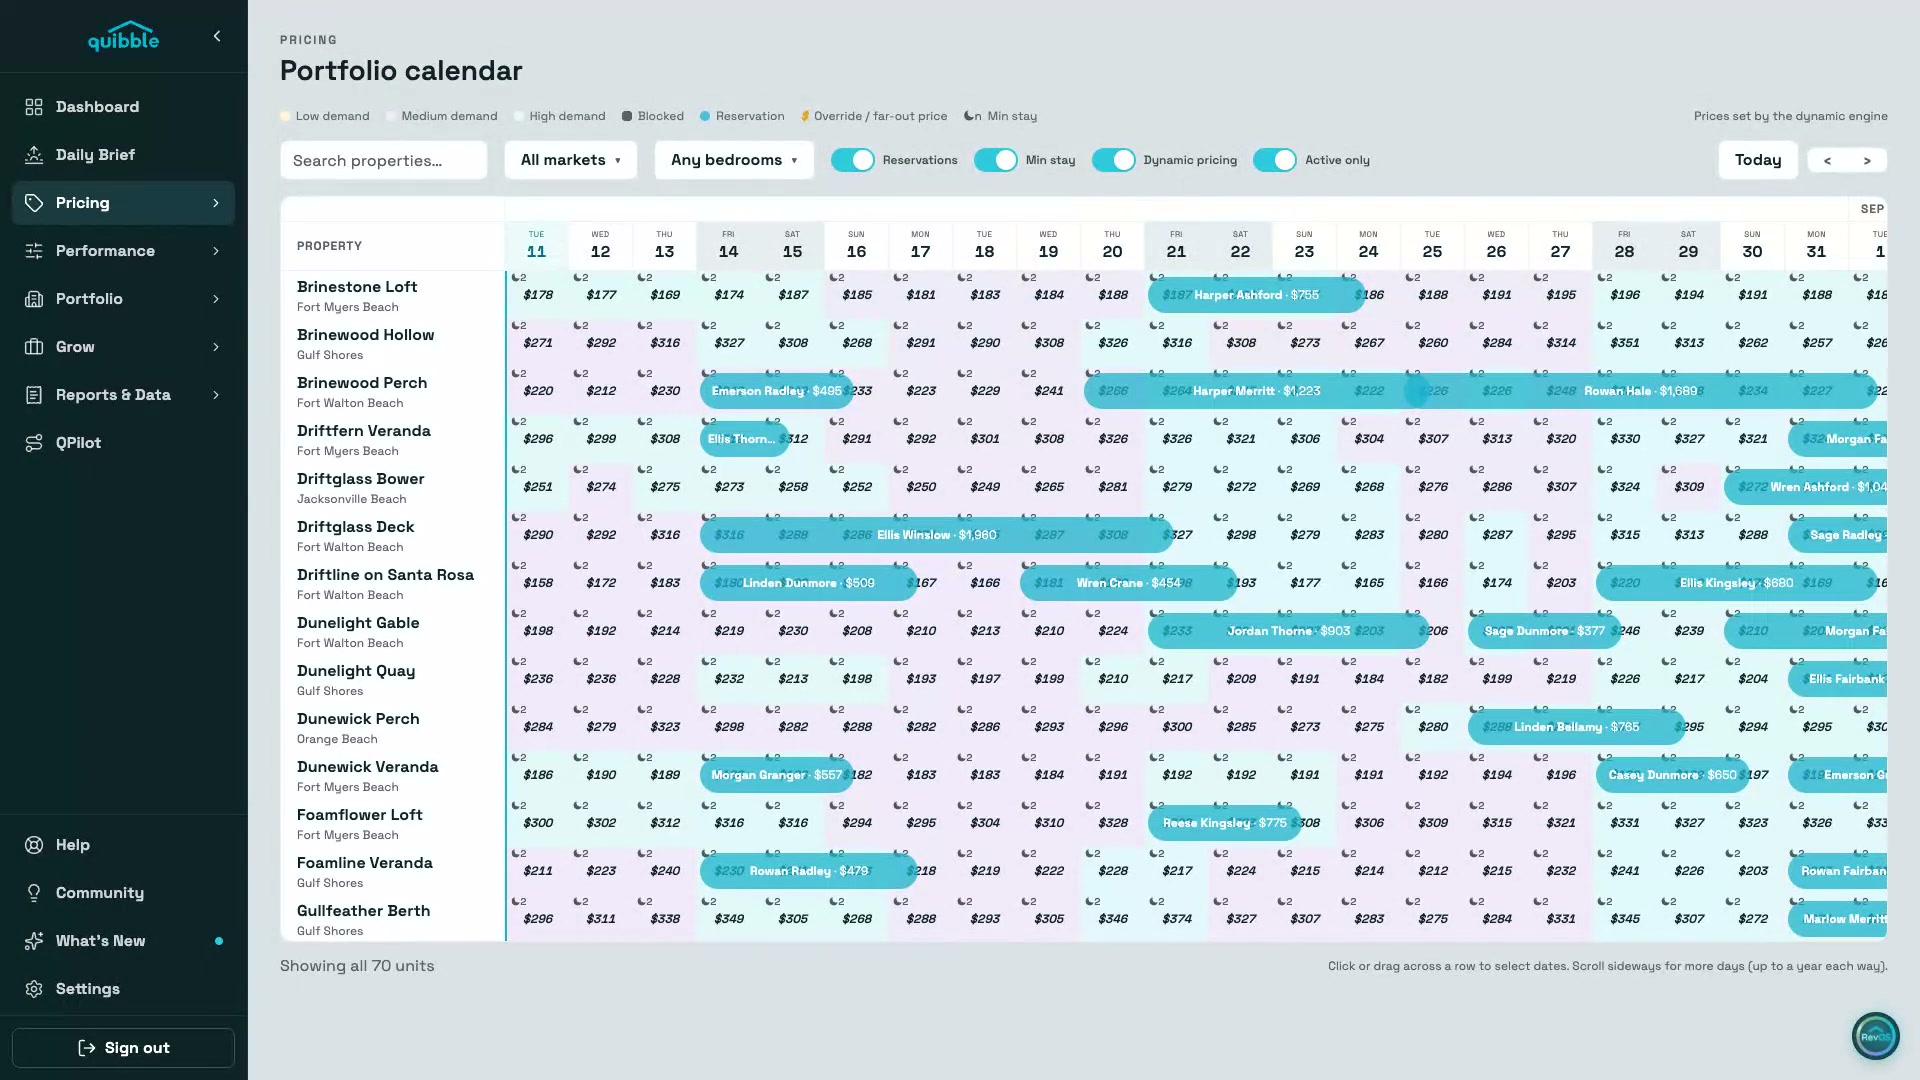
Portfolio Calendar
The whole book on one screen — engine-set prices, reservations, min-stay, and demand painted onto every night, up to a year each way.
Explore →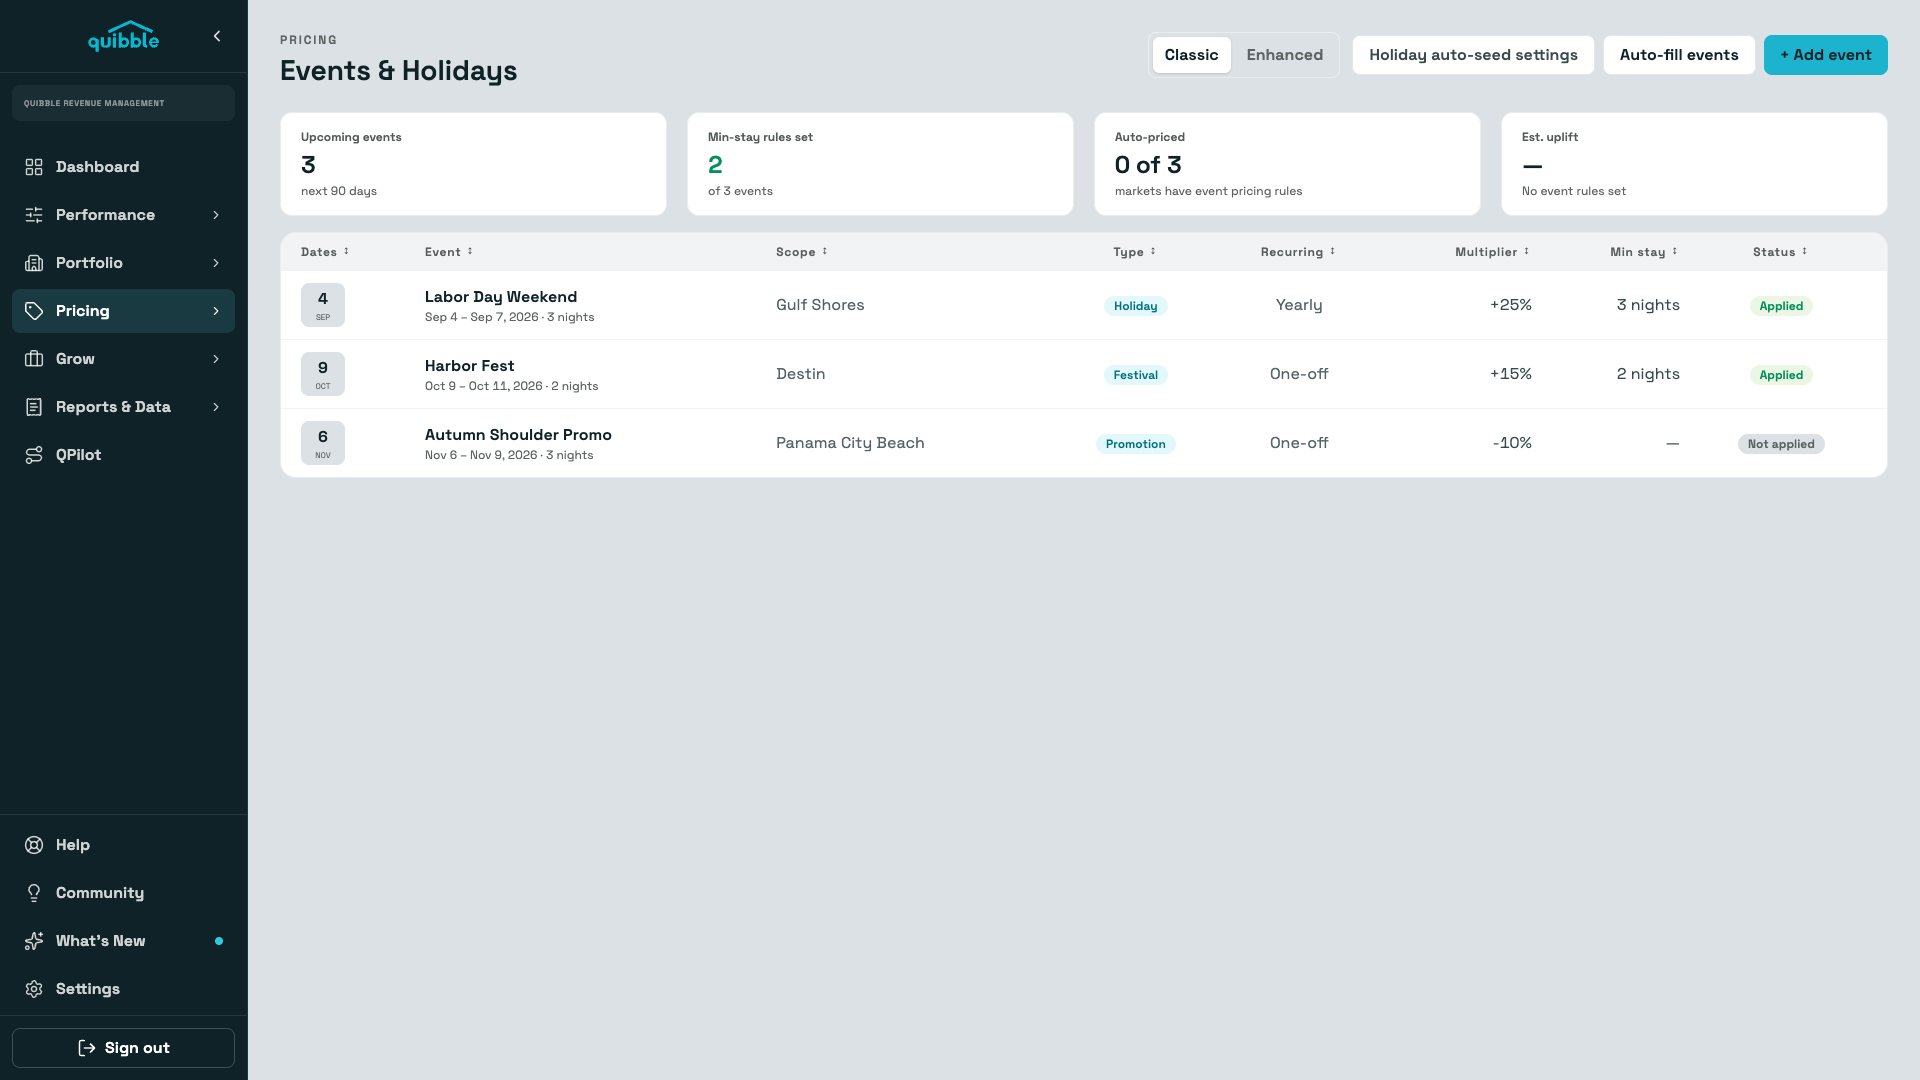
Events & Holidays
Local events detected and priced automatically — with last year’s performance next to this year’s suggestion, so every uplift is a decision, not a guess.
Explore →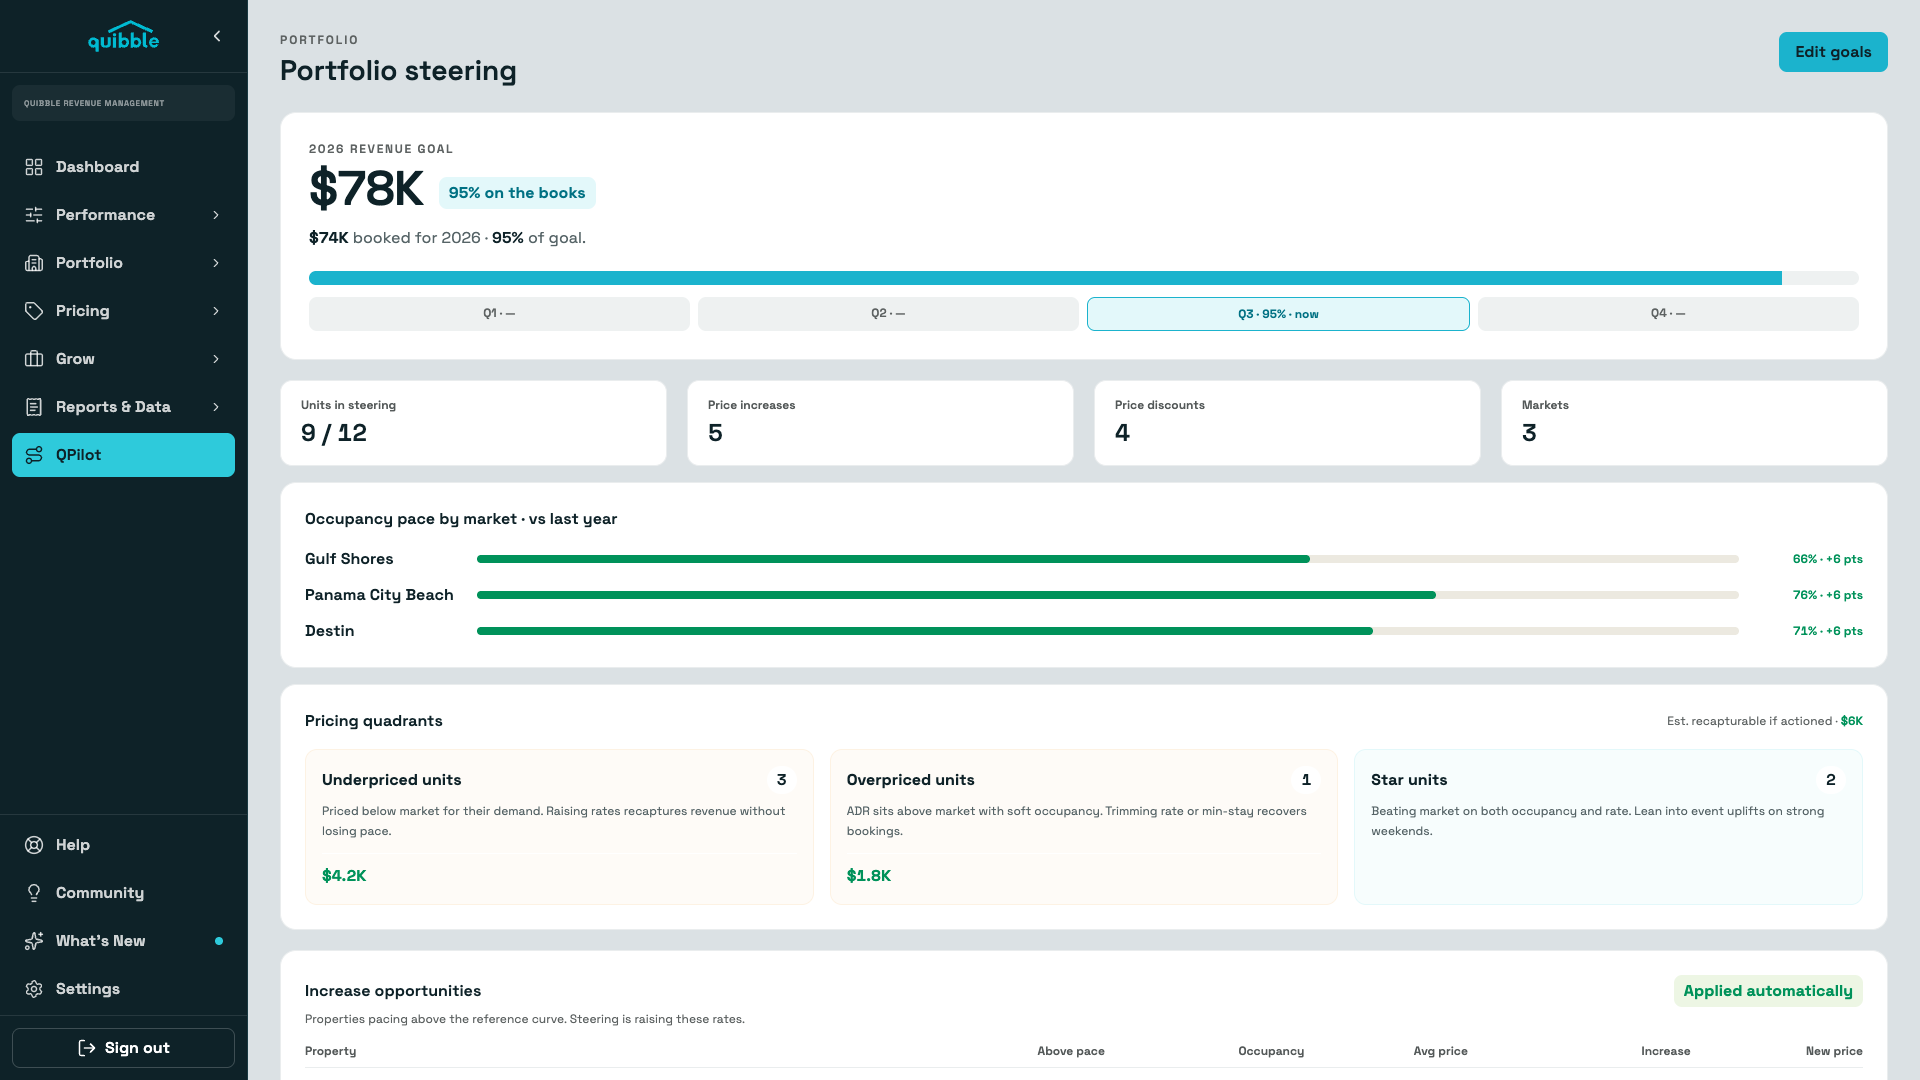
QPilot
Give QPilot a revenue goal and it paces the portfolio toward it — quantifying what’s recapturable, steering prices inside your rules, and flagging the units that need a human.
Explore →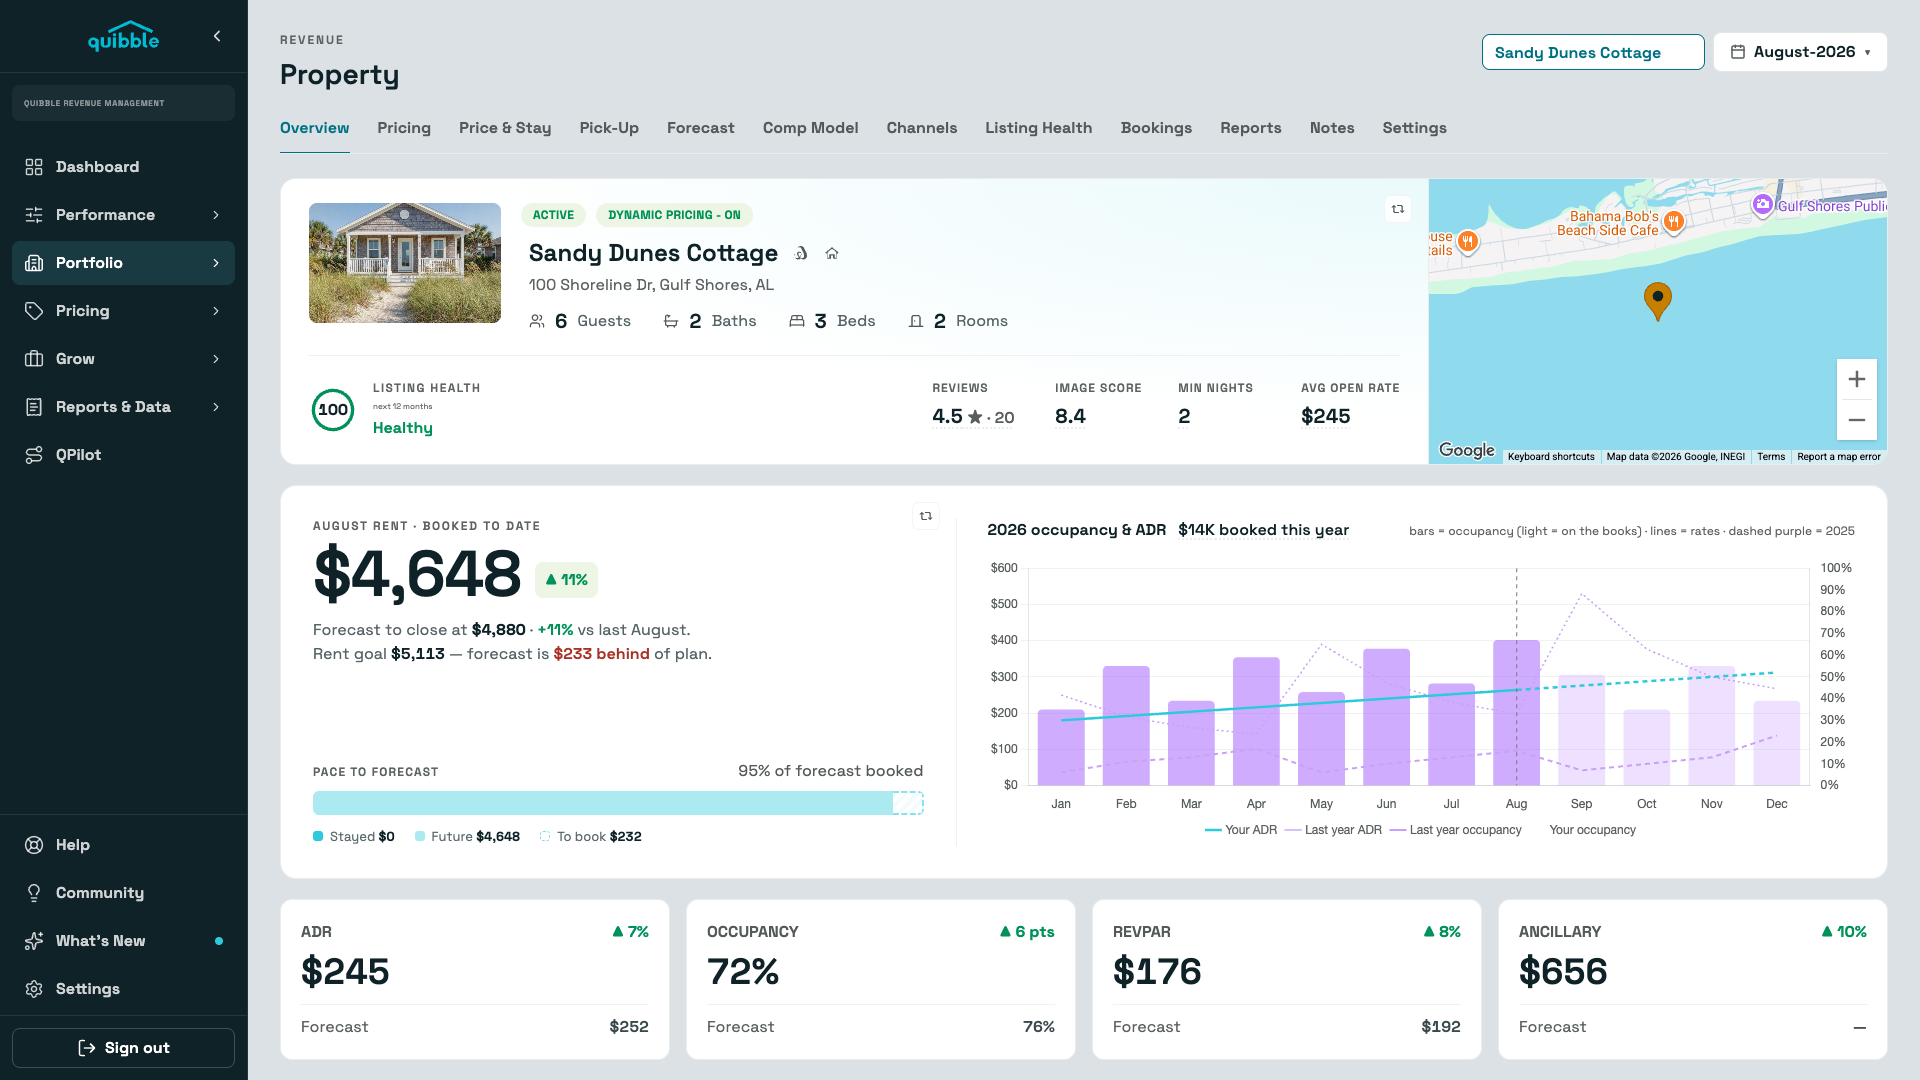
Properties
The whole portfolio ranked by occupancy gap — and a property page with the booking curve, comps, channels, listing health, and pricing history behind every number.
Explore →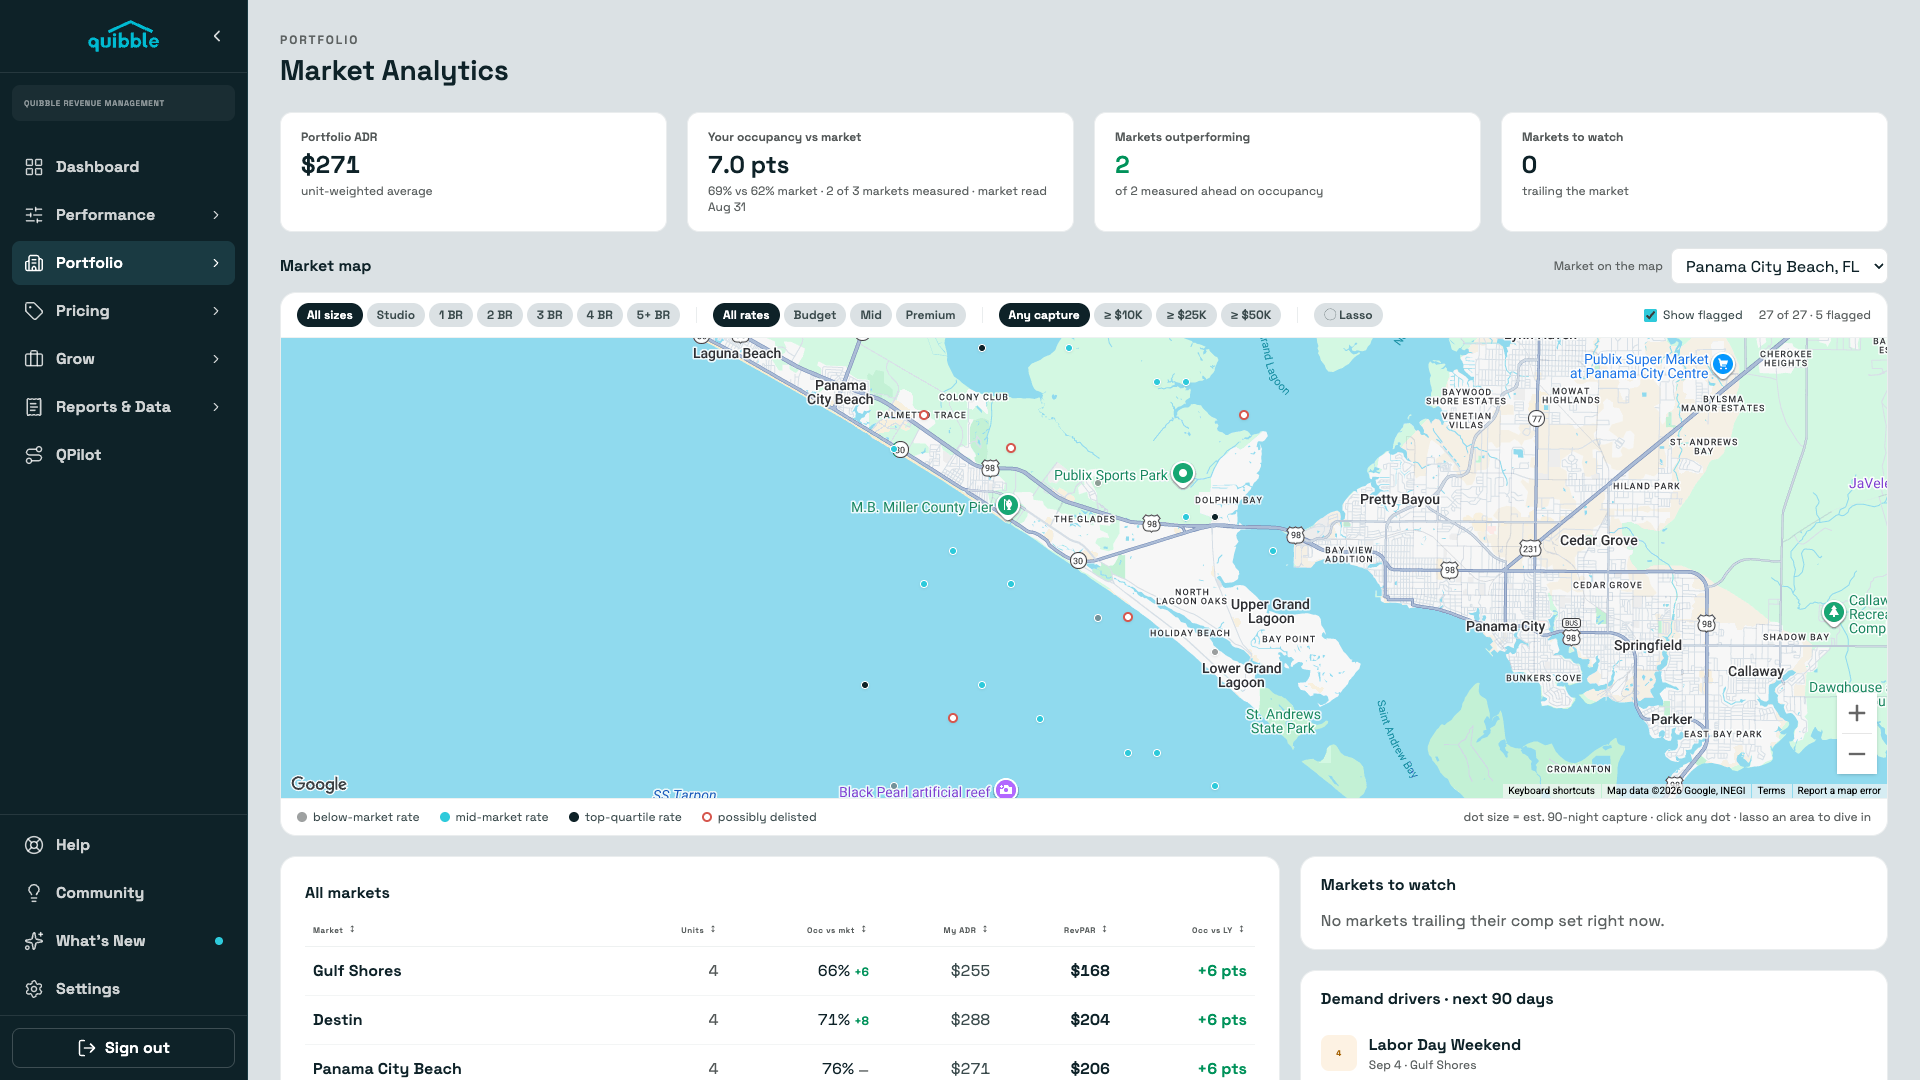
Market Analytics
Your occupancy and ADR against every market you operate in — with the tracked listings behind the comparison on a map, so a soft month gets a diagnosis instead of a guess.
Explore →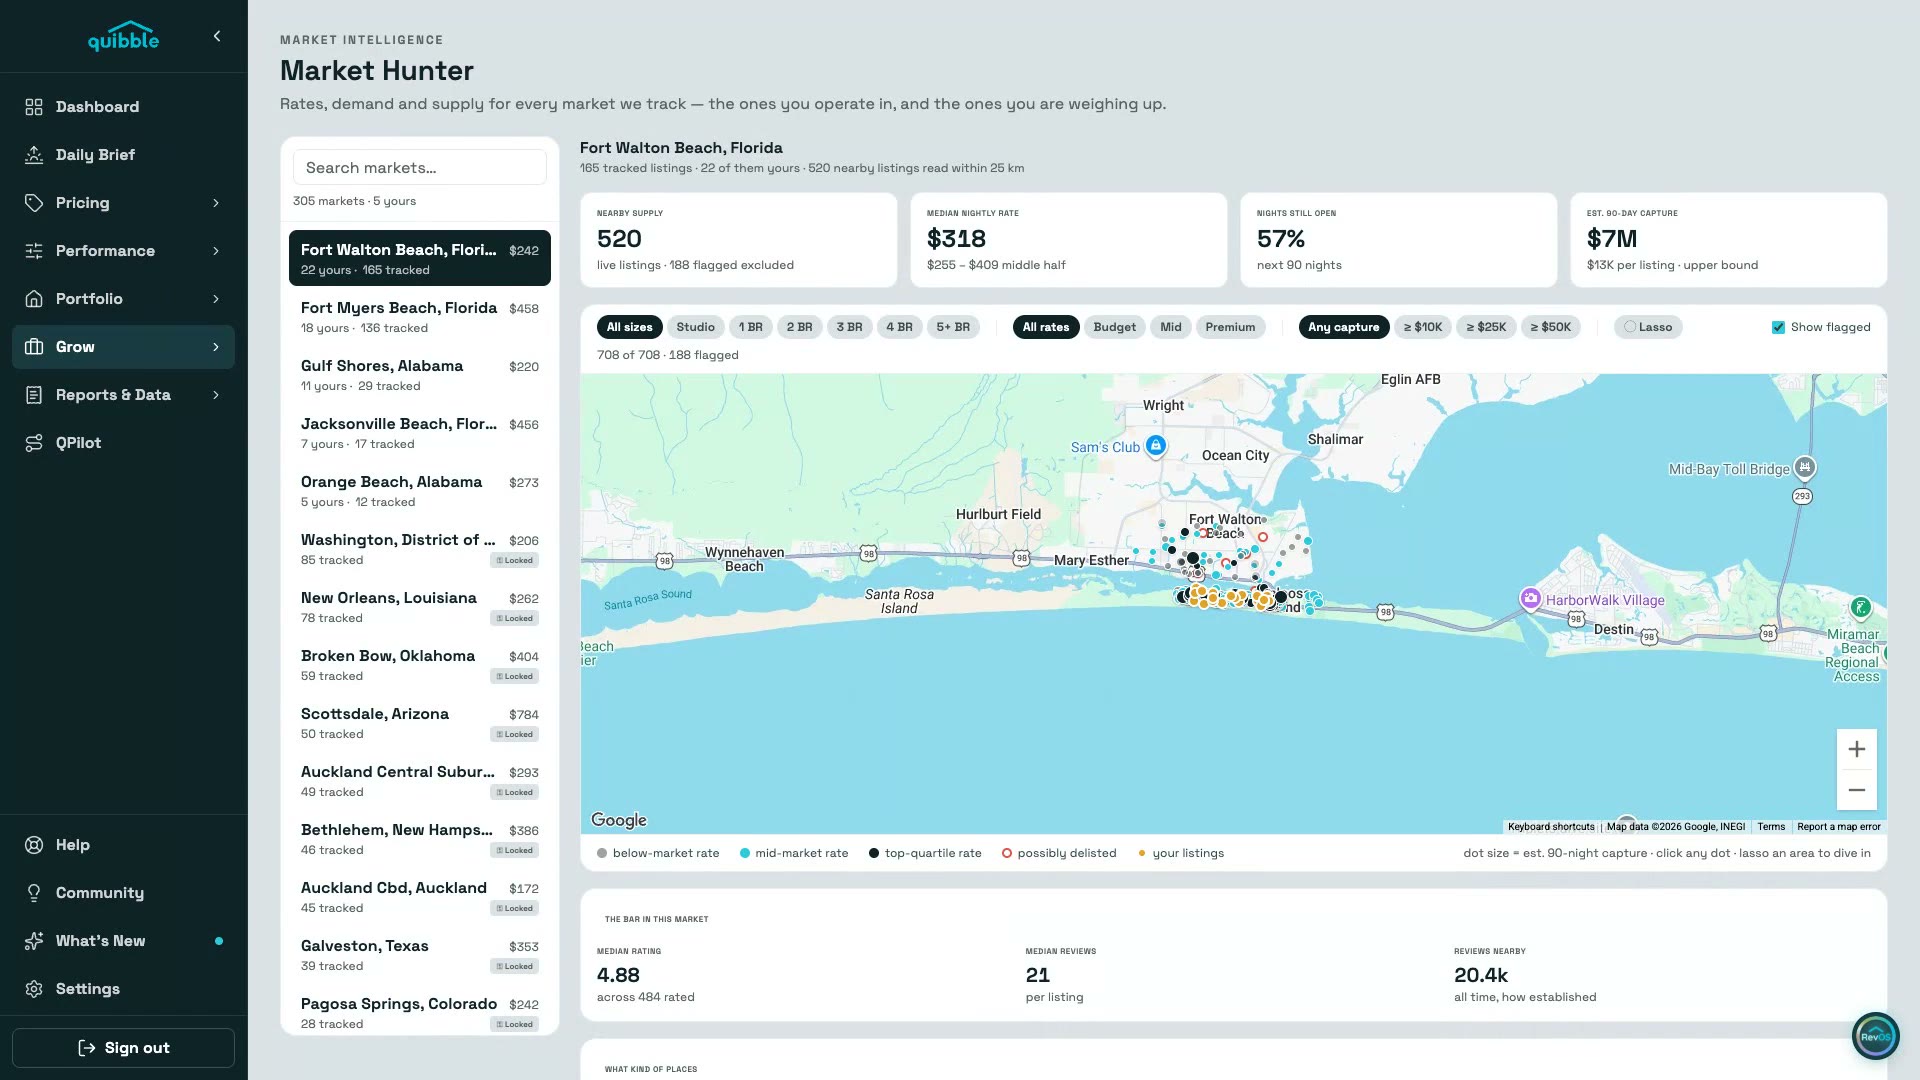
Market Hunter
The markets you operate in and the ones you’re weighing up — live supply, achievable rates, open nights, and the bar you’d have to clear, on a map you can lasso.
Explore →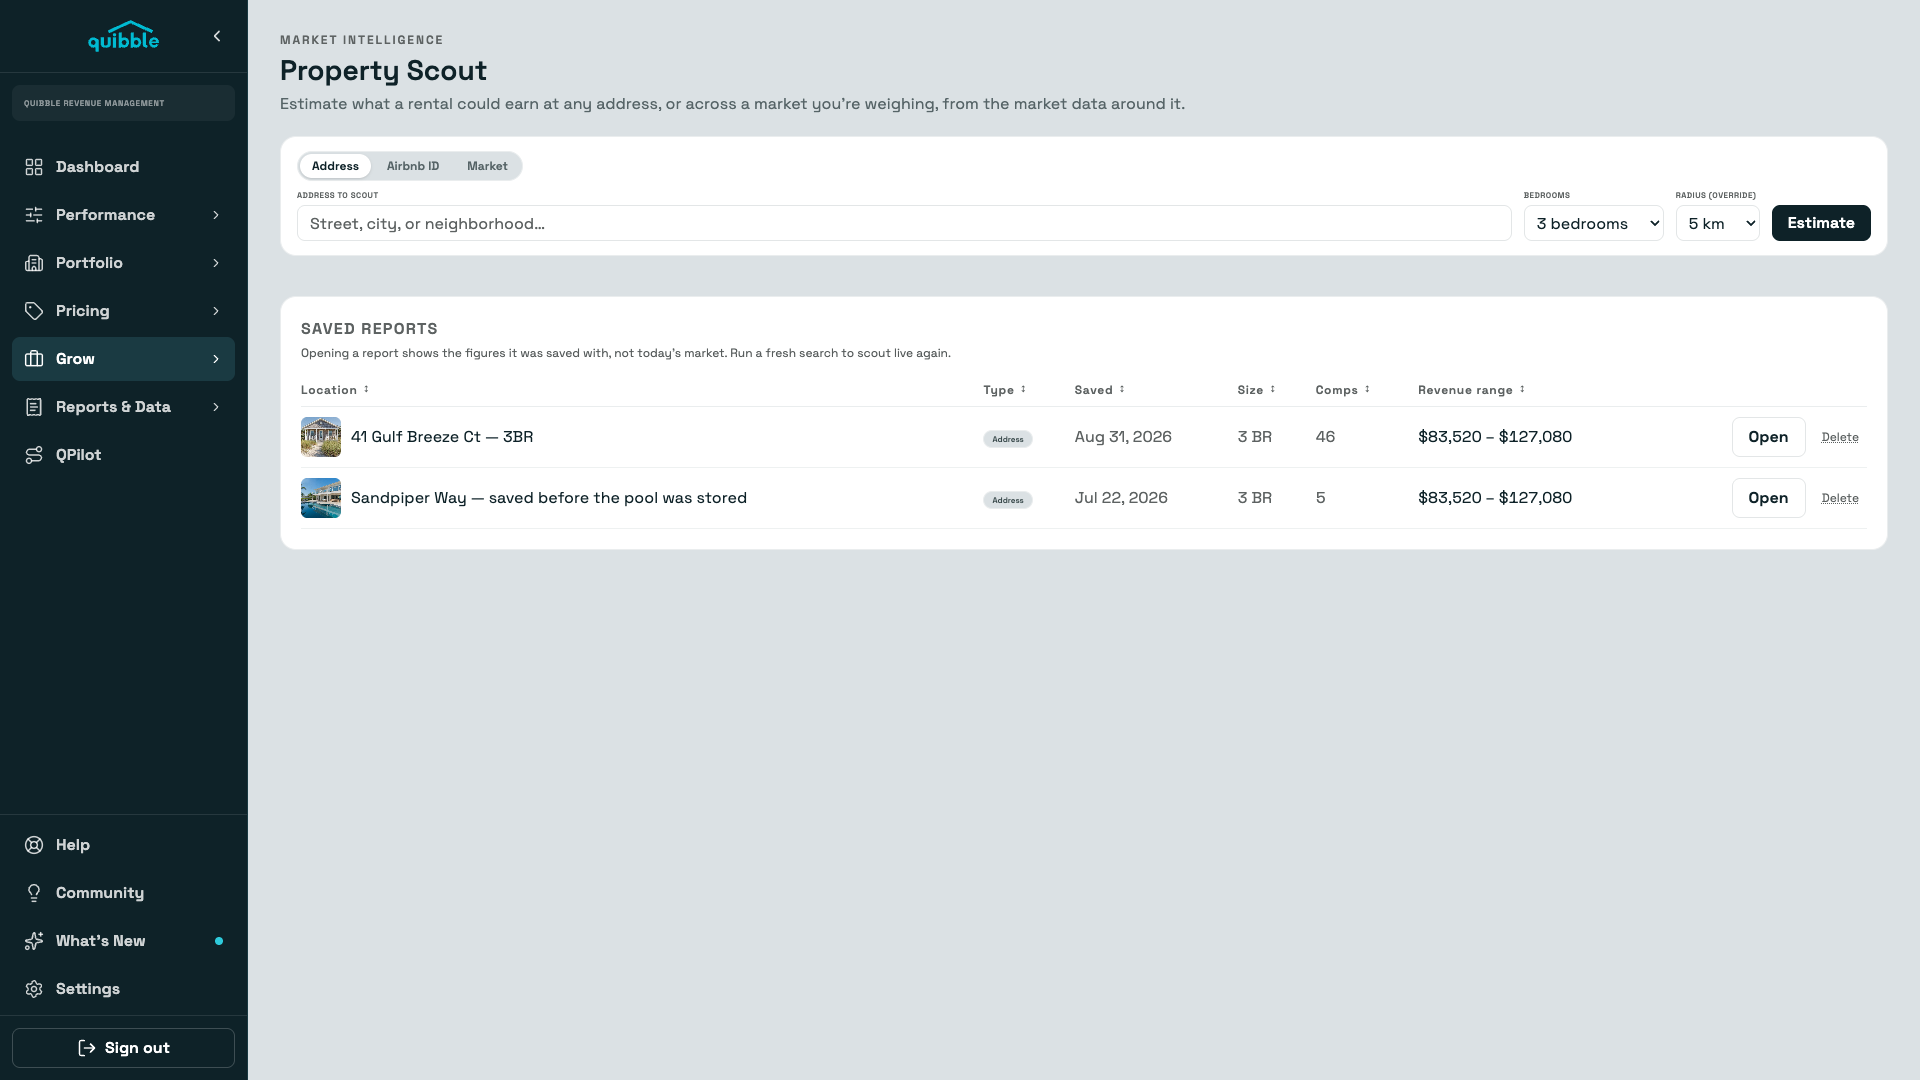
Property Scout
Point Scout at an address, a listing, or a whole market and get a month-by-month revenue picture across three pricing scenarios — built from the competitor rates around it.
Explore →