Underwrite any address before you sign it.
Point Scout at an address, a listing, or a whole market and get a month-by-month revenue picture across three pricing scenarios — built from the competitor rates around it.
Three scenarios
Conservative, balanced, and premium bands — a range you can defend, not one magic number.
Real comps around the point
The estimate names the tracked listings it used, with their rates and distance.
Month by month
Seasonality from the market’s own shape — occupancy, ADR, nights, and revenue per month.
A revenue picture you can take to an owner
Every estimate breaks into monthly occupancy, ADR, nights, and revenue, with the annual range across scenarios on top. Save it as a report or a PDF and walk into the pitch with the story already told.
From gut feel to underwriting
Acquisitions and new-owner pitches usually run on anecdotes. Scout reads the tracked listings around the point — their rates, their seasonality — and turns them into numbers you can defend.
The rest of the OS
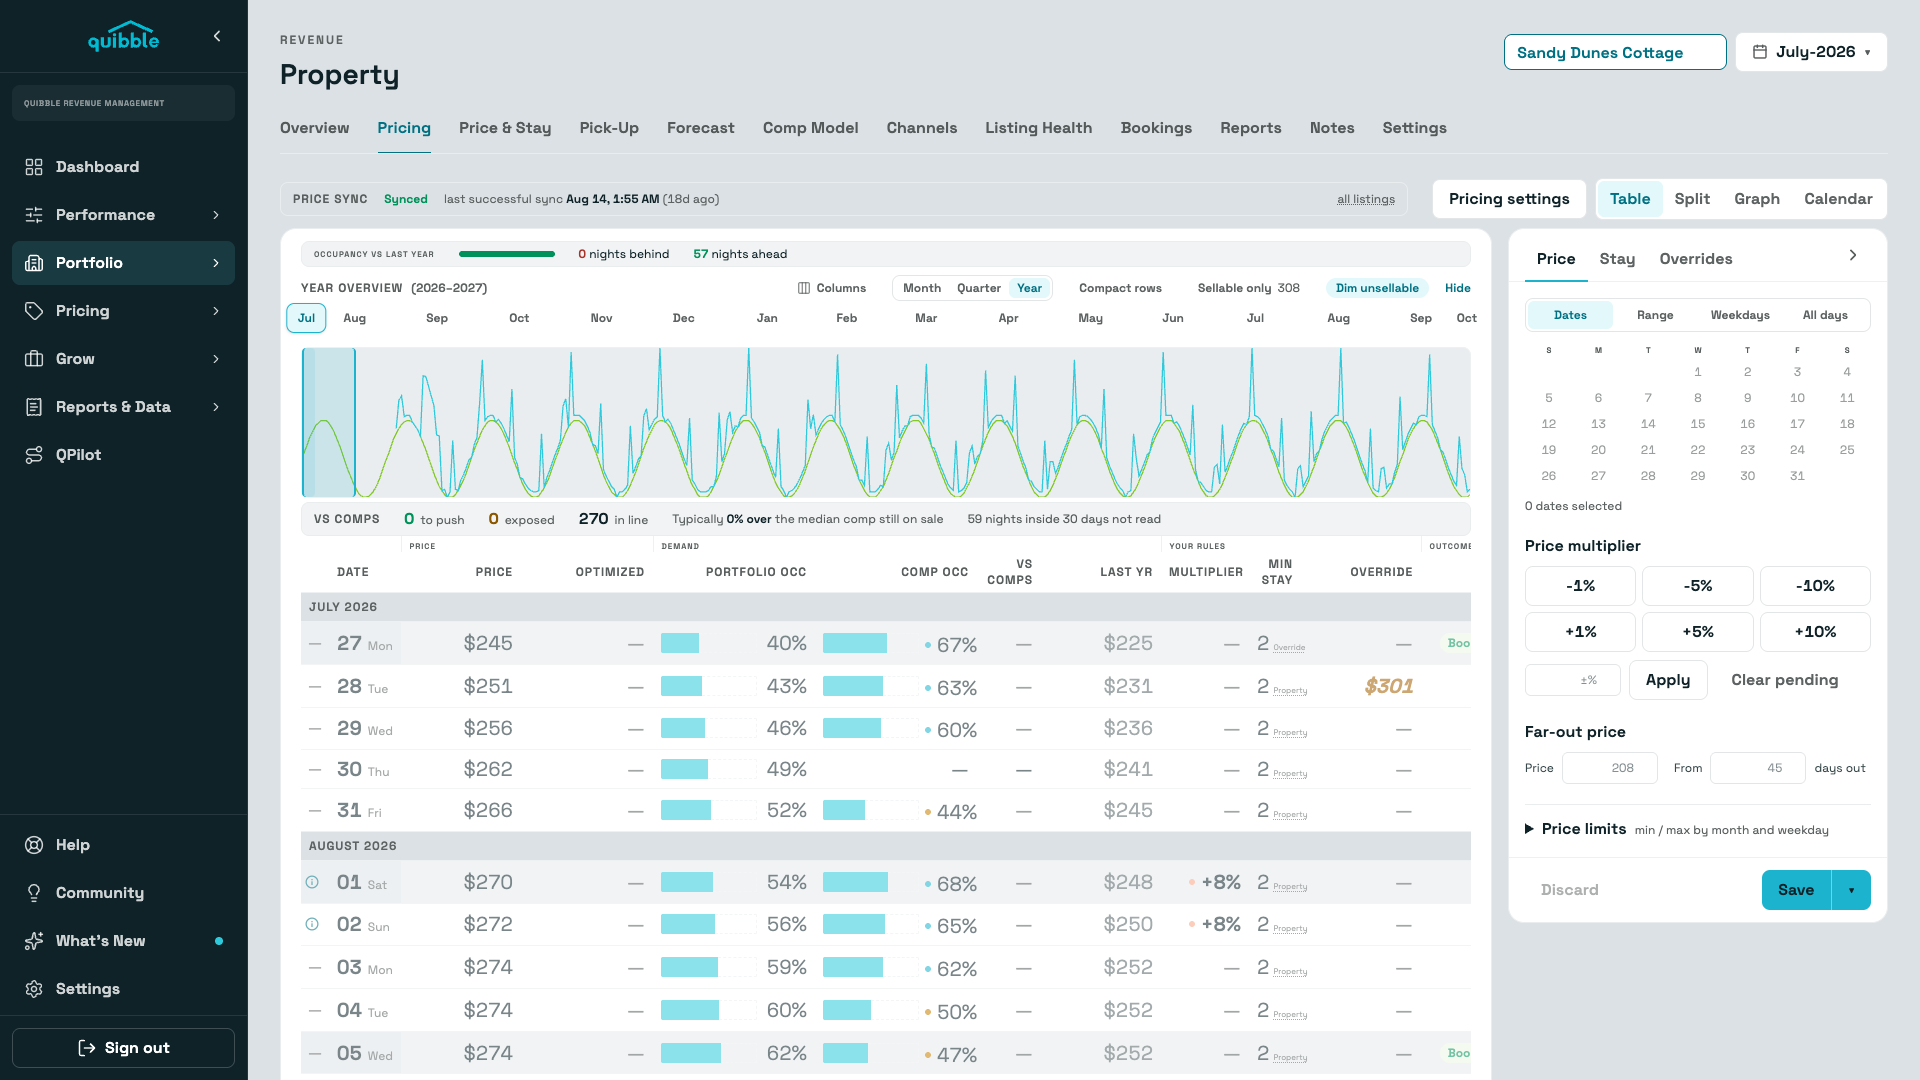
Pricing Engine
Dynamic pricing ≠ optimized pricing. Quibble comps like-kind units instead of nudging an arbitrary base price — solving directly for the rate the market will actually pay, every night.
Explore →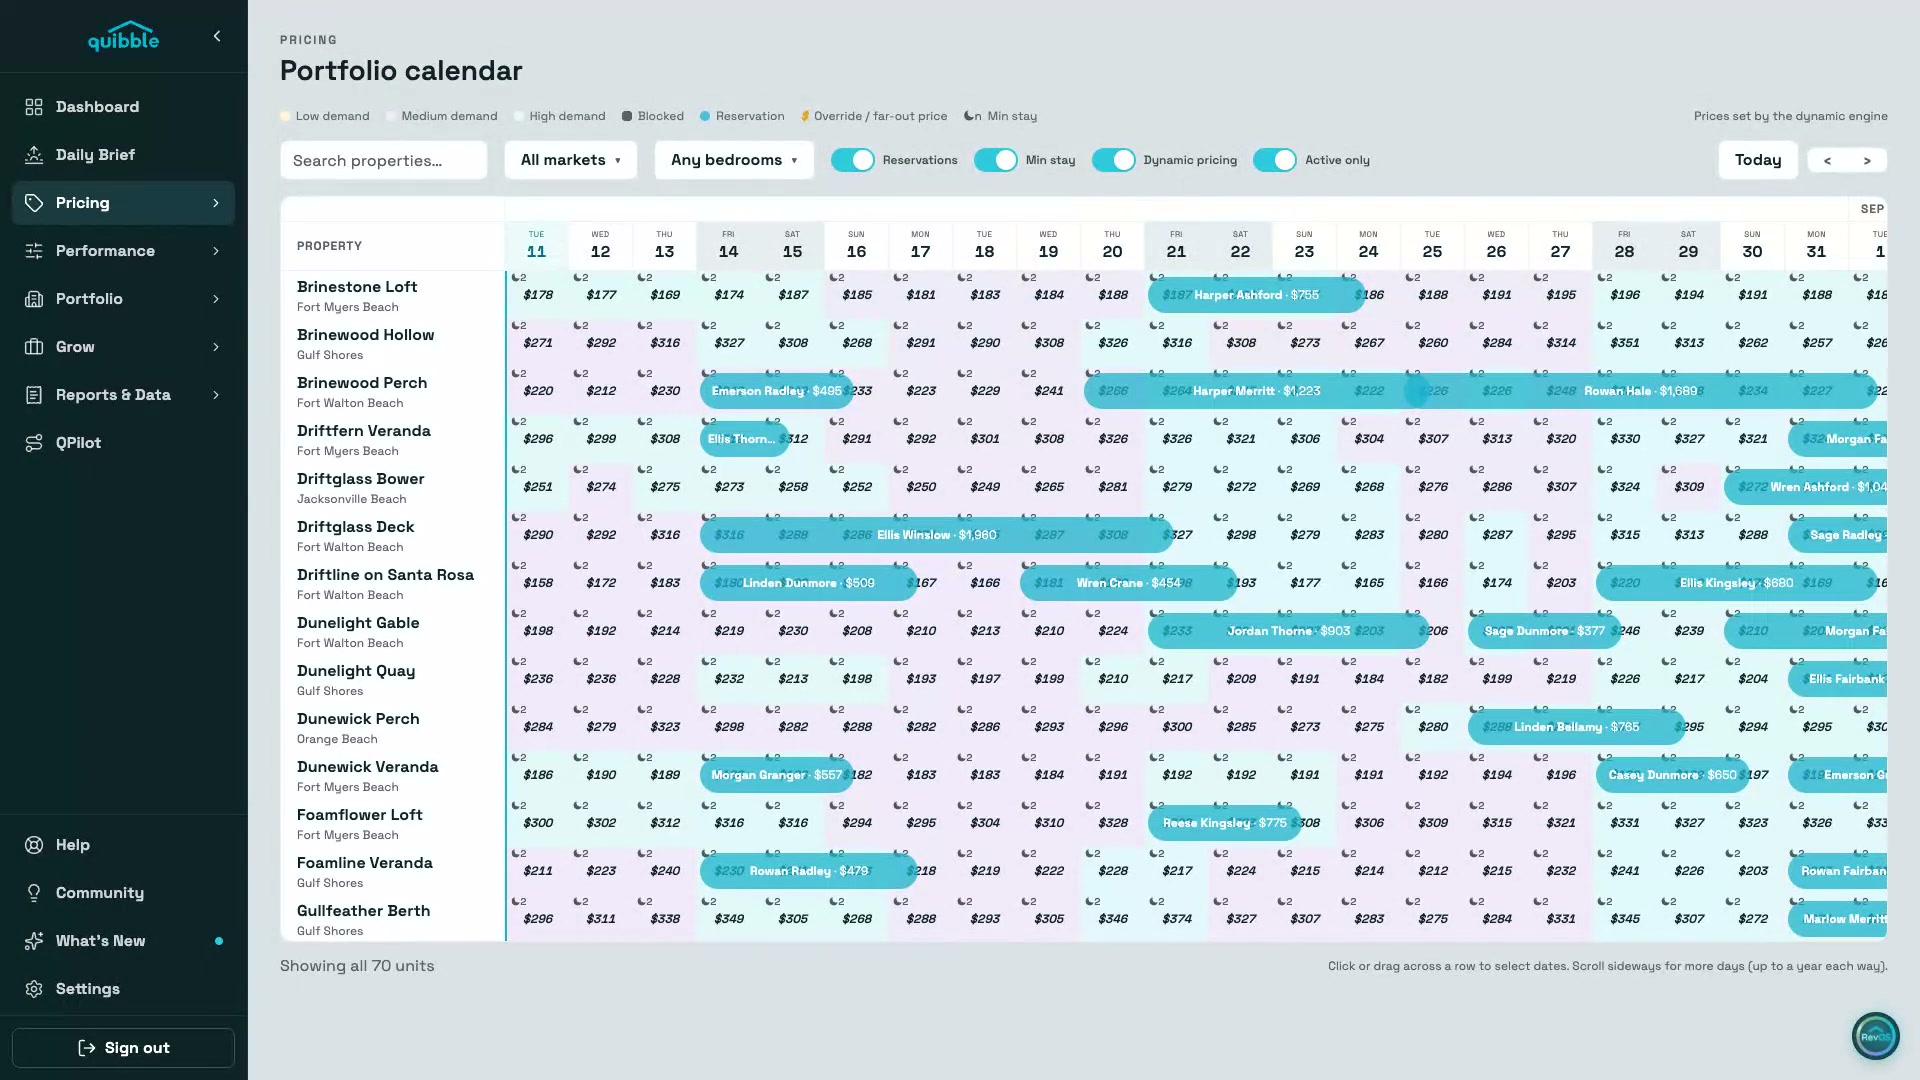
Portfolio Calendar
The whole book on one screen — engine-set prices, reservations, min-stay, and demand painted onto every night, up to a year each way.
Explore →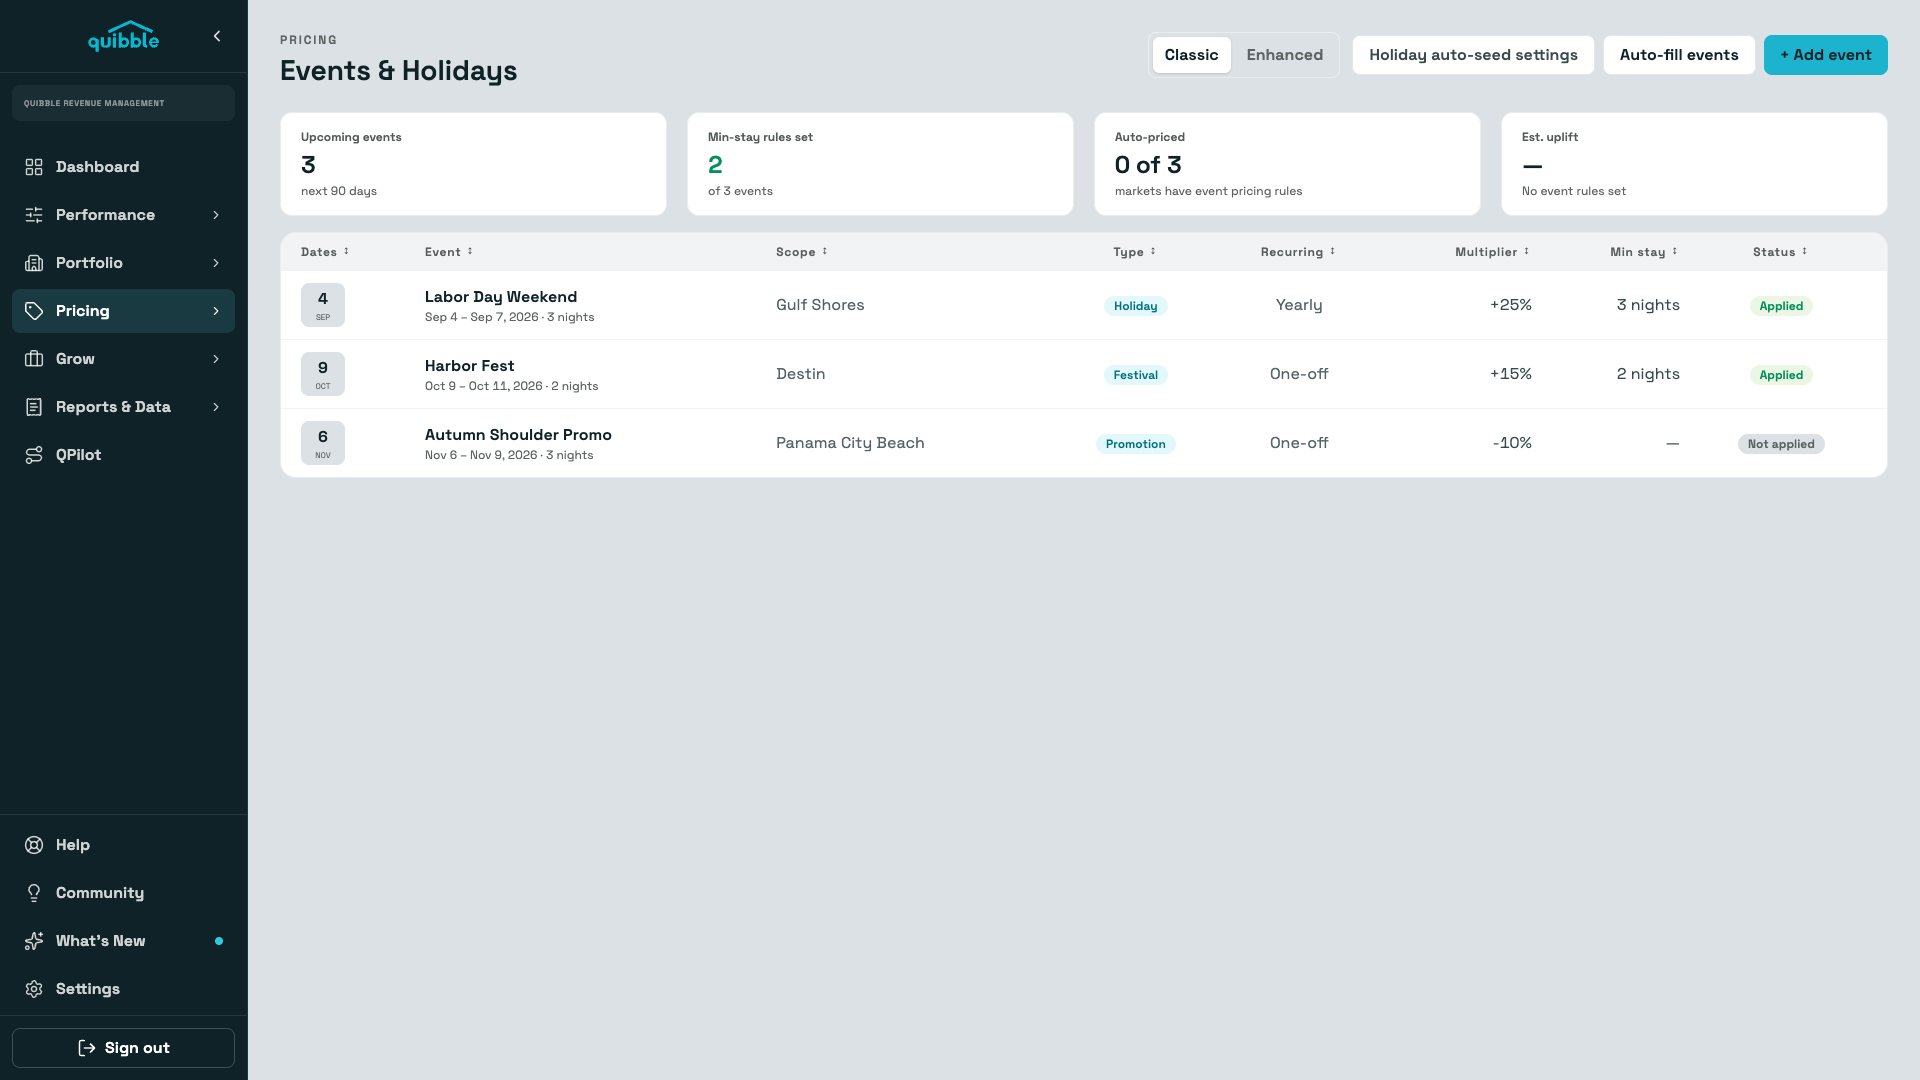
Events & Holidays
Local events detected and priced automatically — with last year’s performance next to this year’s suggestion, so every uplift is a decision, not a guess.
Explore →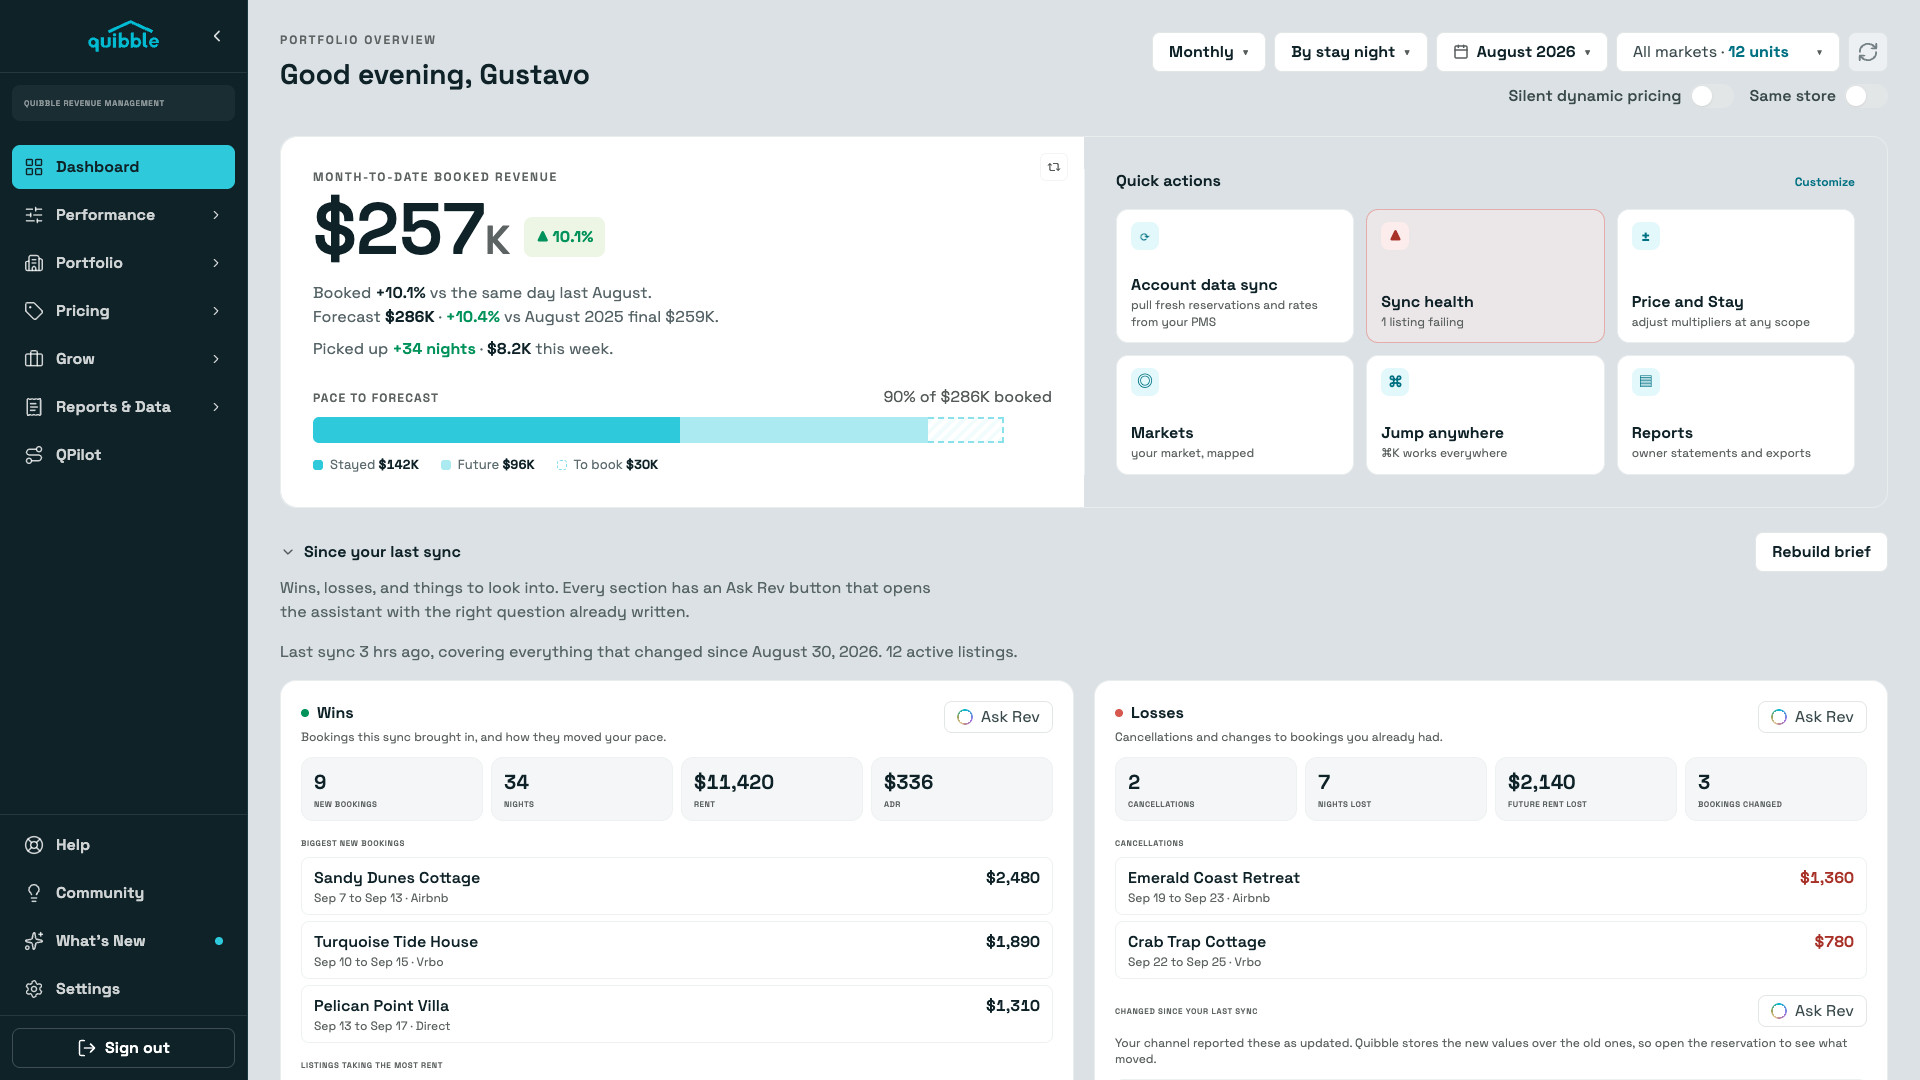
Insights & Daily Brief
A dashboard that reads your portfolio for you every morning — pace against forecast, wins and losses since the last sync, and the units that need attention today.
Explore →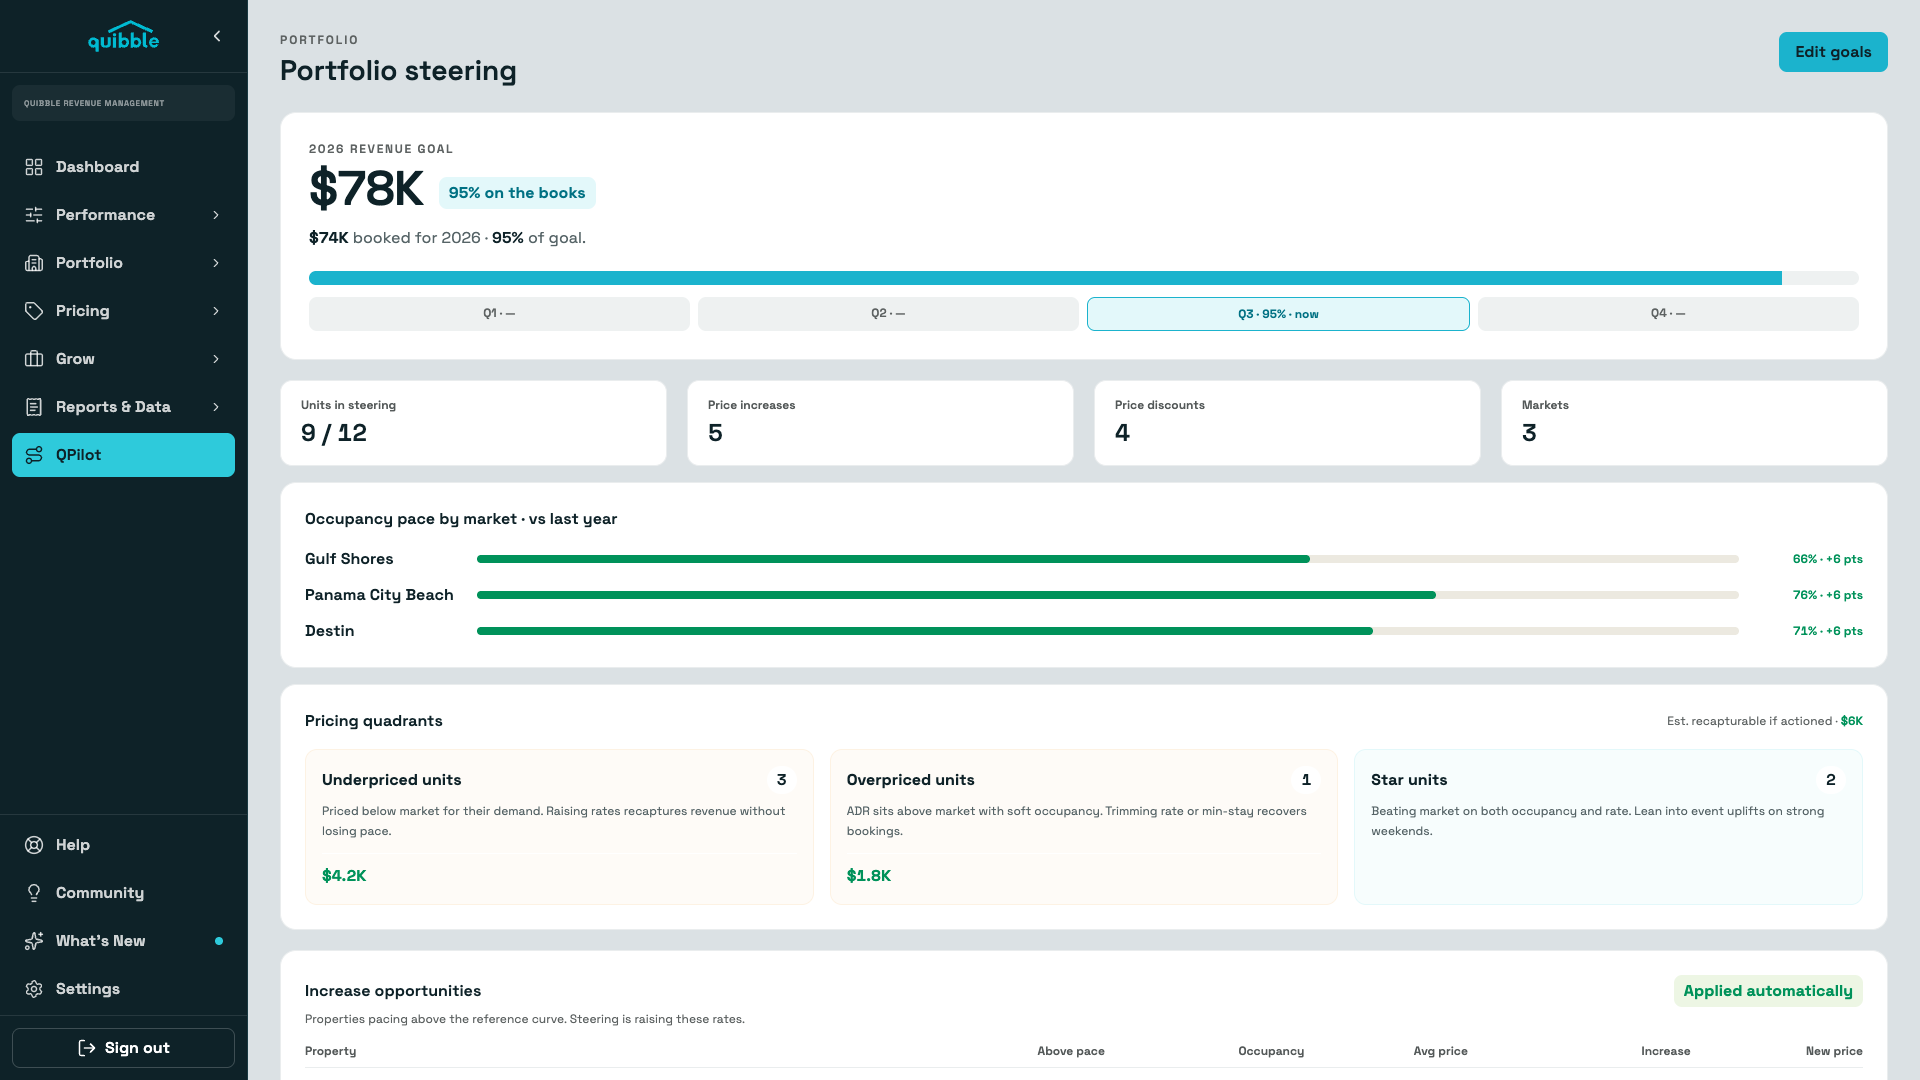
QPilot
Give QPilot a revenue goal and it paces the portfolio toward it — quantifying what’s recapturable, steering prices inside your rules, and flagging the units that need a human.
Explore →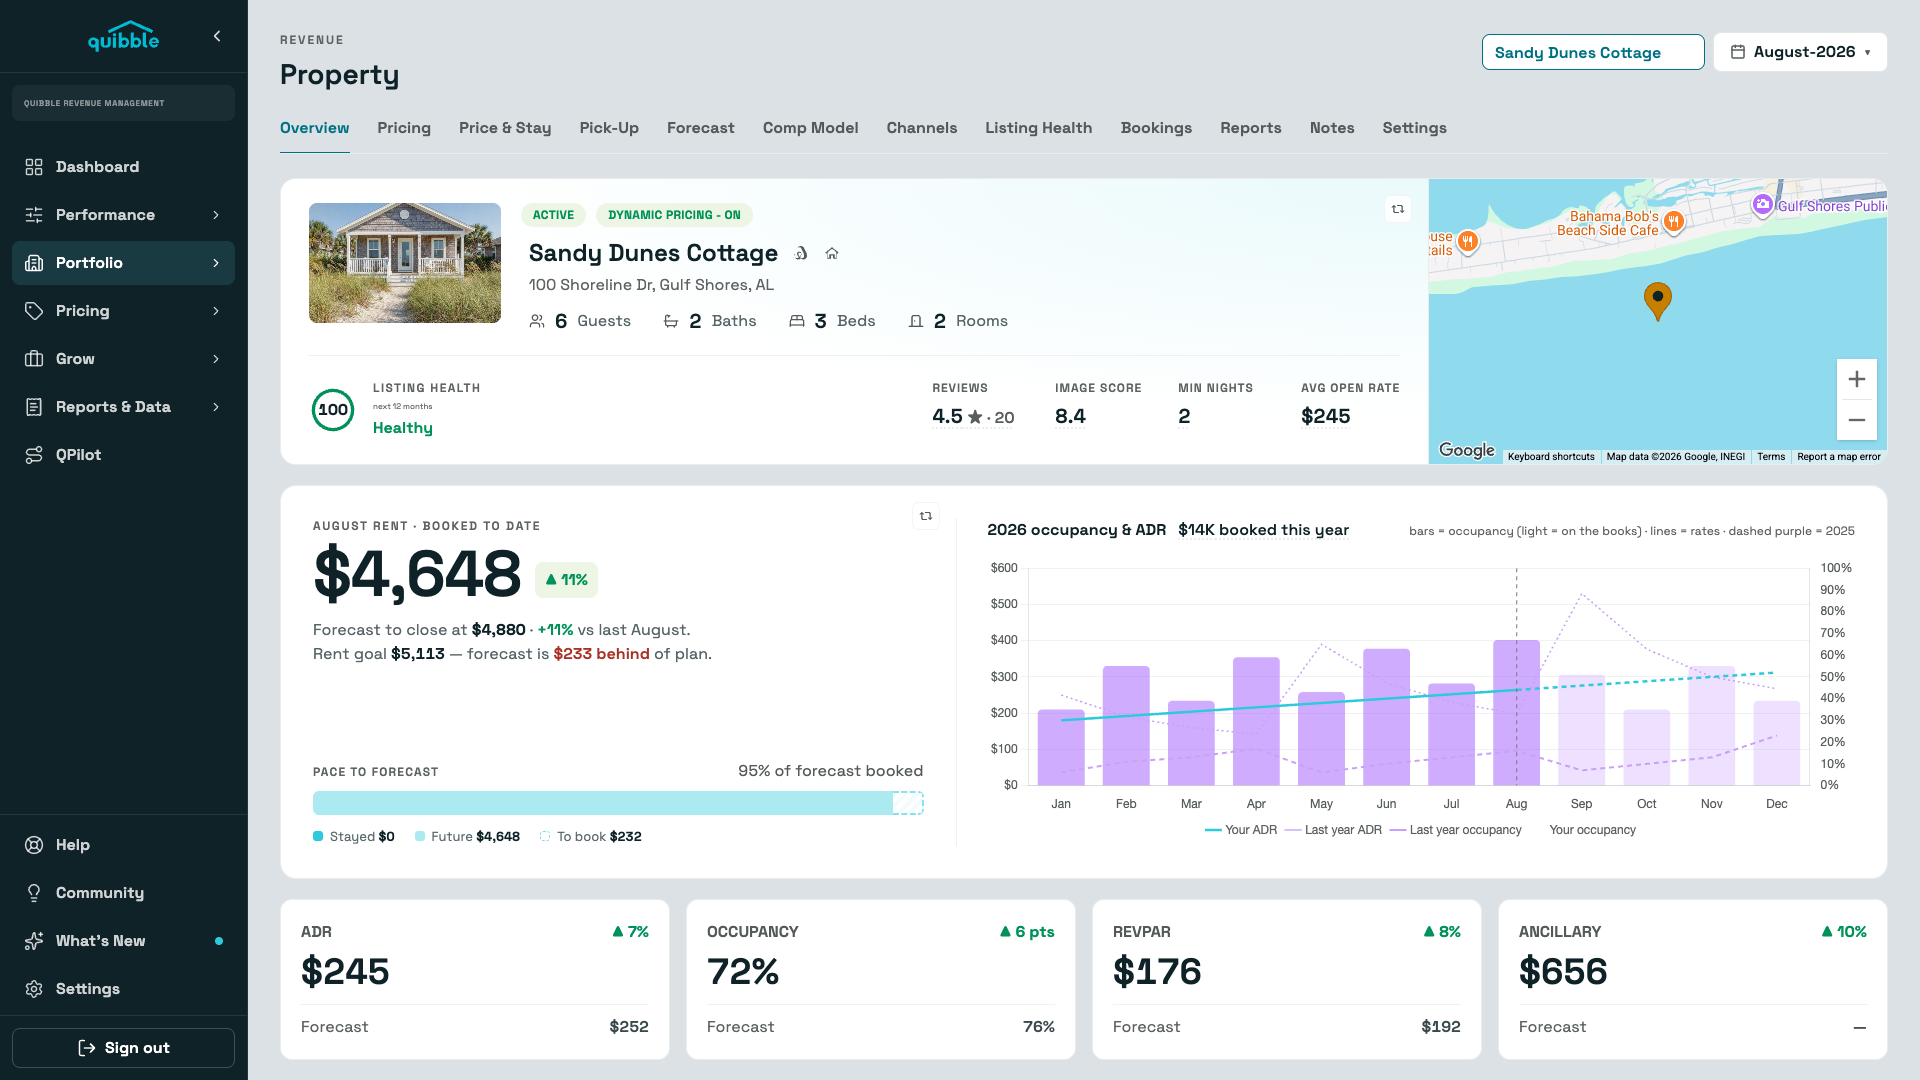
Properties
The whole portfolio ranked by occupancy gap — and a property page with the booking curve, comps, channels, listing health, and pricing history behind every number.
Explore →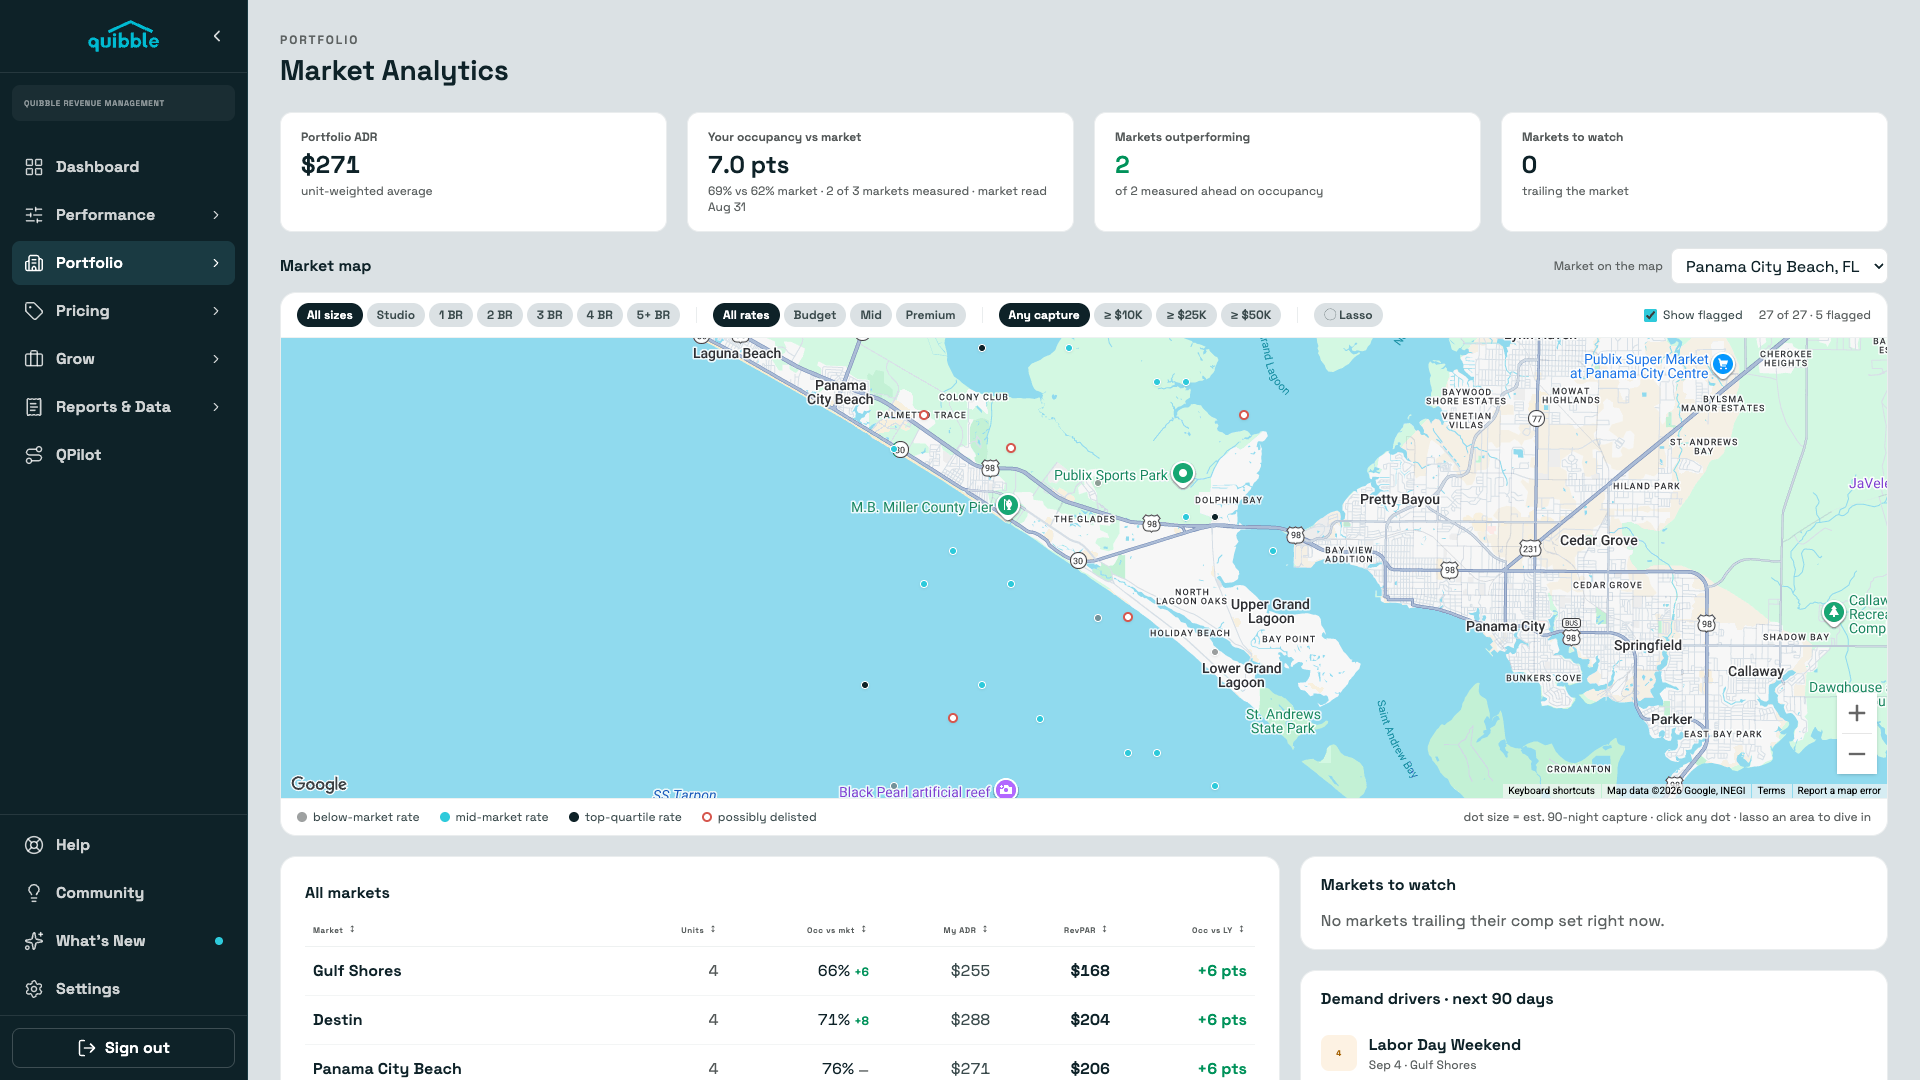
Market Analytics
Your occupancy and ADR against every market you operate in — with the tracked listings behind the comparison on a map, so a soft month gets a diagnosis instead of a guess.
Explore →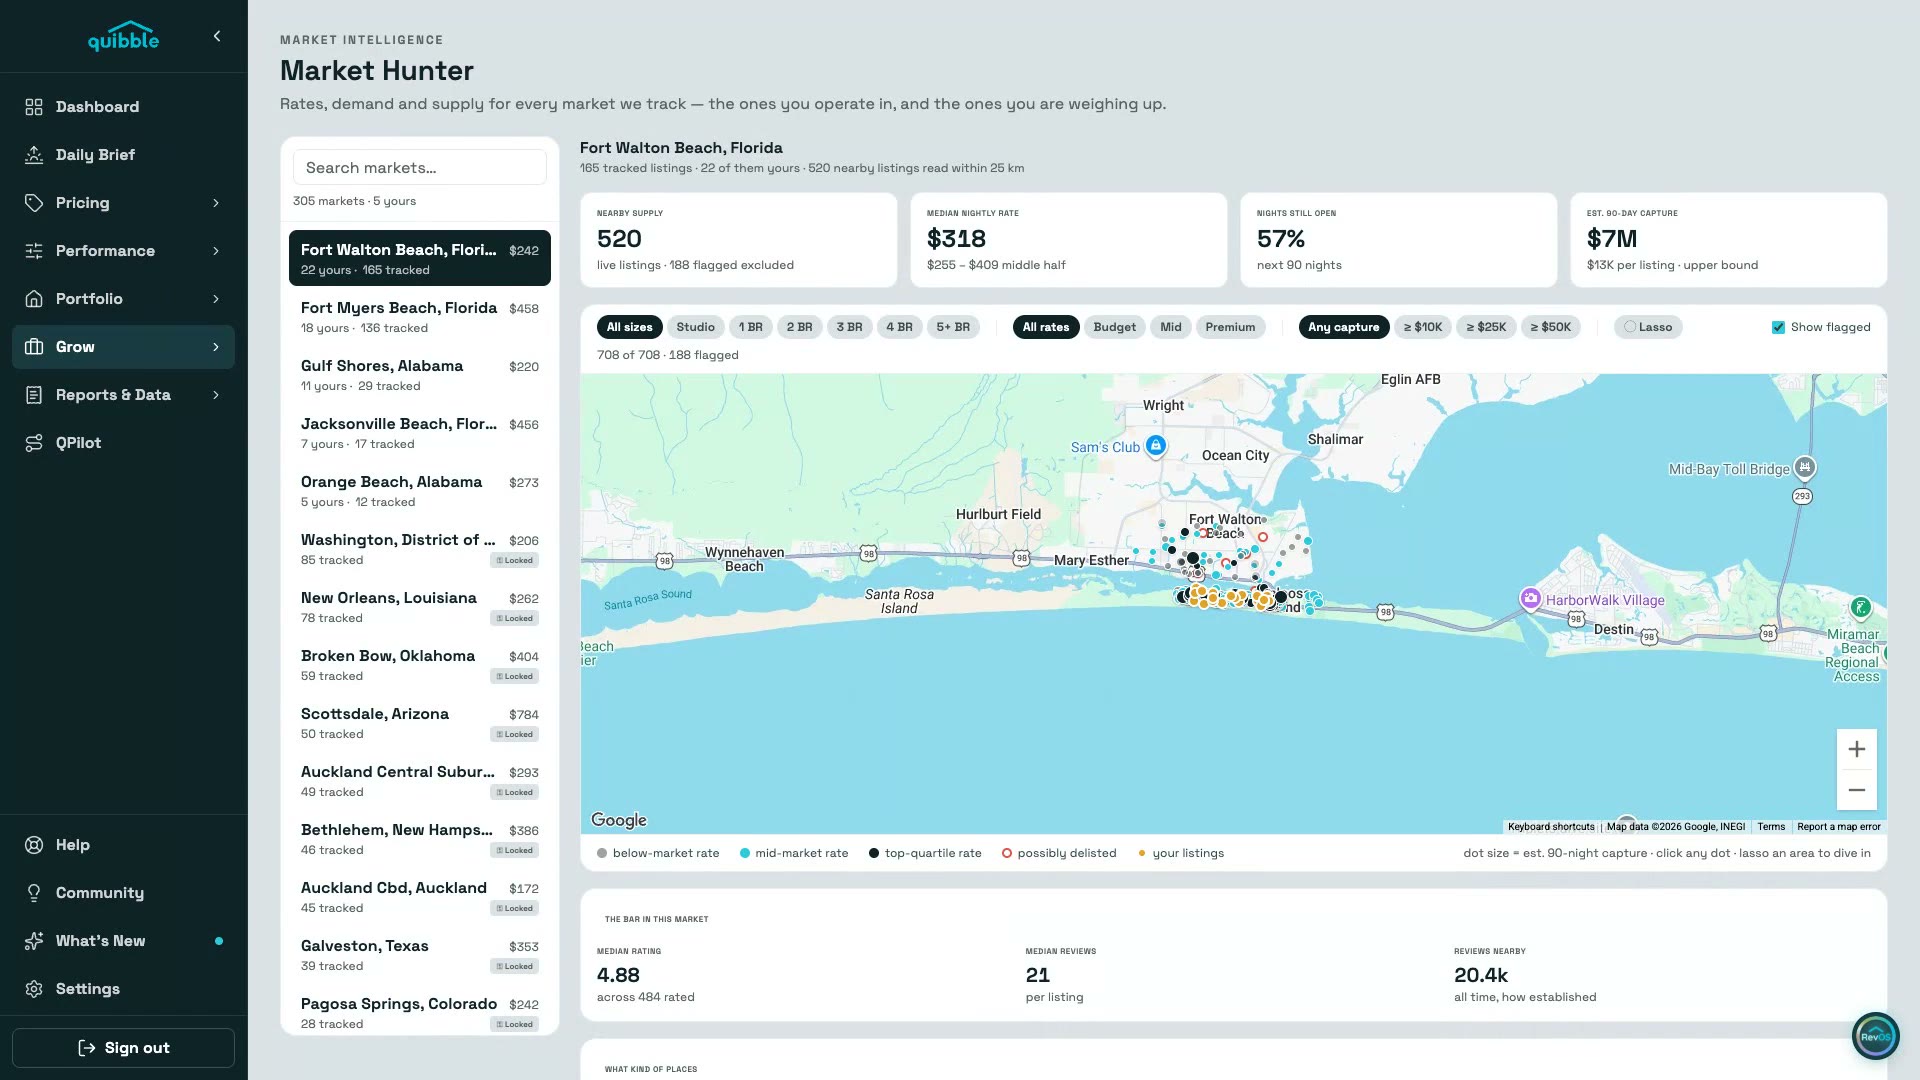
Market Hunter
The markets you operate in and the ones you’re weighing up — live supply, achievable rates, open nights, and the bar you’d have to clear, on a map you can lasso.
Explore →