What is Property Analytics and how to use it?
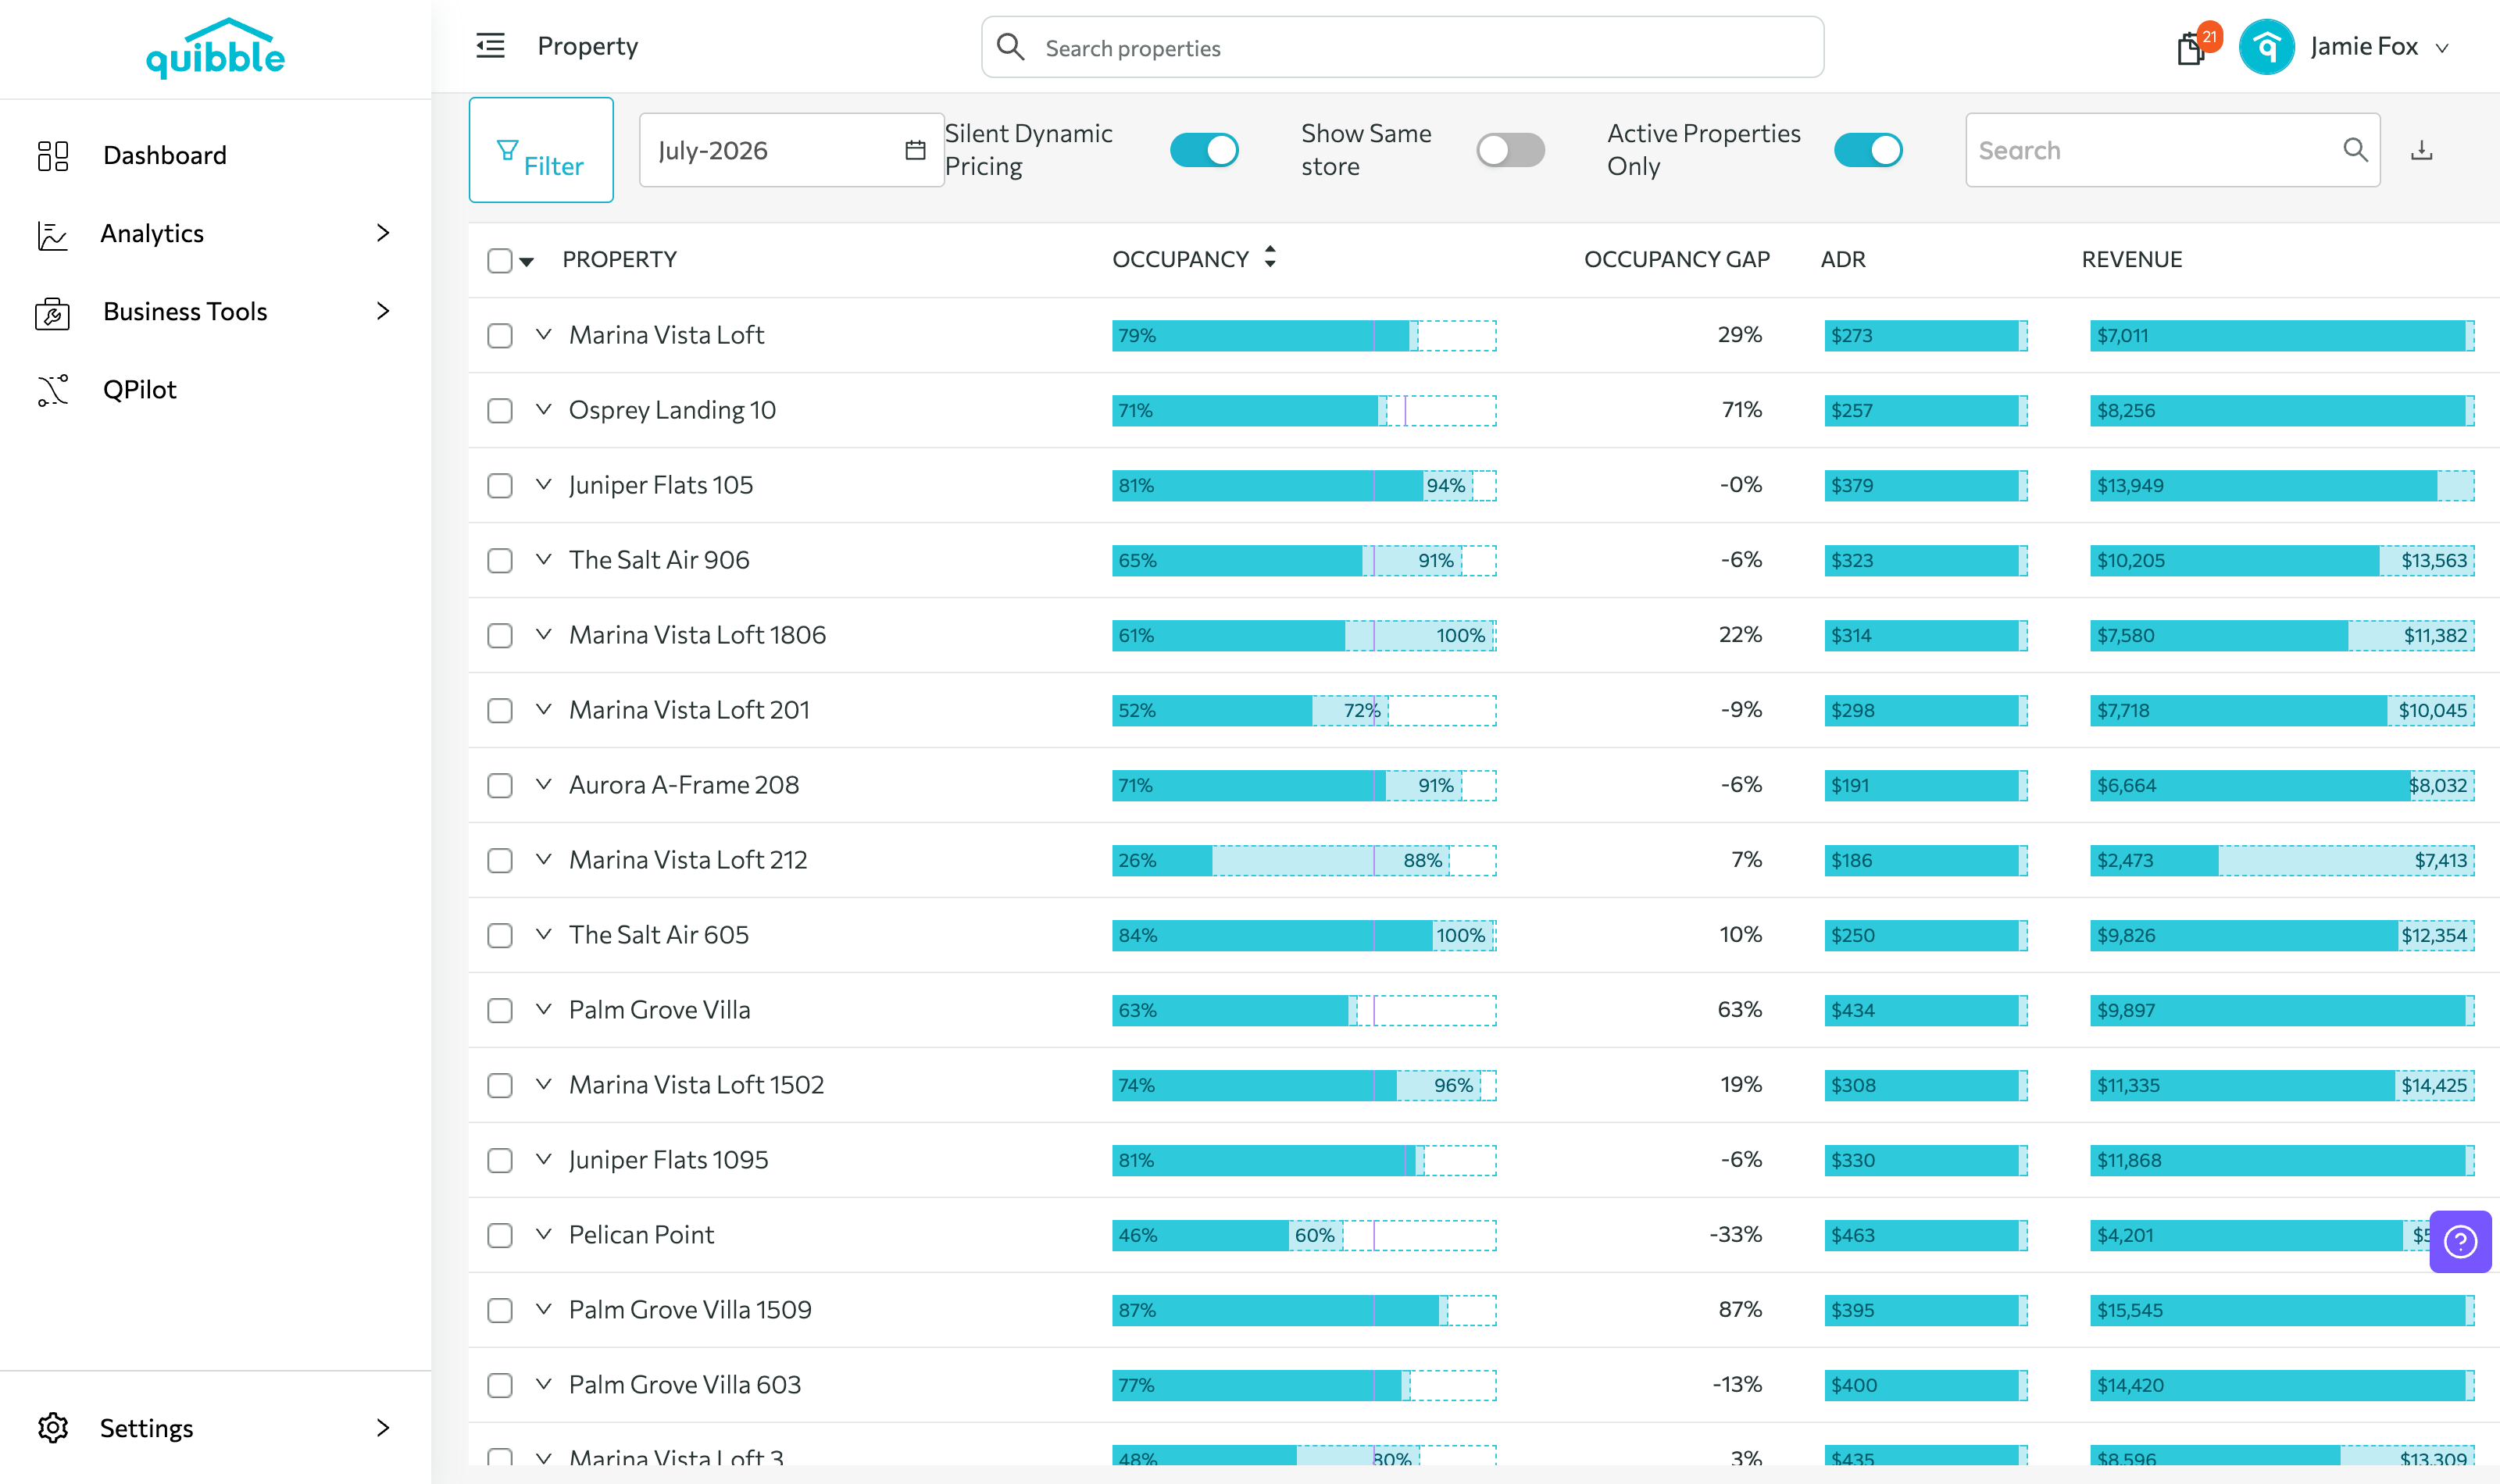
Property Analytics tracks each property’s key metrics — occupancy rate, gap, ADR, revenue, and blocked days.
Accessing Property Analytics
1
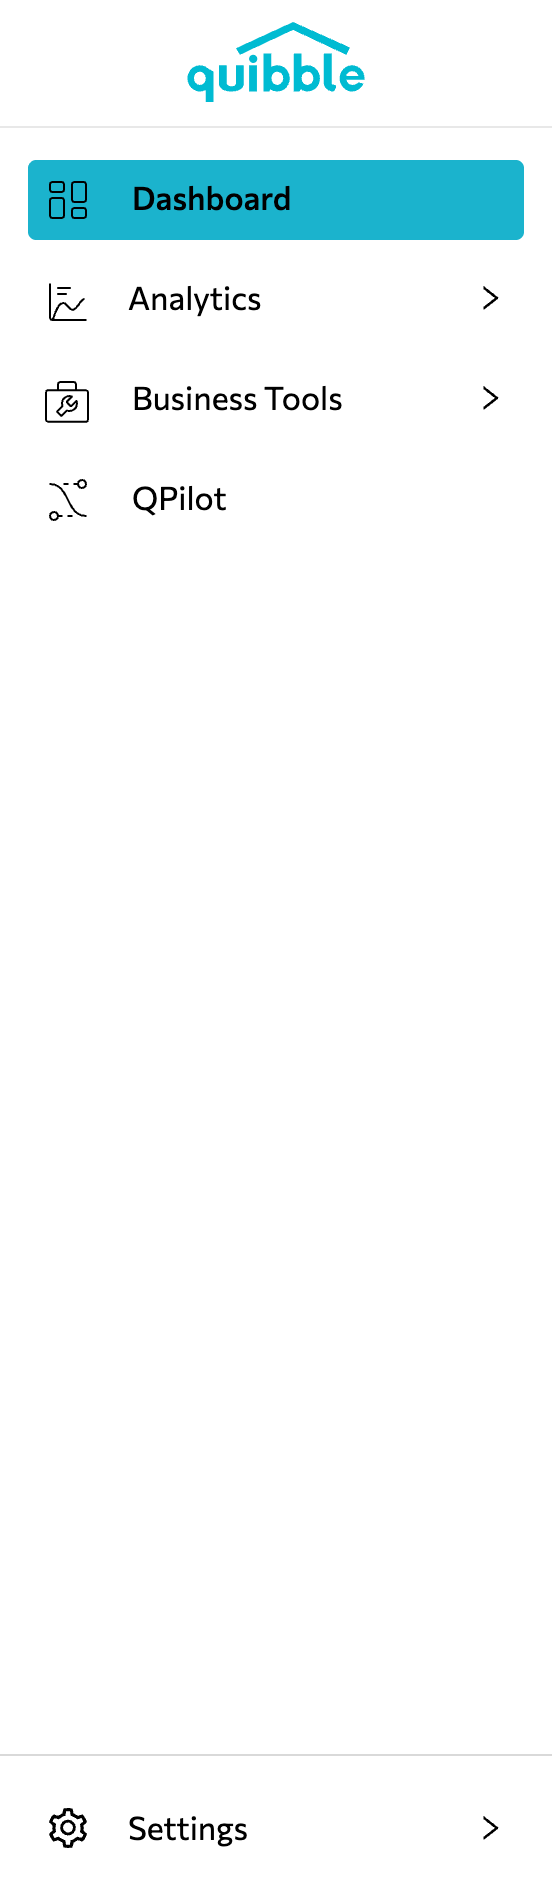
Open the left-side menu bar.
2
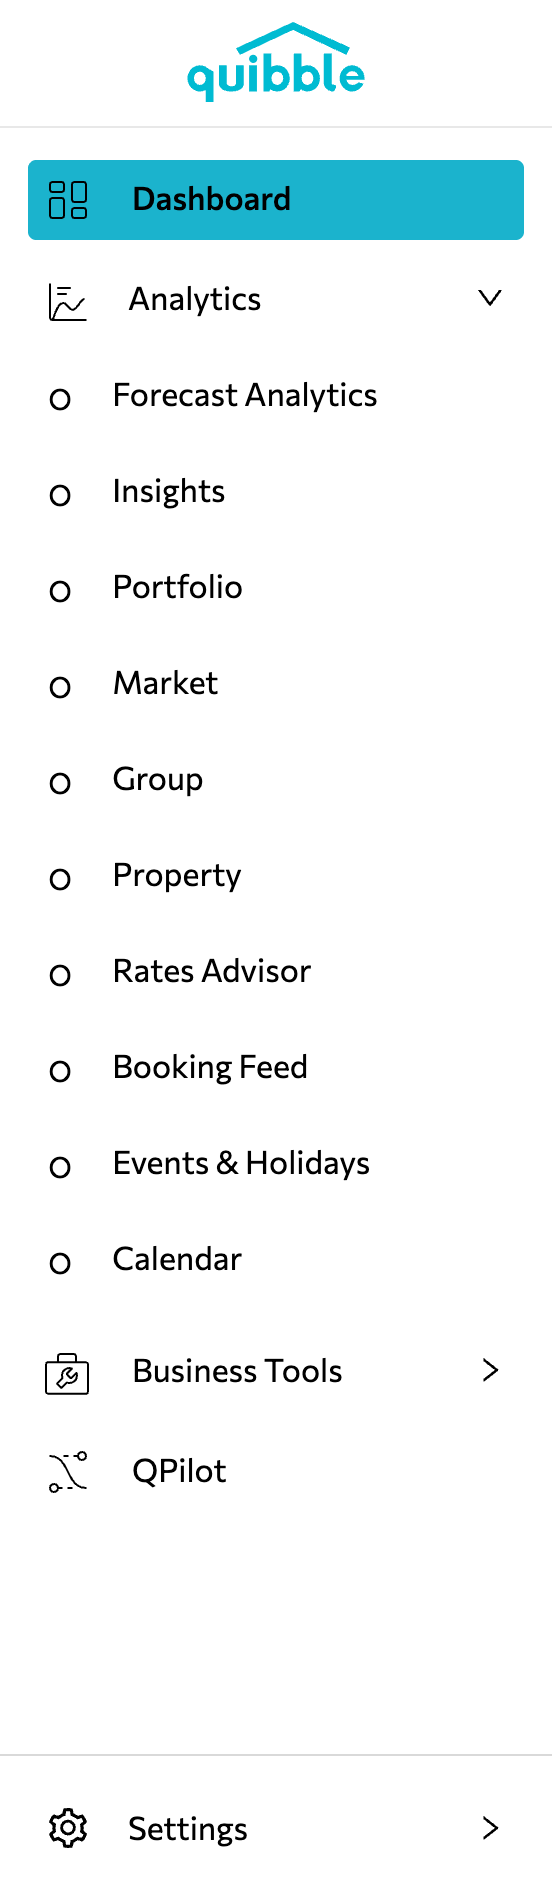
Click the Analytics dropdown and select Property.
Reading the list
1
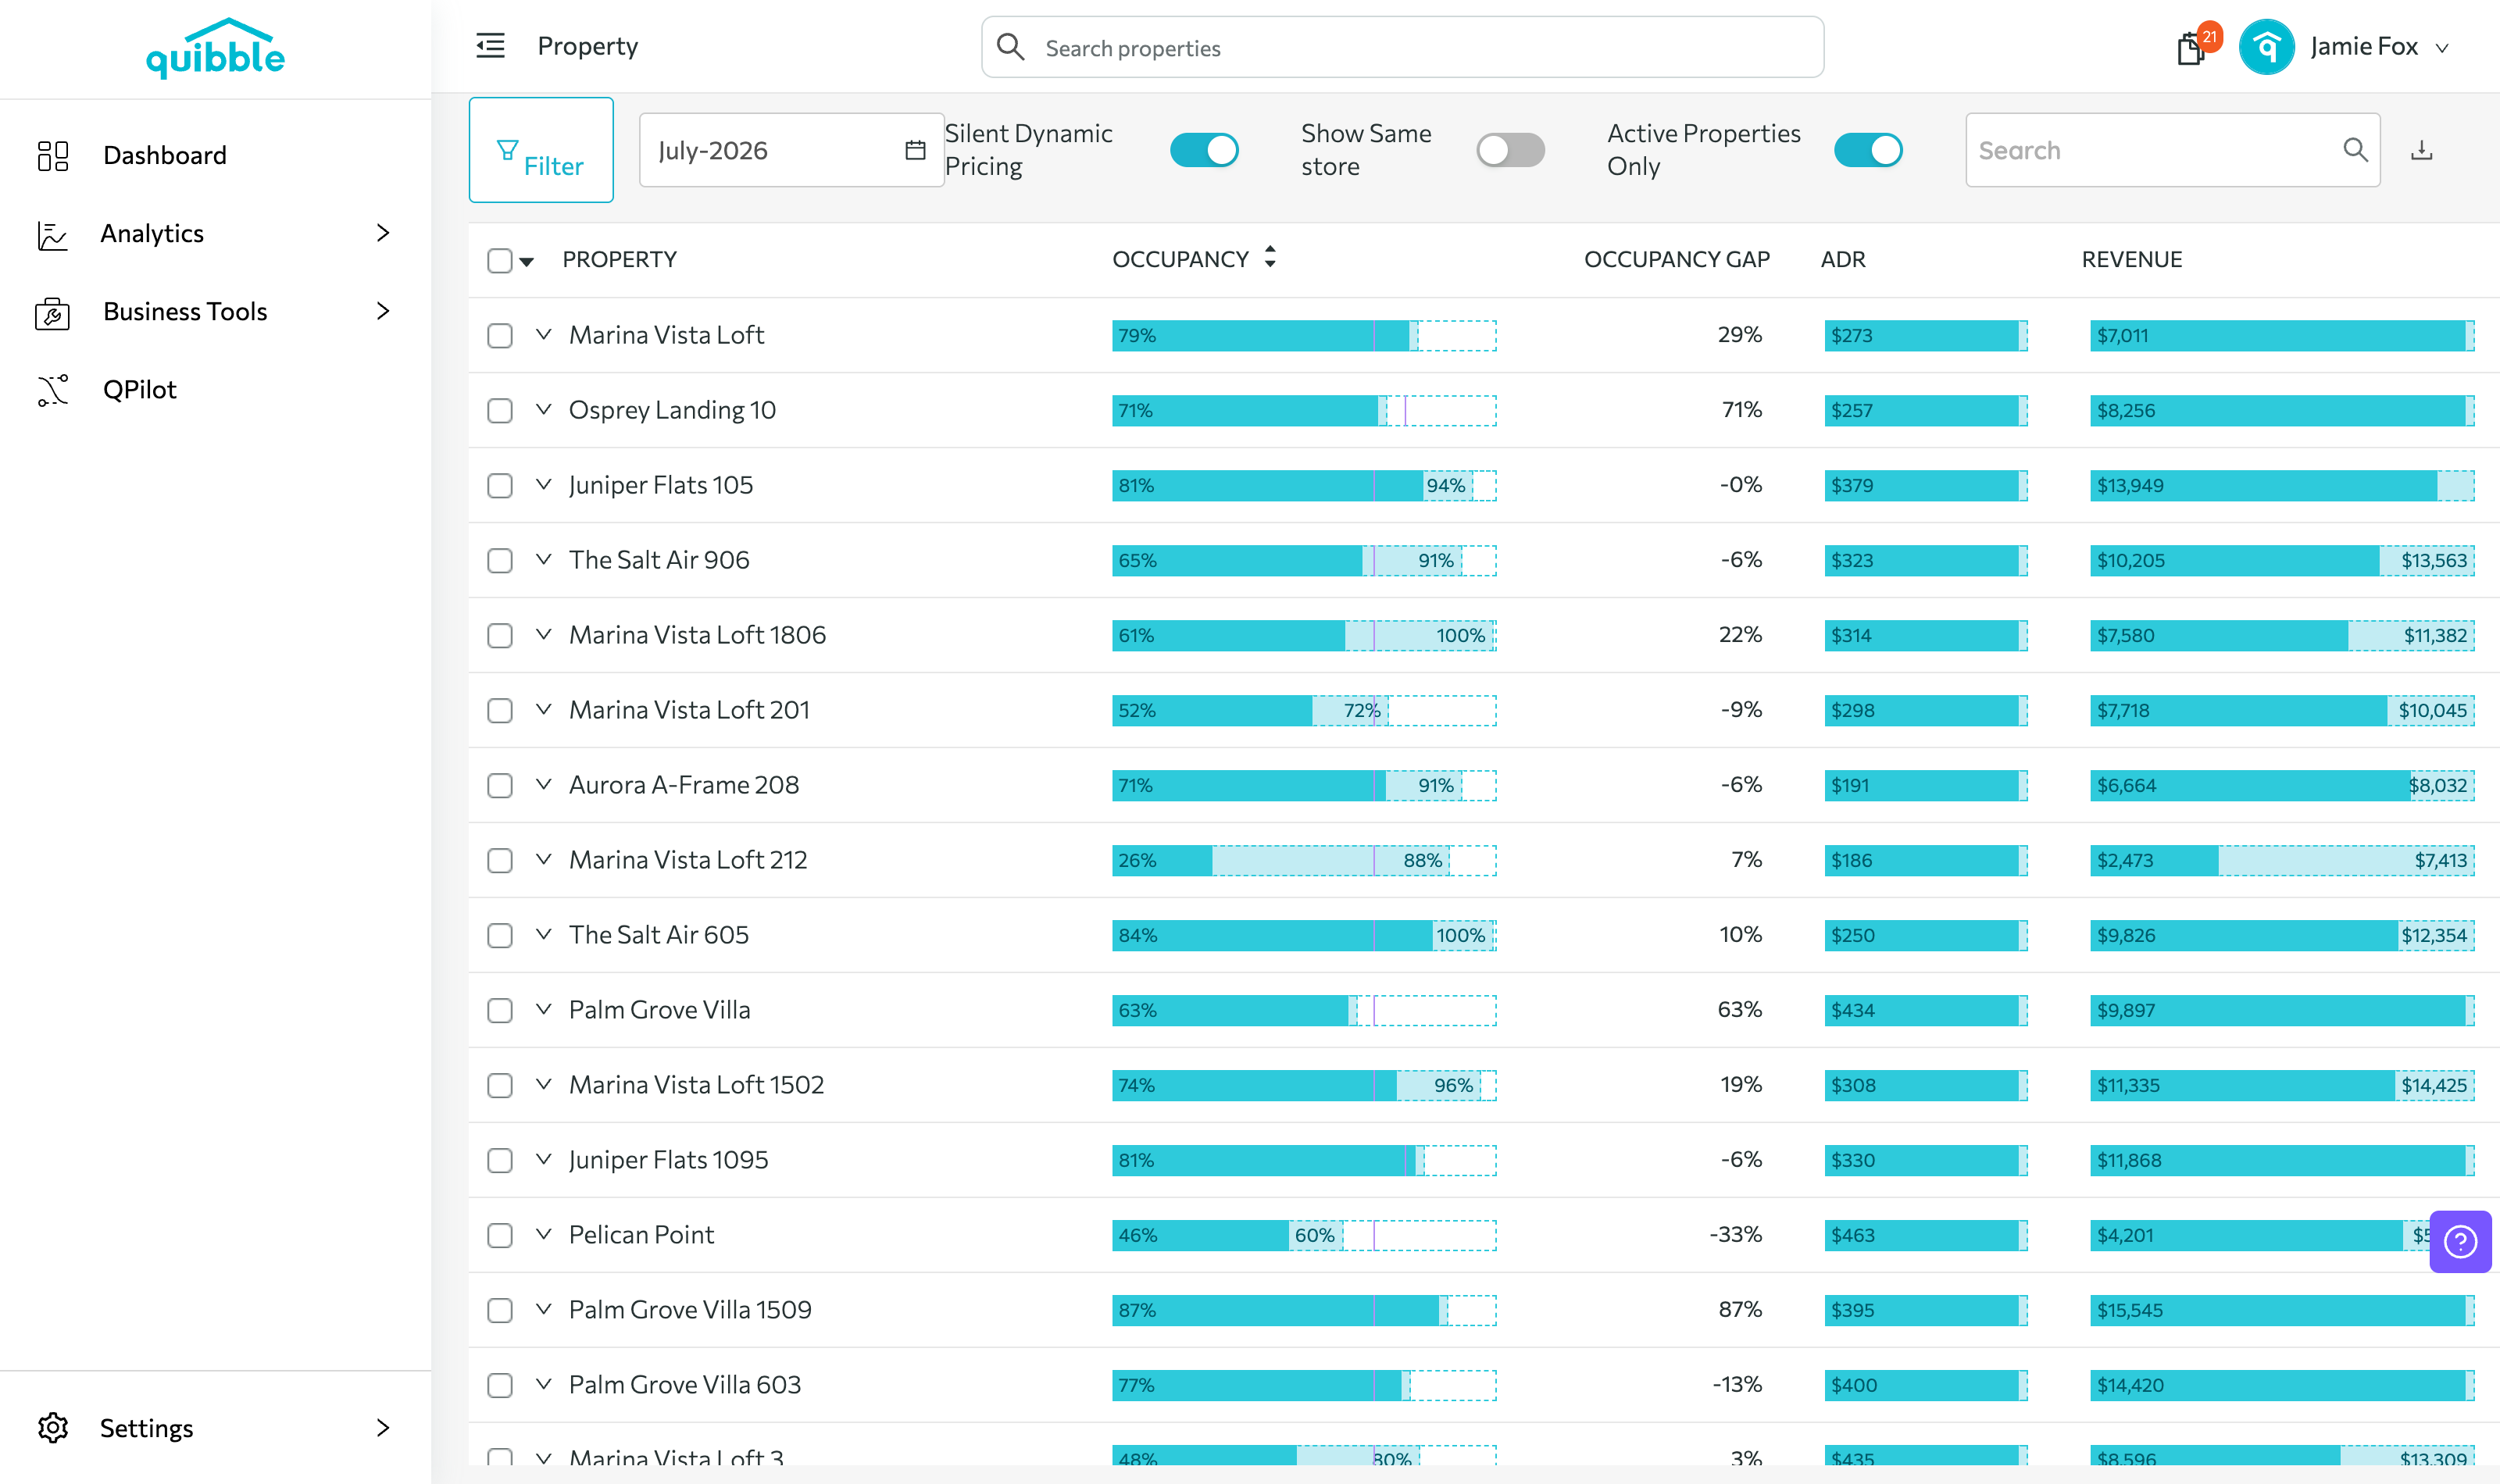
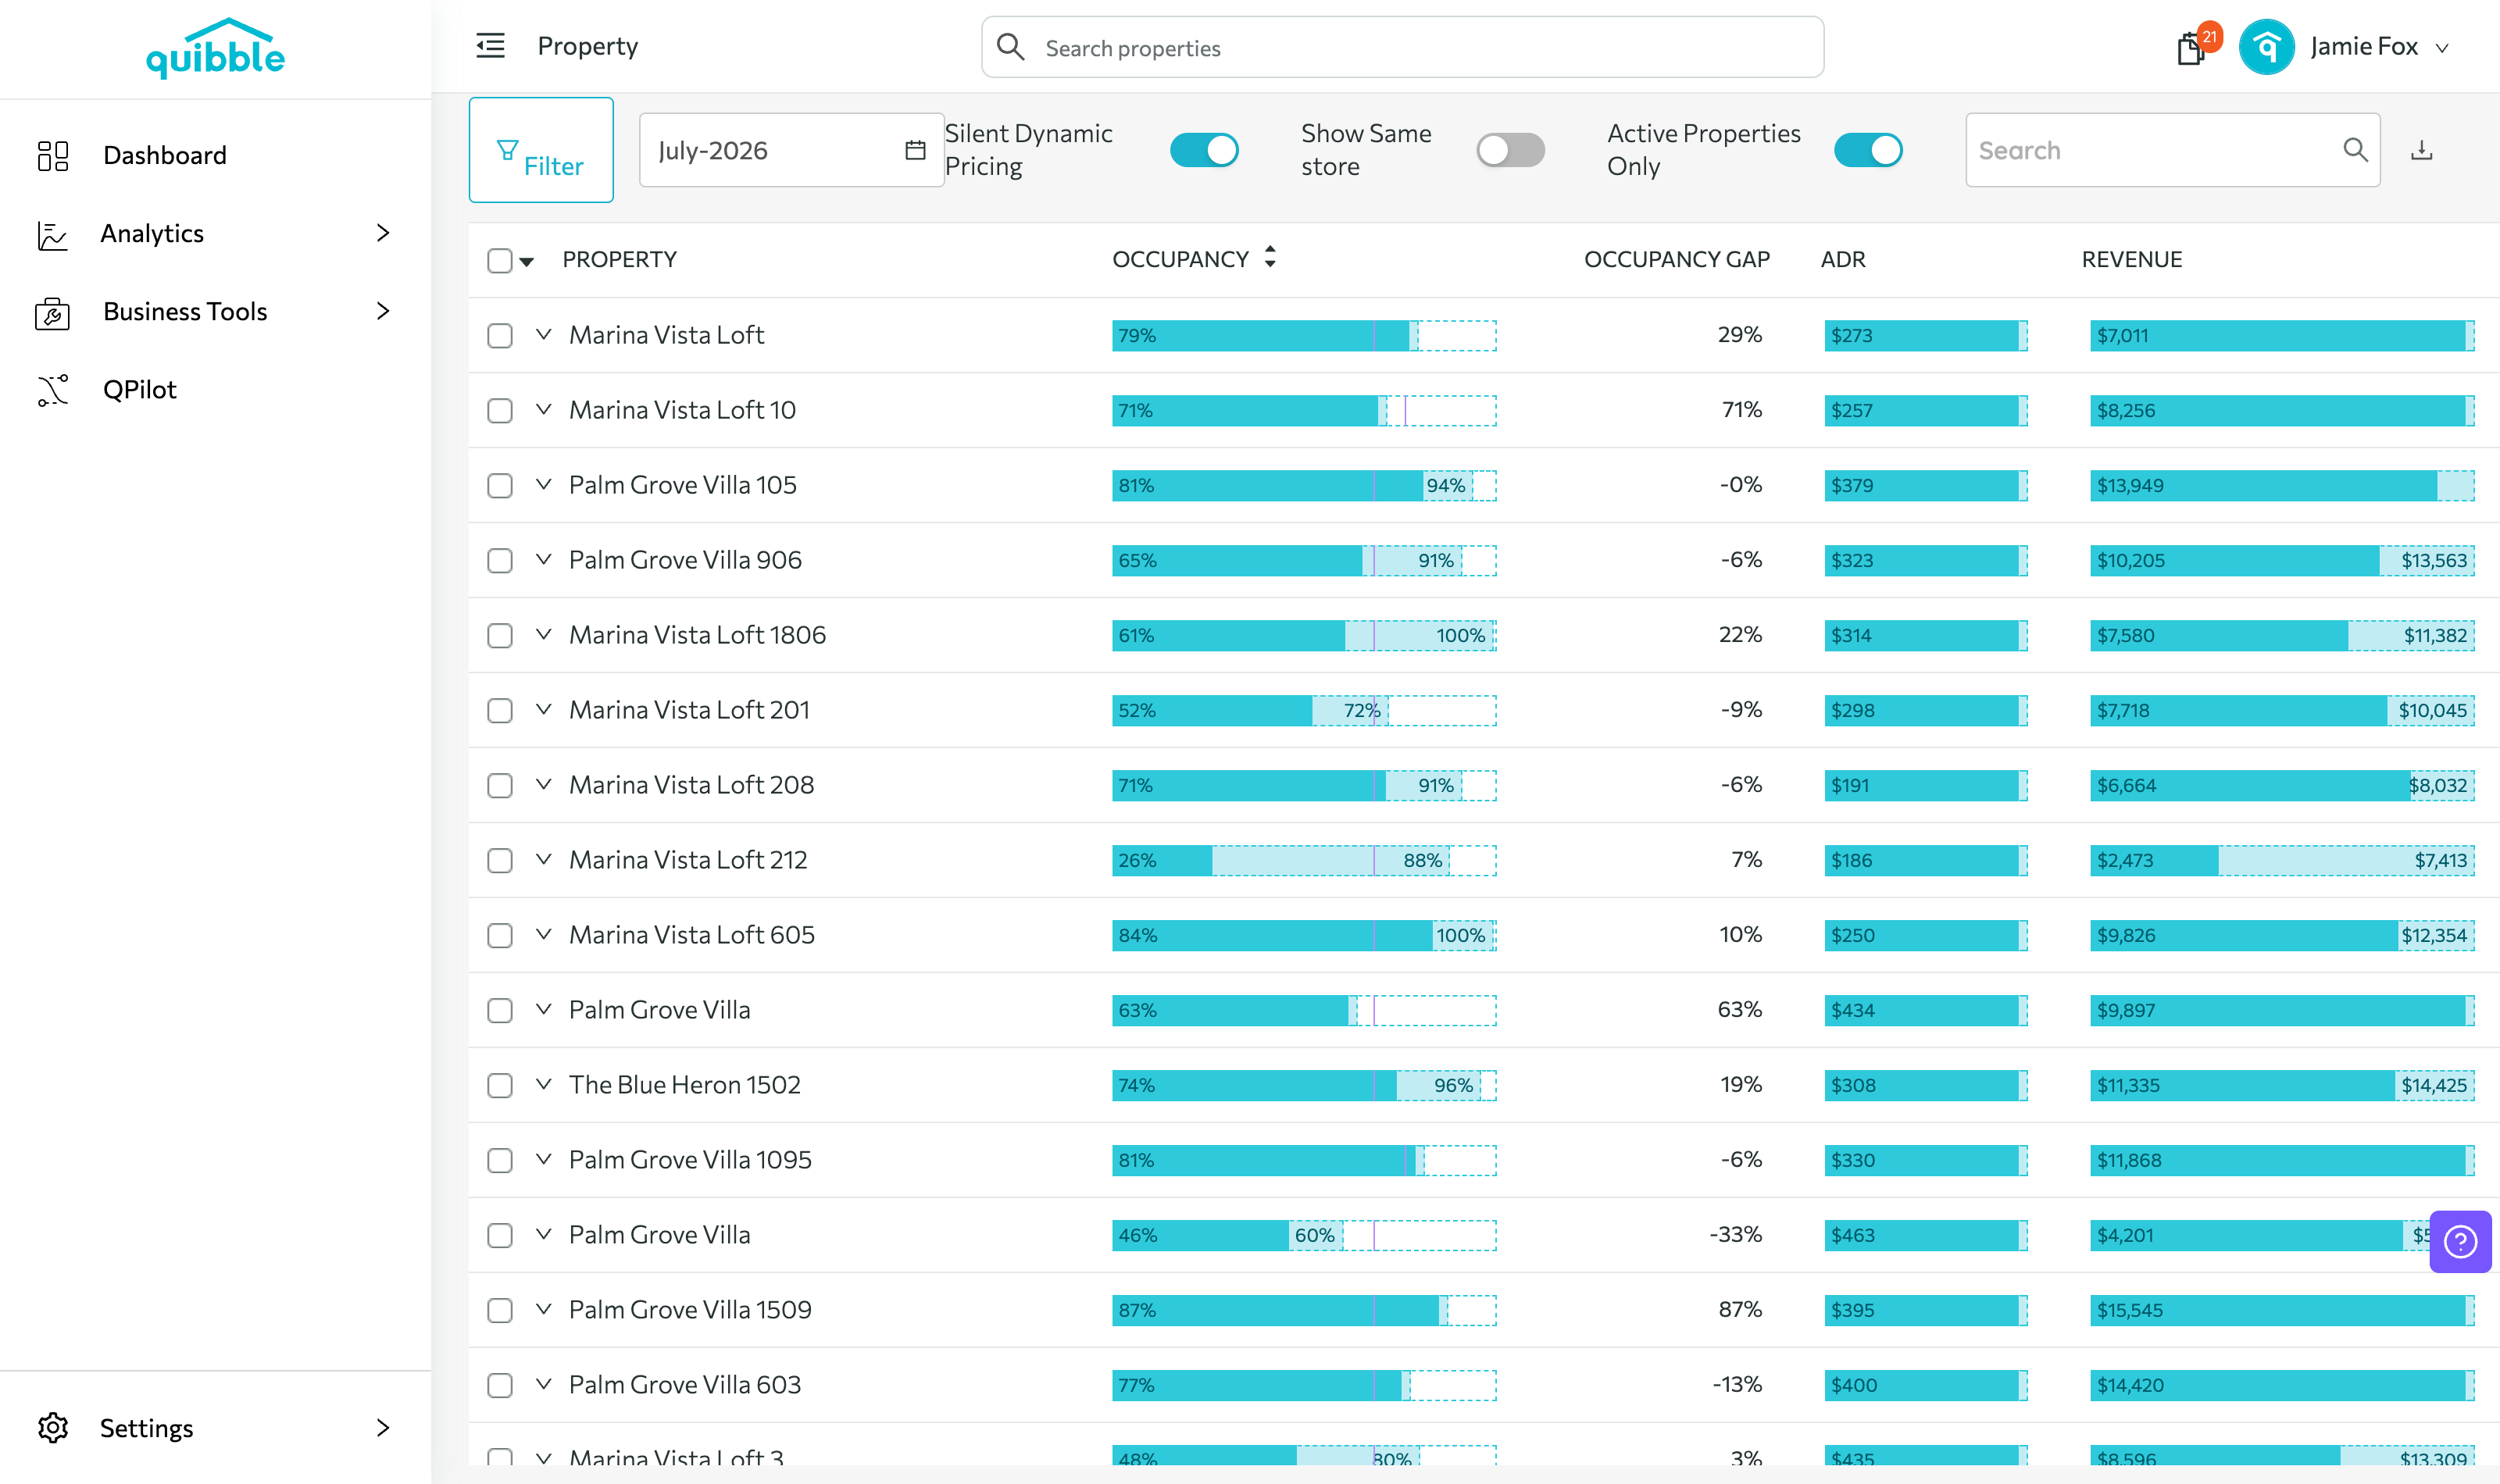
Every listing shows its occupancy (with the market shown as a dotted overlay), occupancy gap, ADR, and revenue.
2
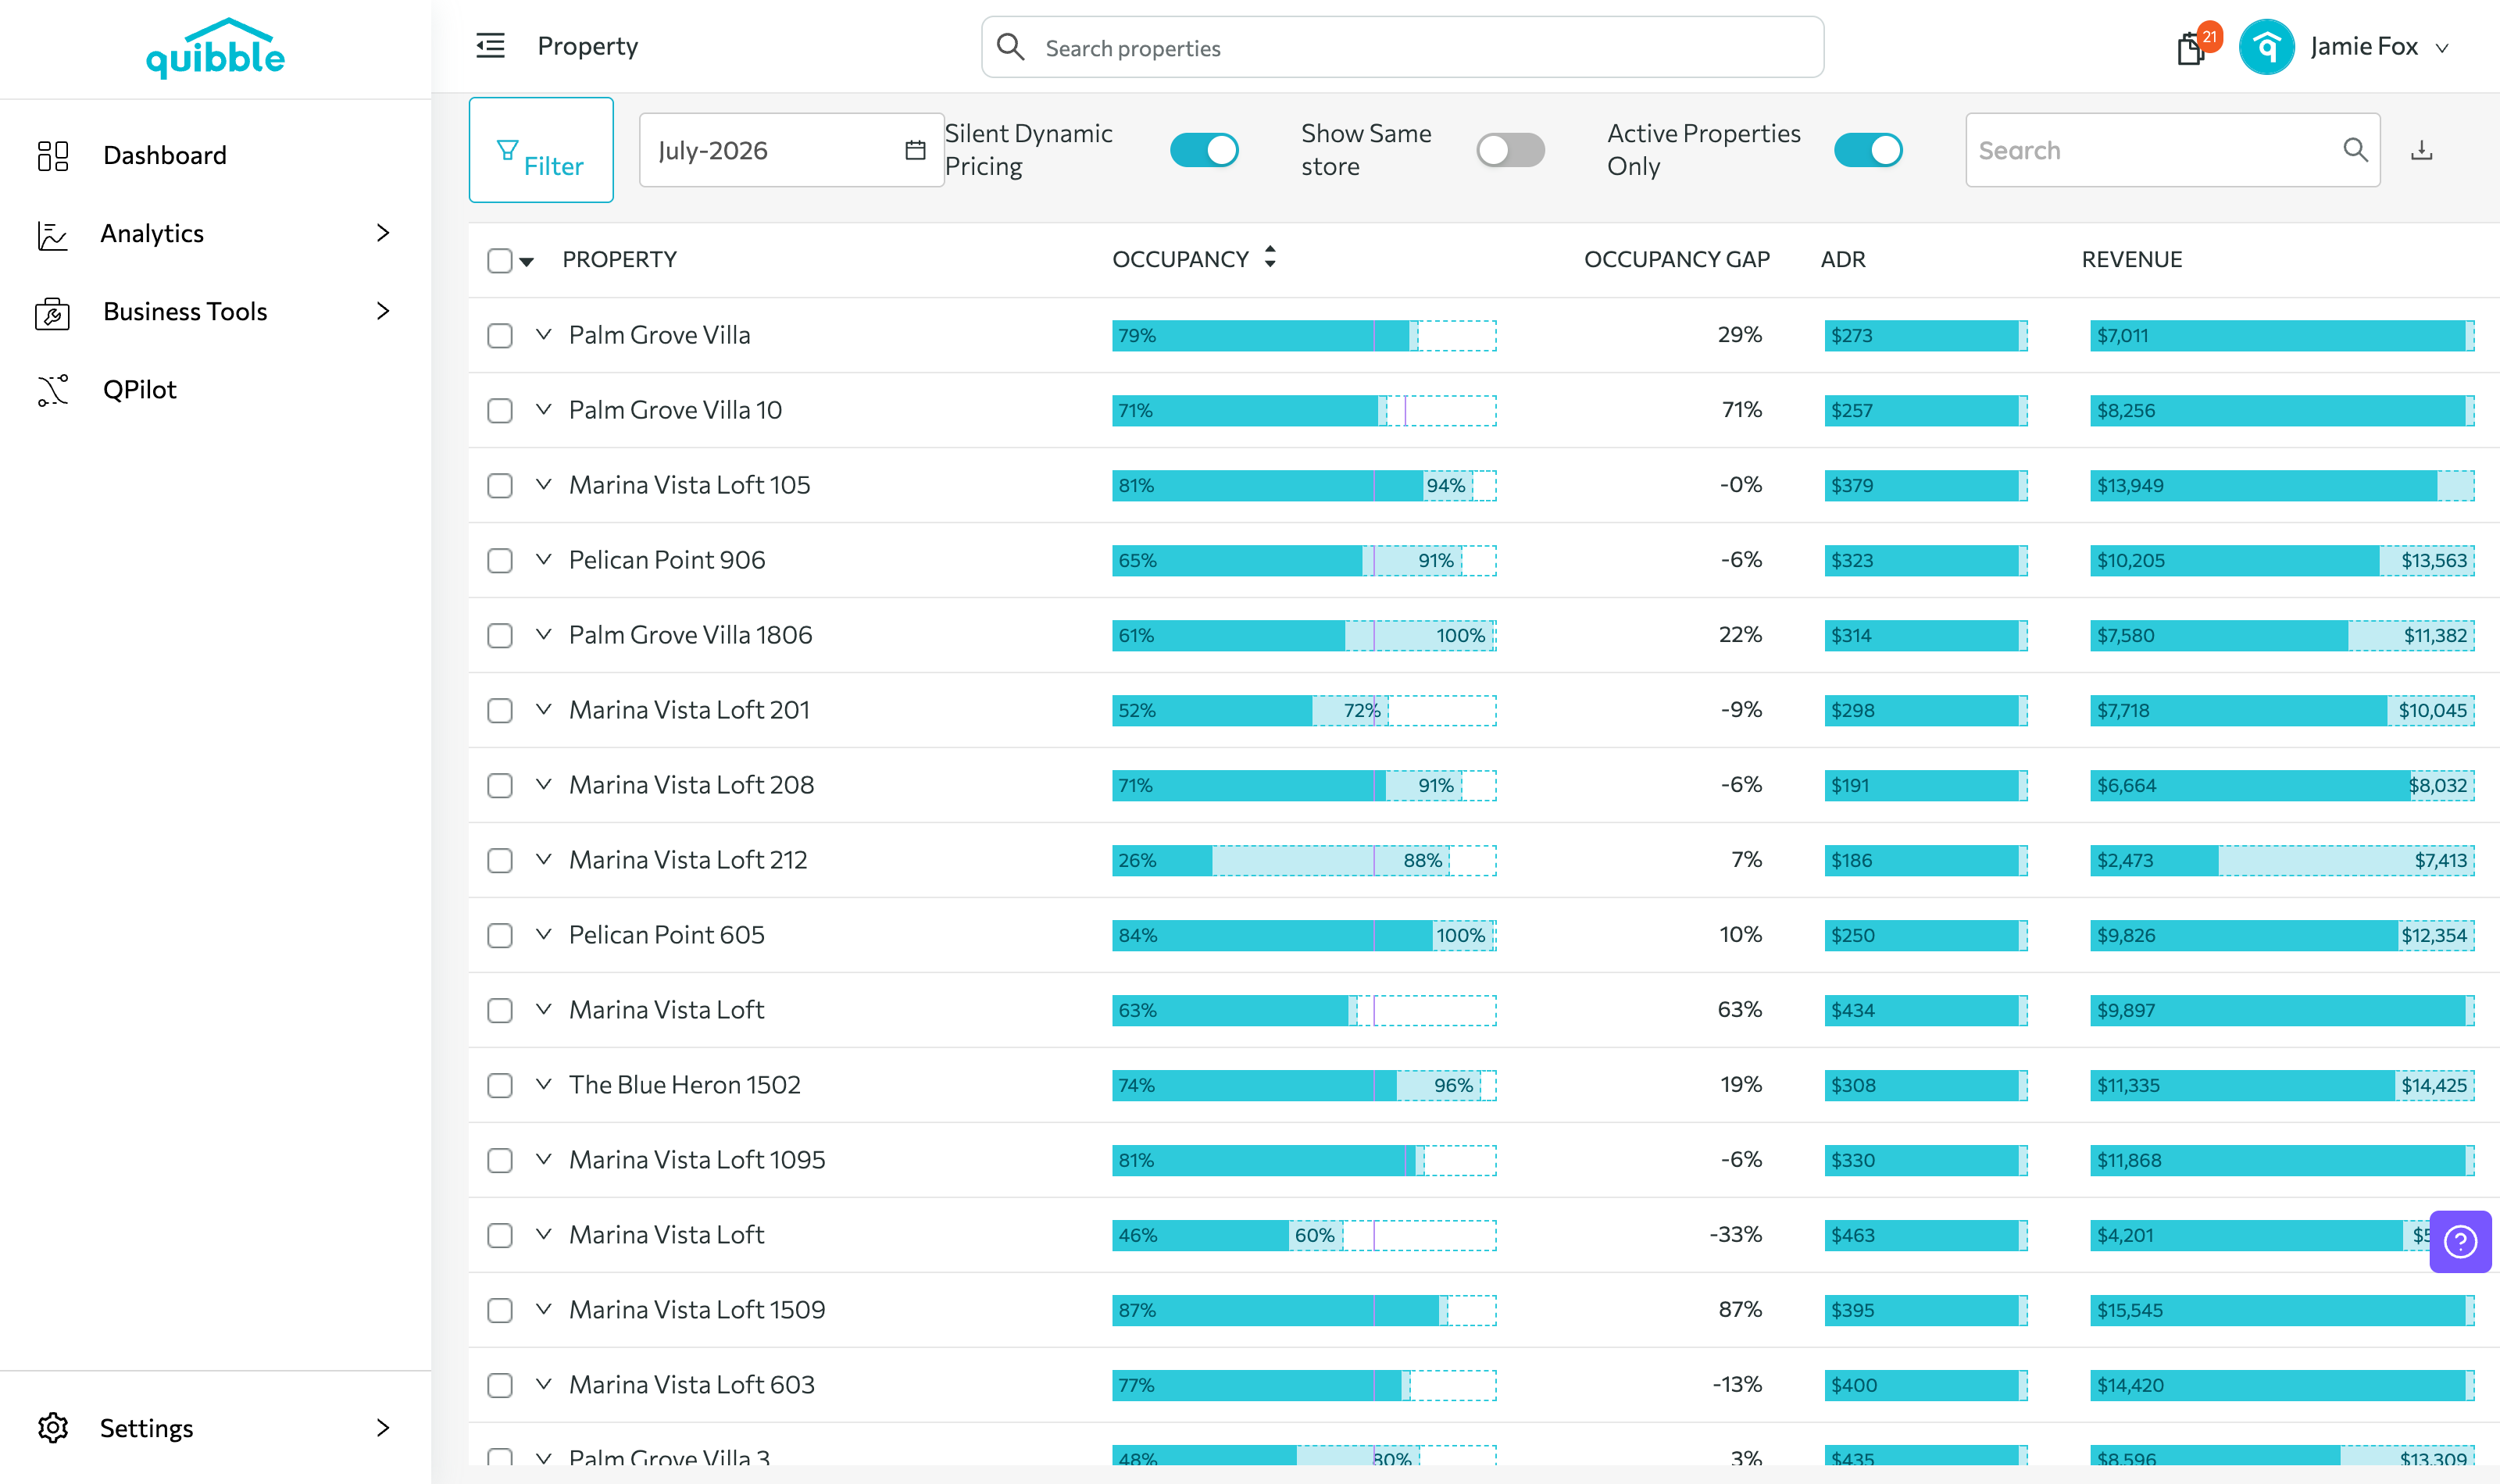
The occupancy gap compares year-over-year — how full the property is versus the same point last year.
Filtering
1
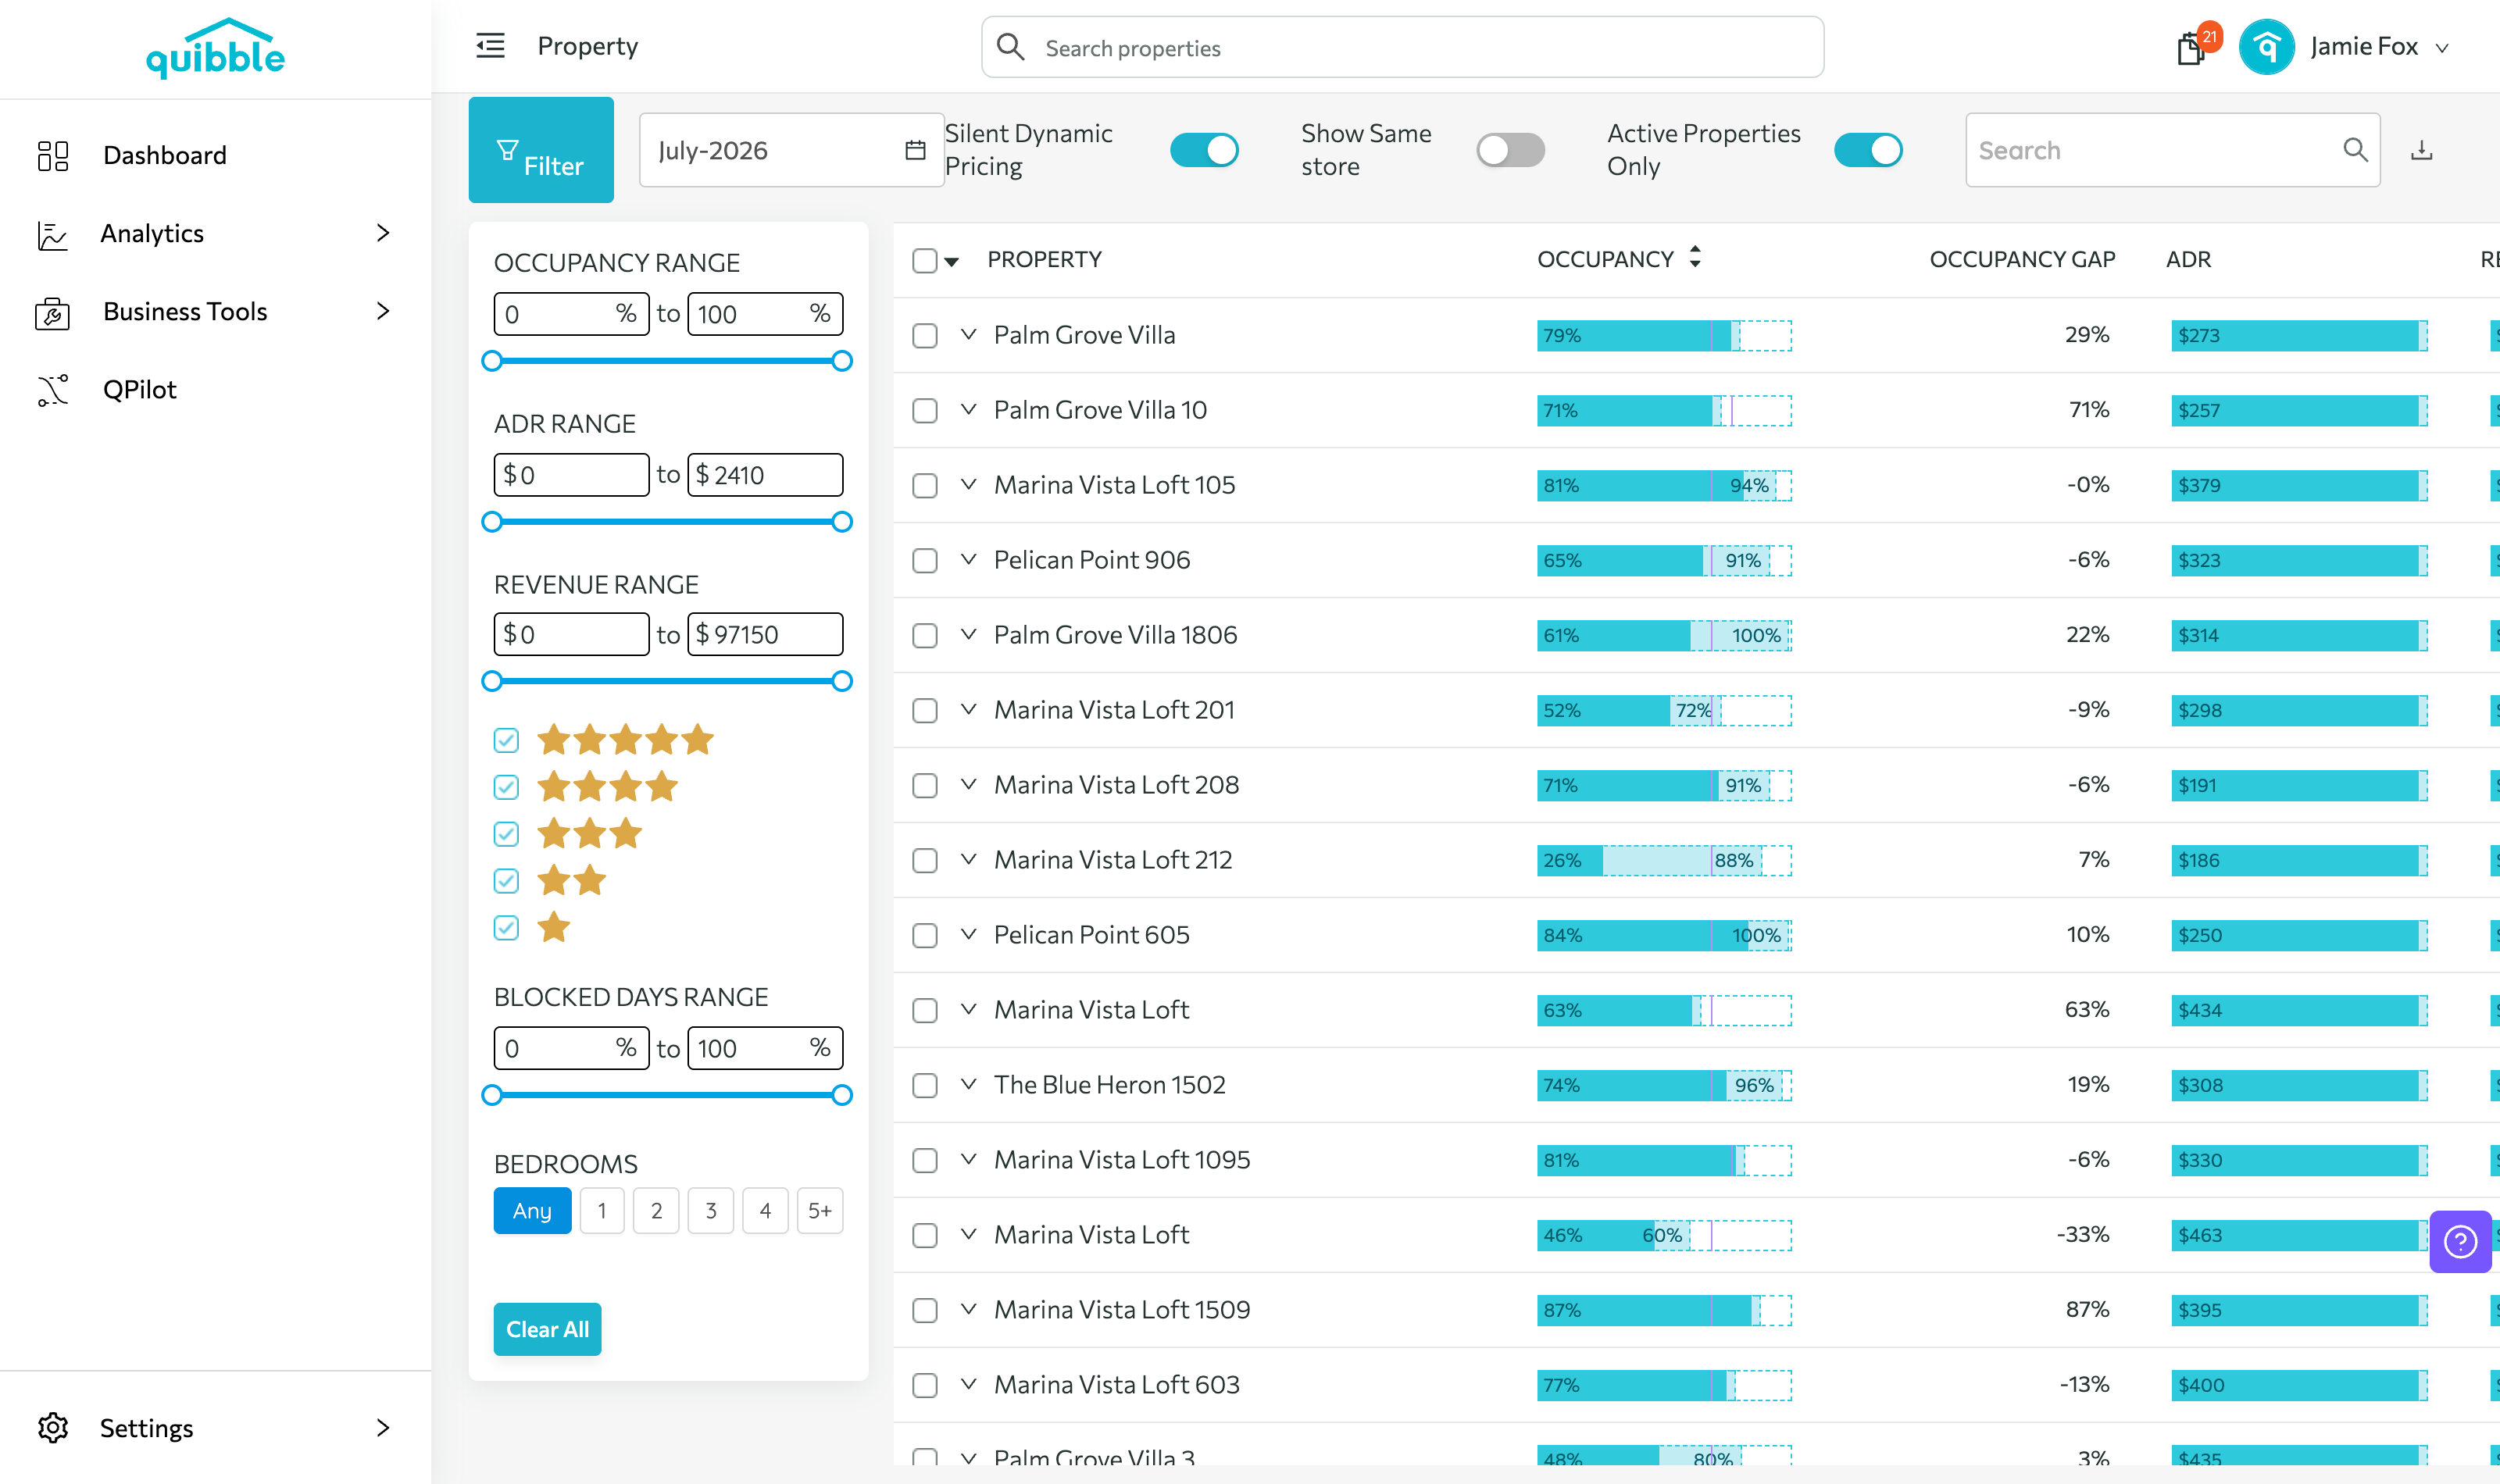
The Filter button narrows the list by occupancy, ADR, and revenue ranges, star ratings, blocked days, and bedrooms.
2
The header toggles limit the view: Silent Dynamic Pricing, Show Same Store (only properties present both years), and Active Properties Only.
3
Use the search box to jump to a listing, and the download icon (upper right) to export the table.
Didn’t find what you needed? Contact us.