Understanding the Dashboard
The Dashboard is the first thing you see after signing in — a one-screen read on how the portfolio is doing and what to work on next.
1
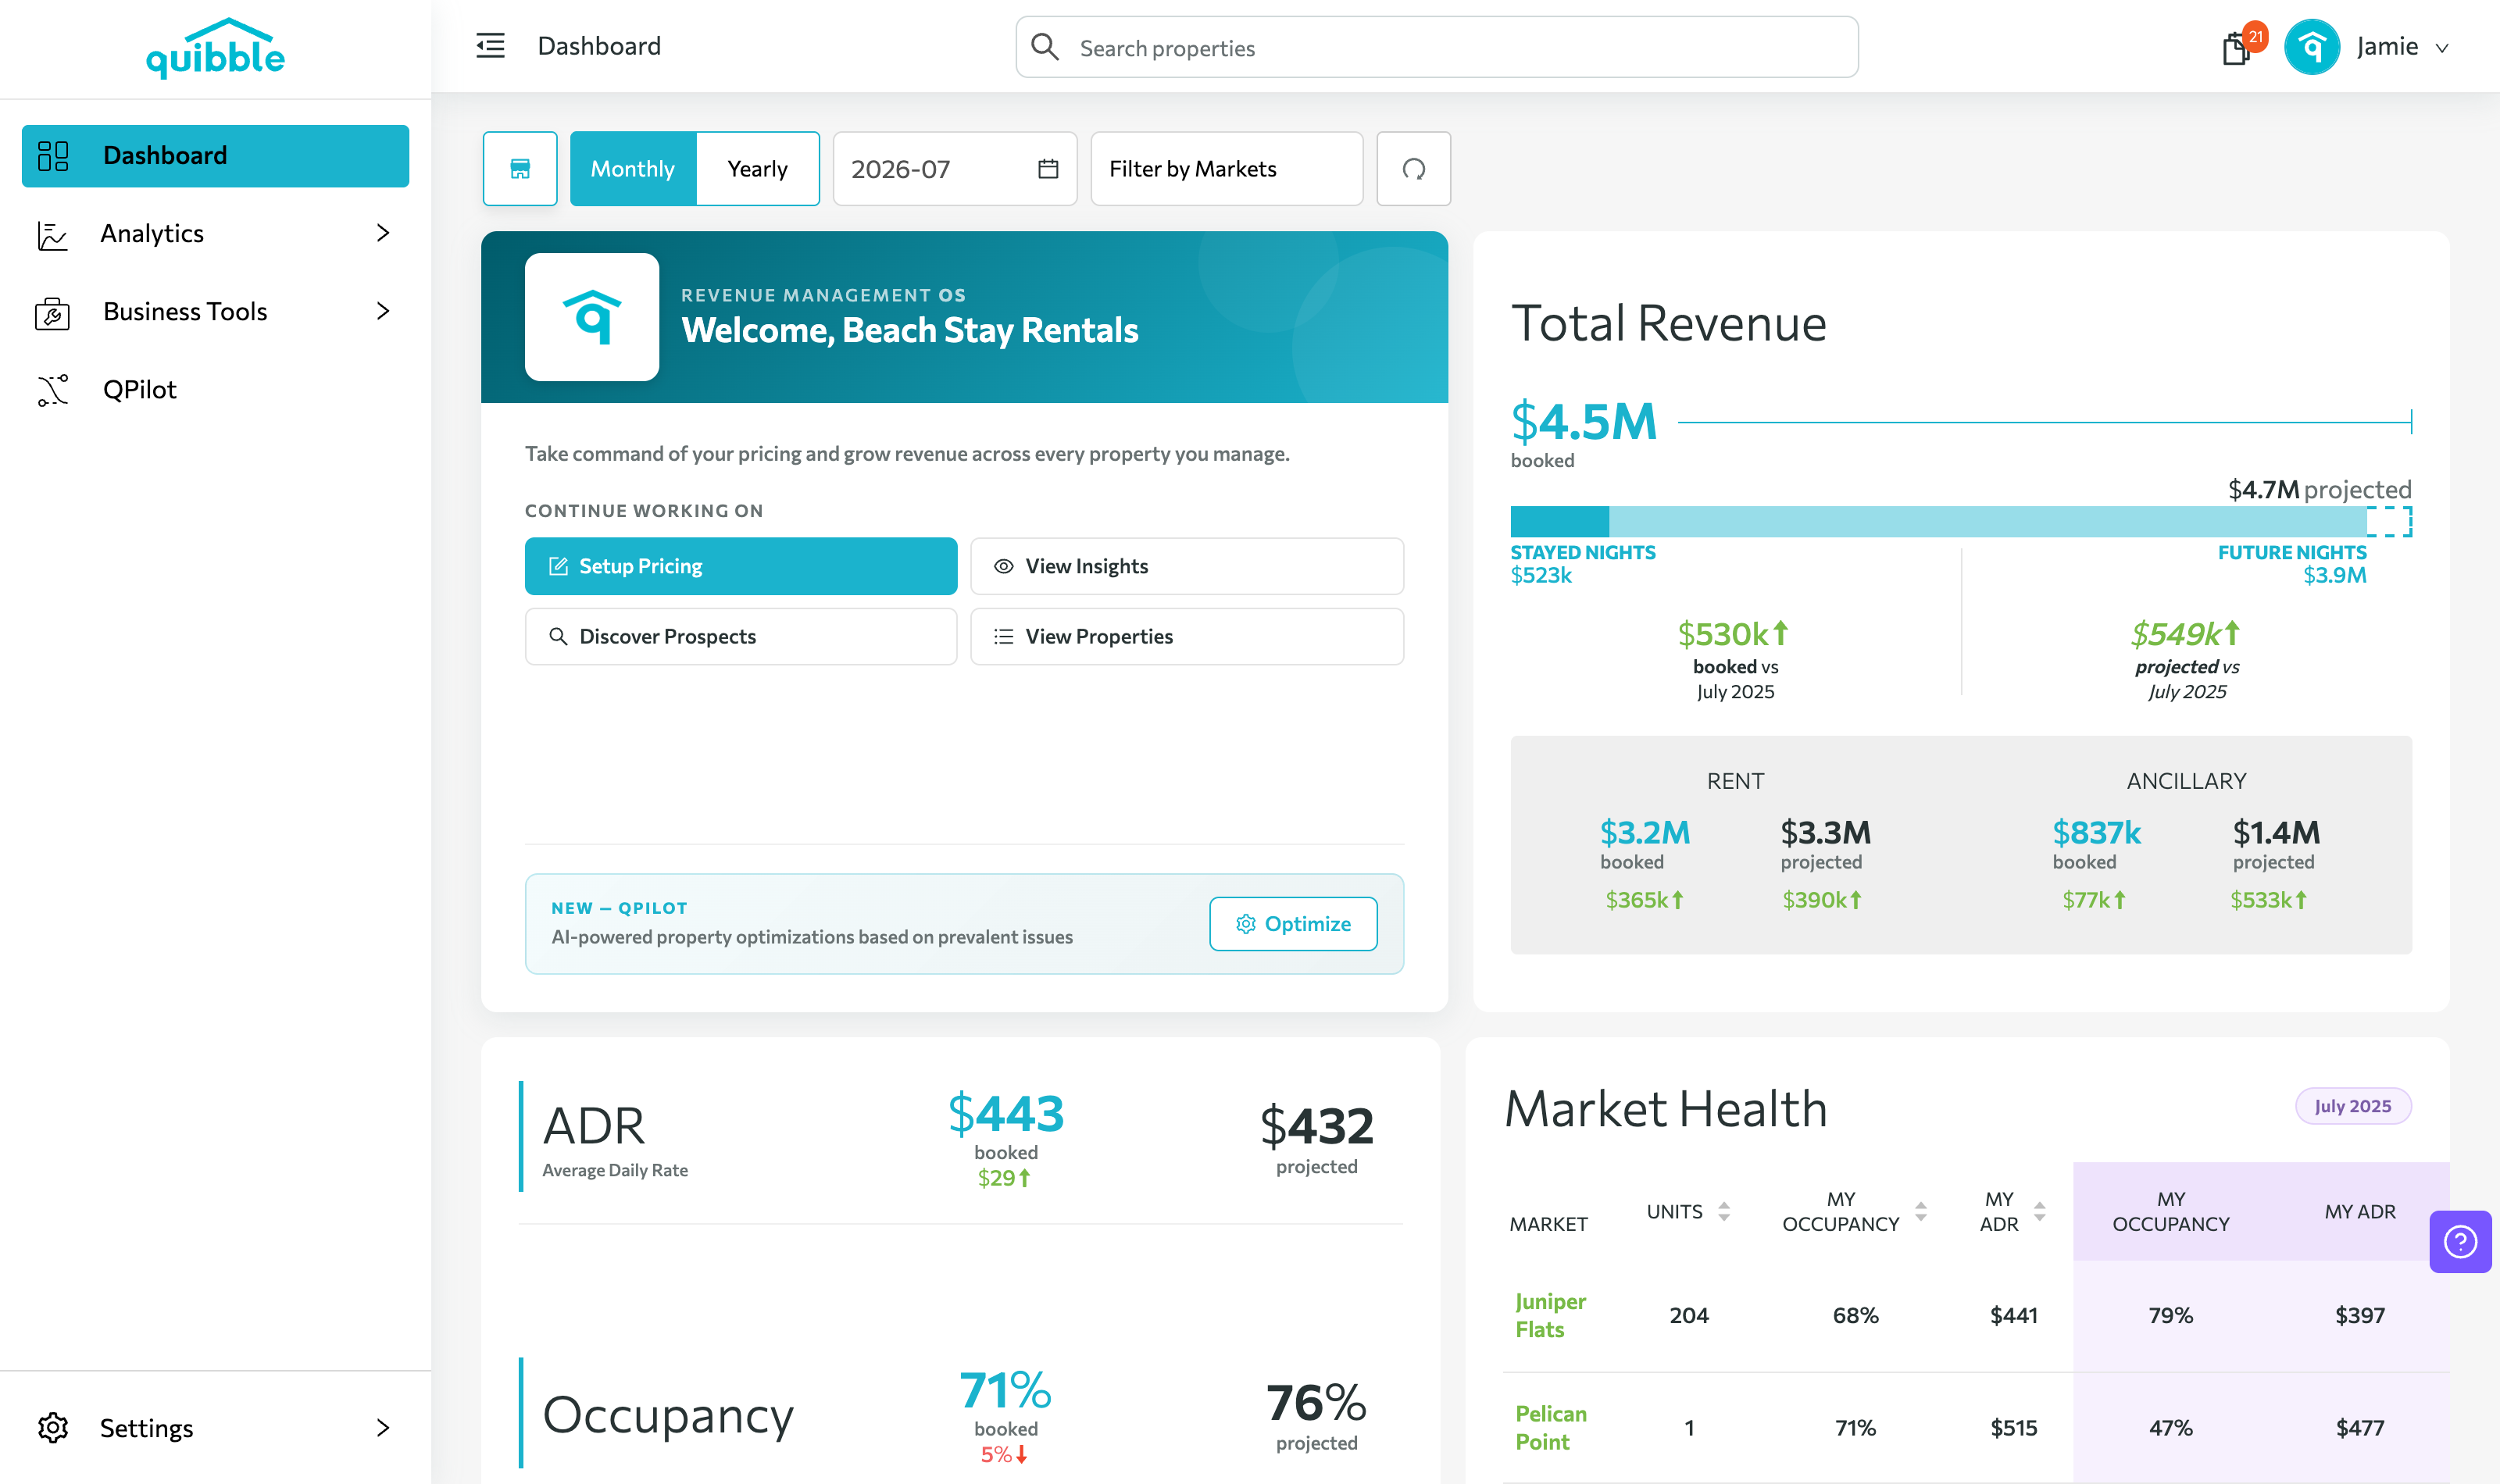
Total Revenue shows booked and projected revenue side by side, split across stayed and future nights.
2
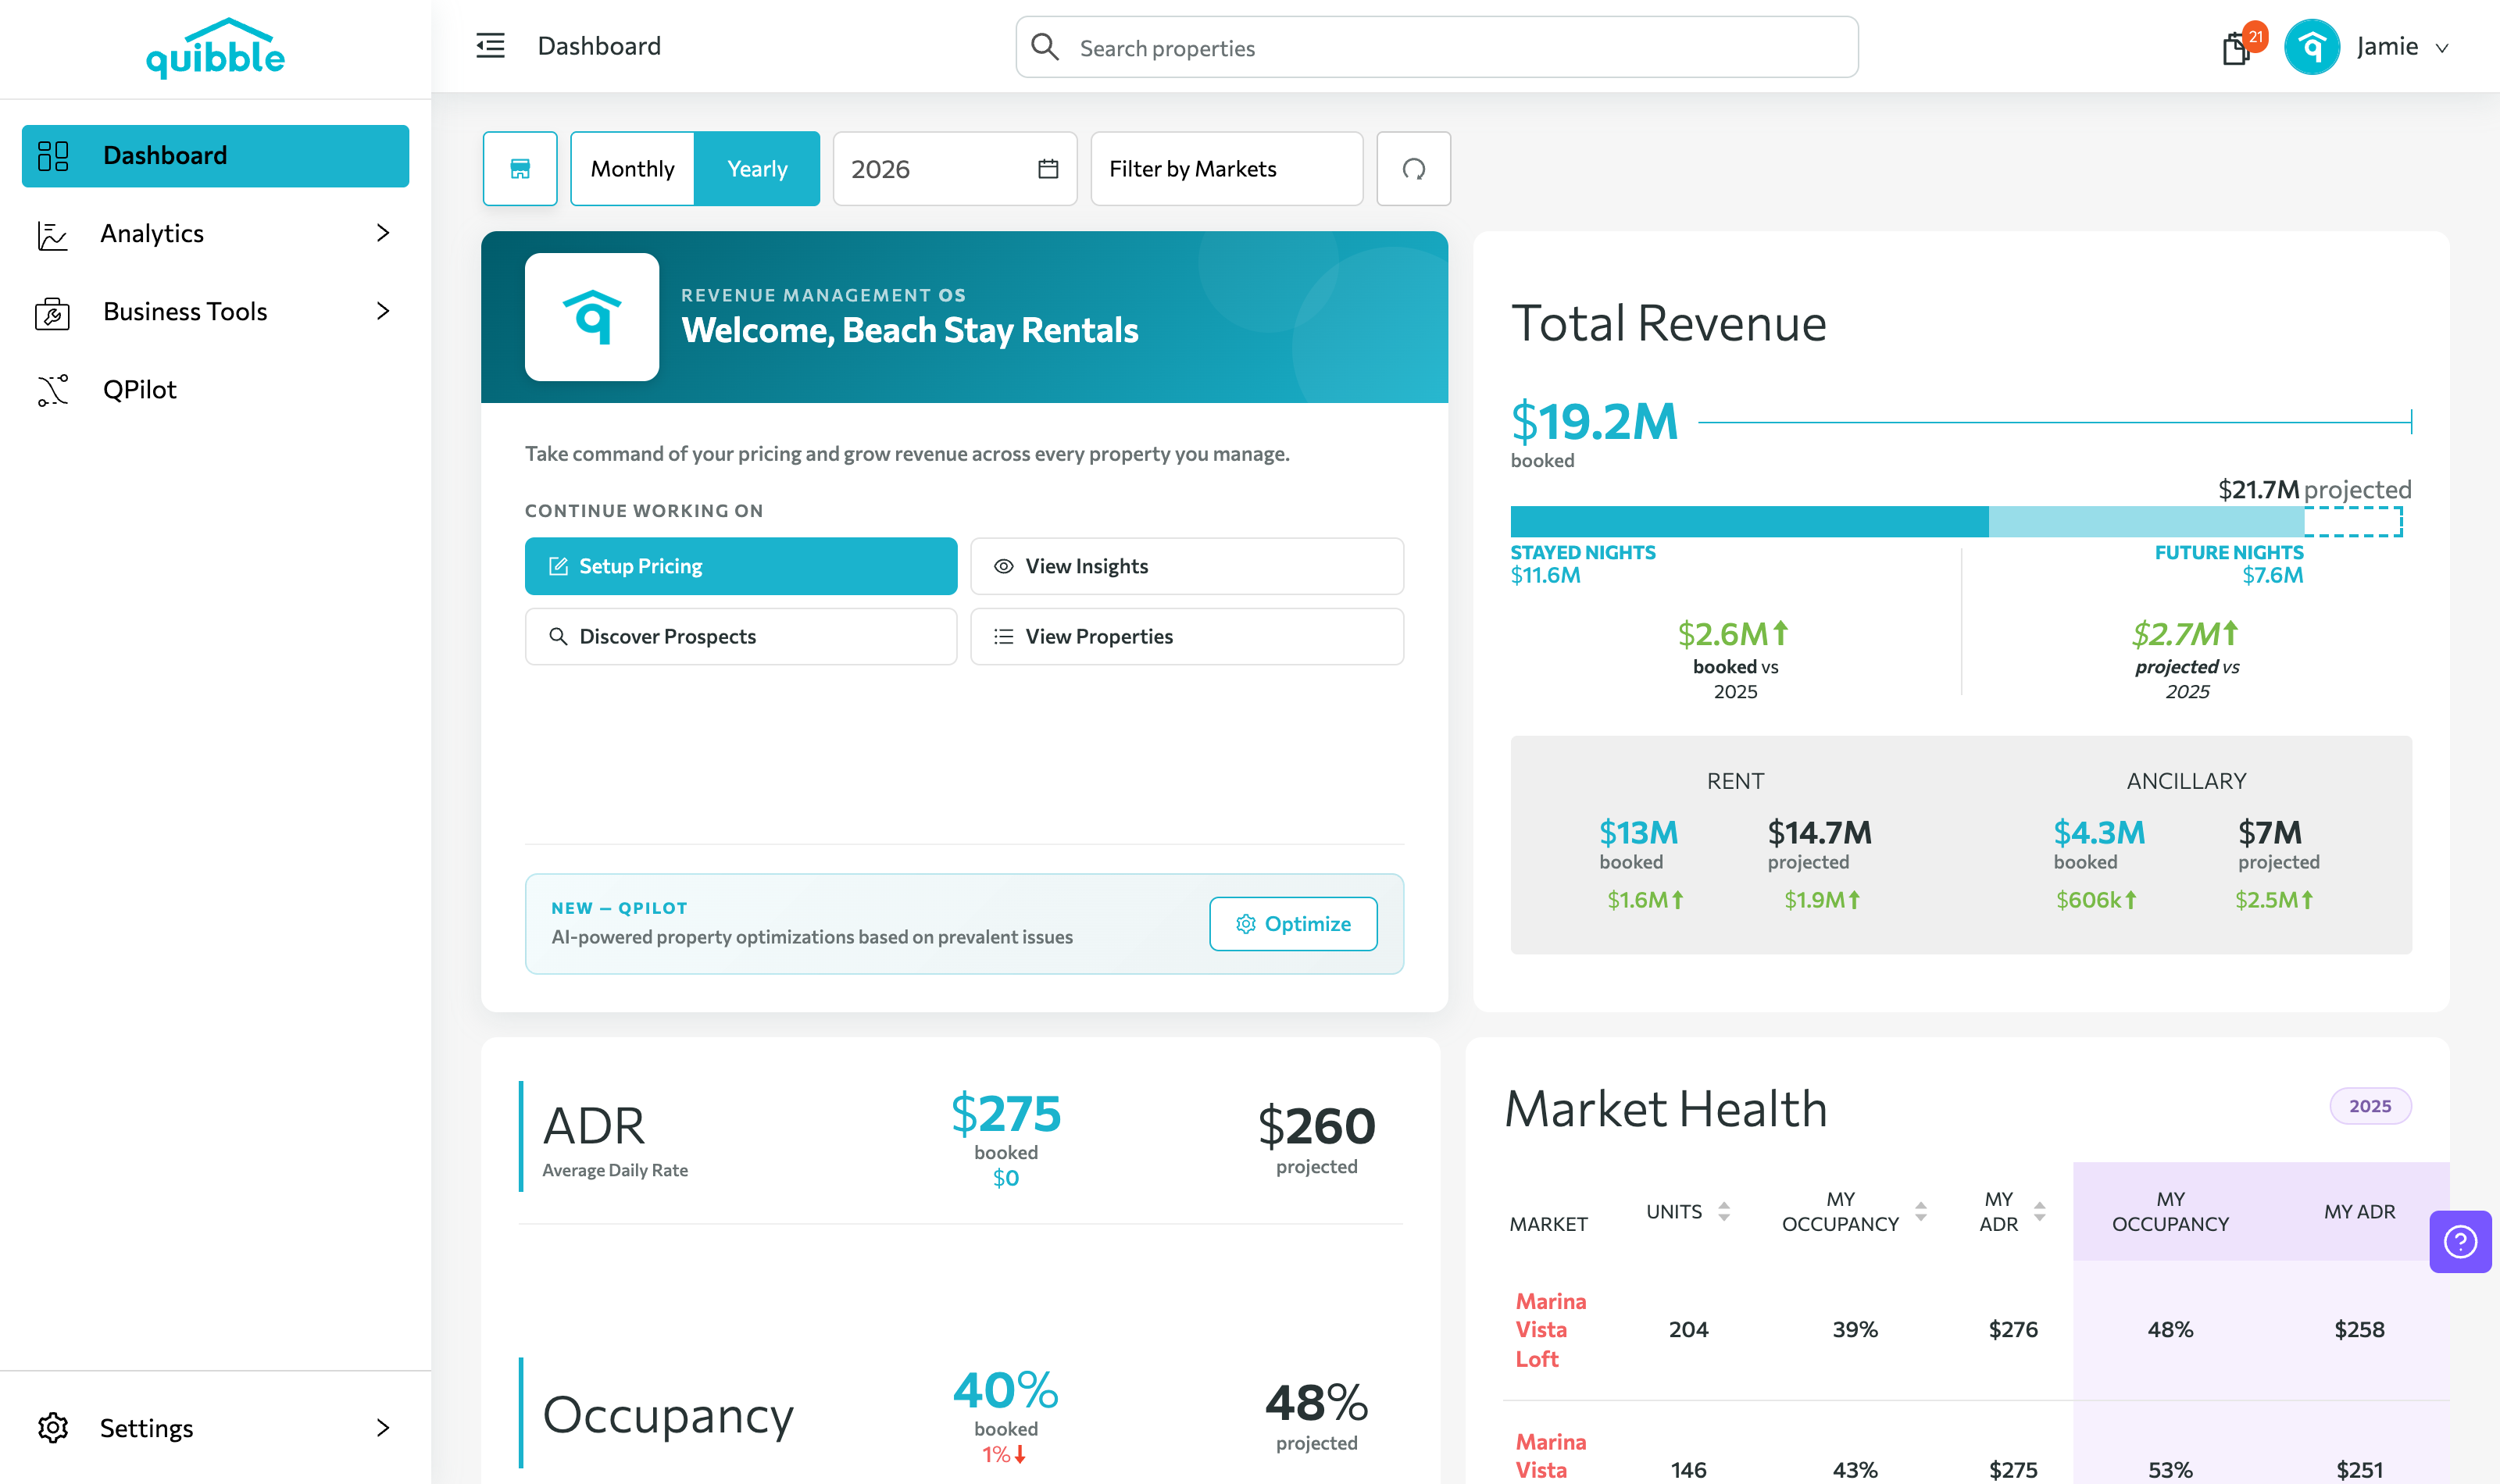
Switch between Monthly and Yearly, and filter by market, to change the scope of every card on the page.
3
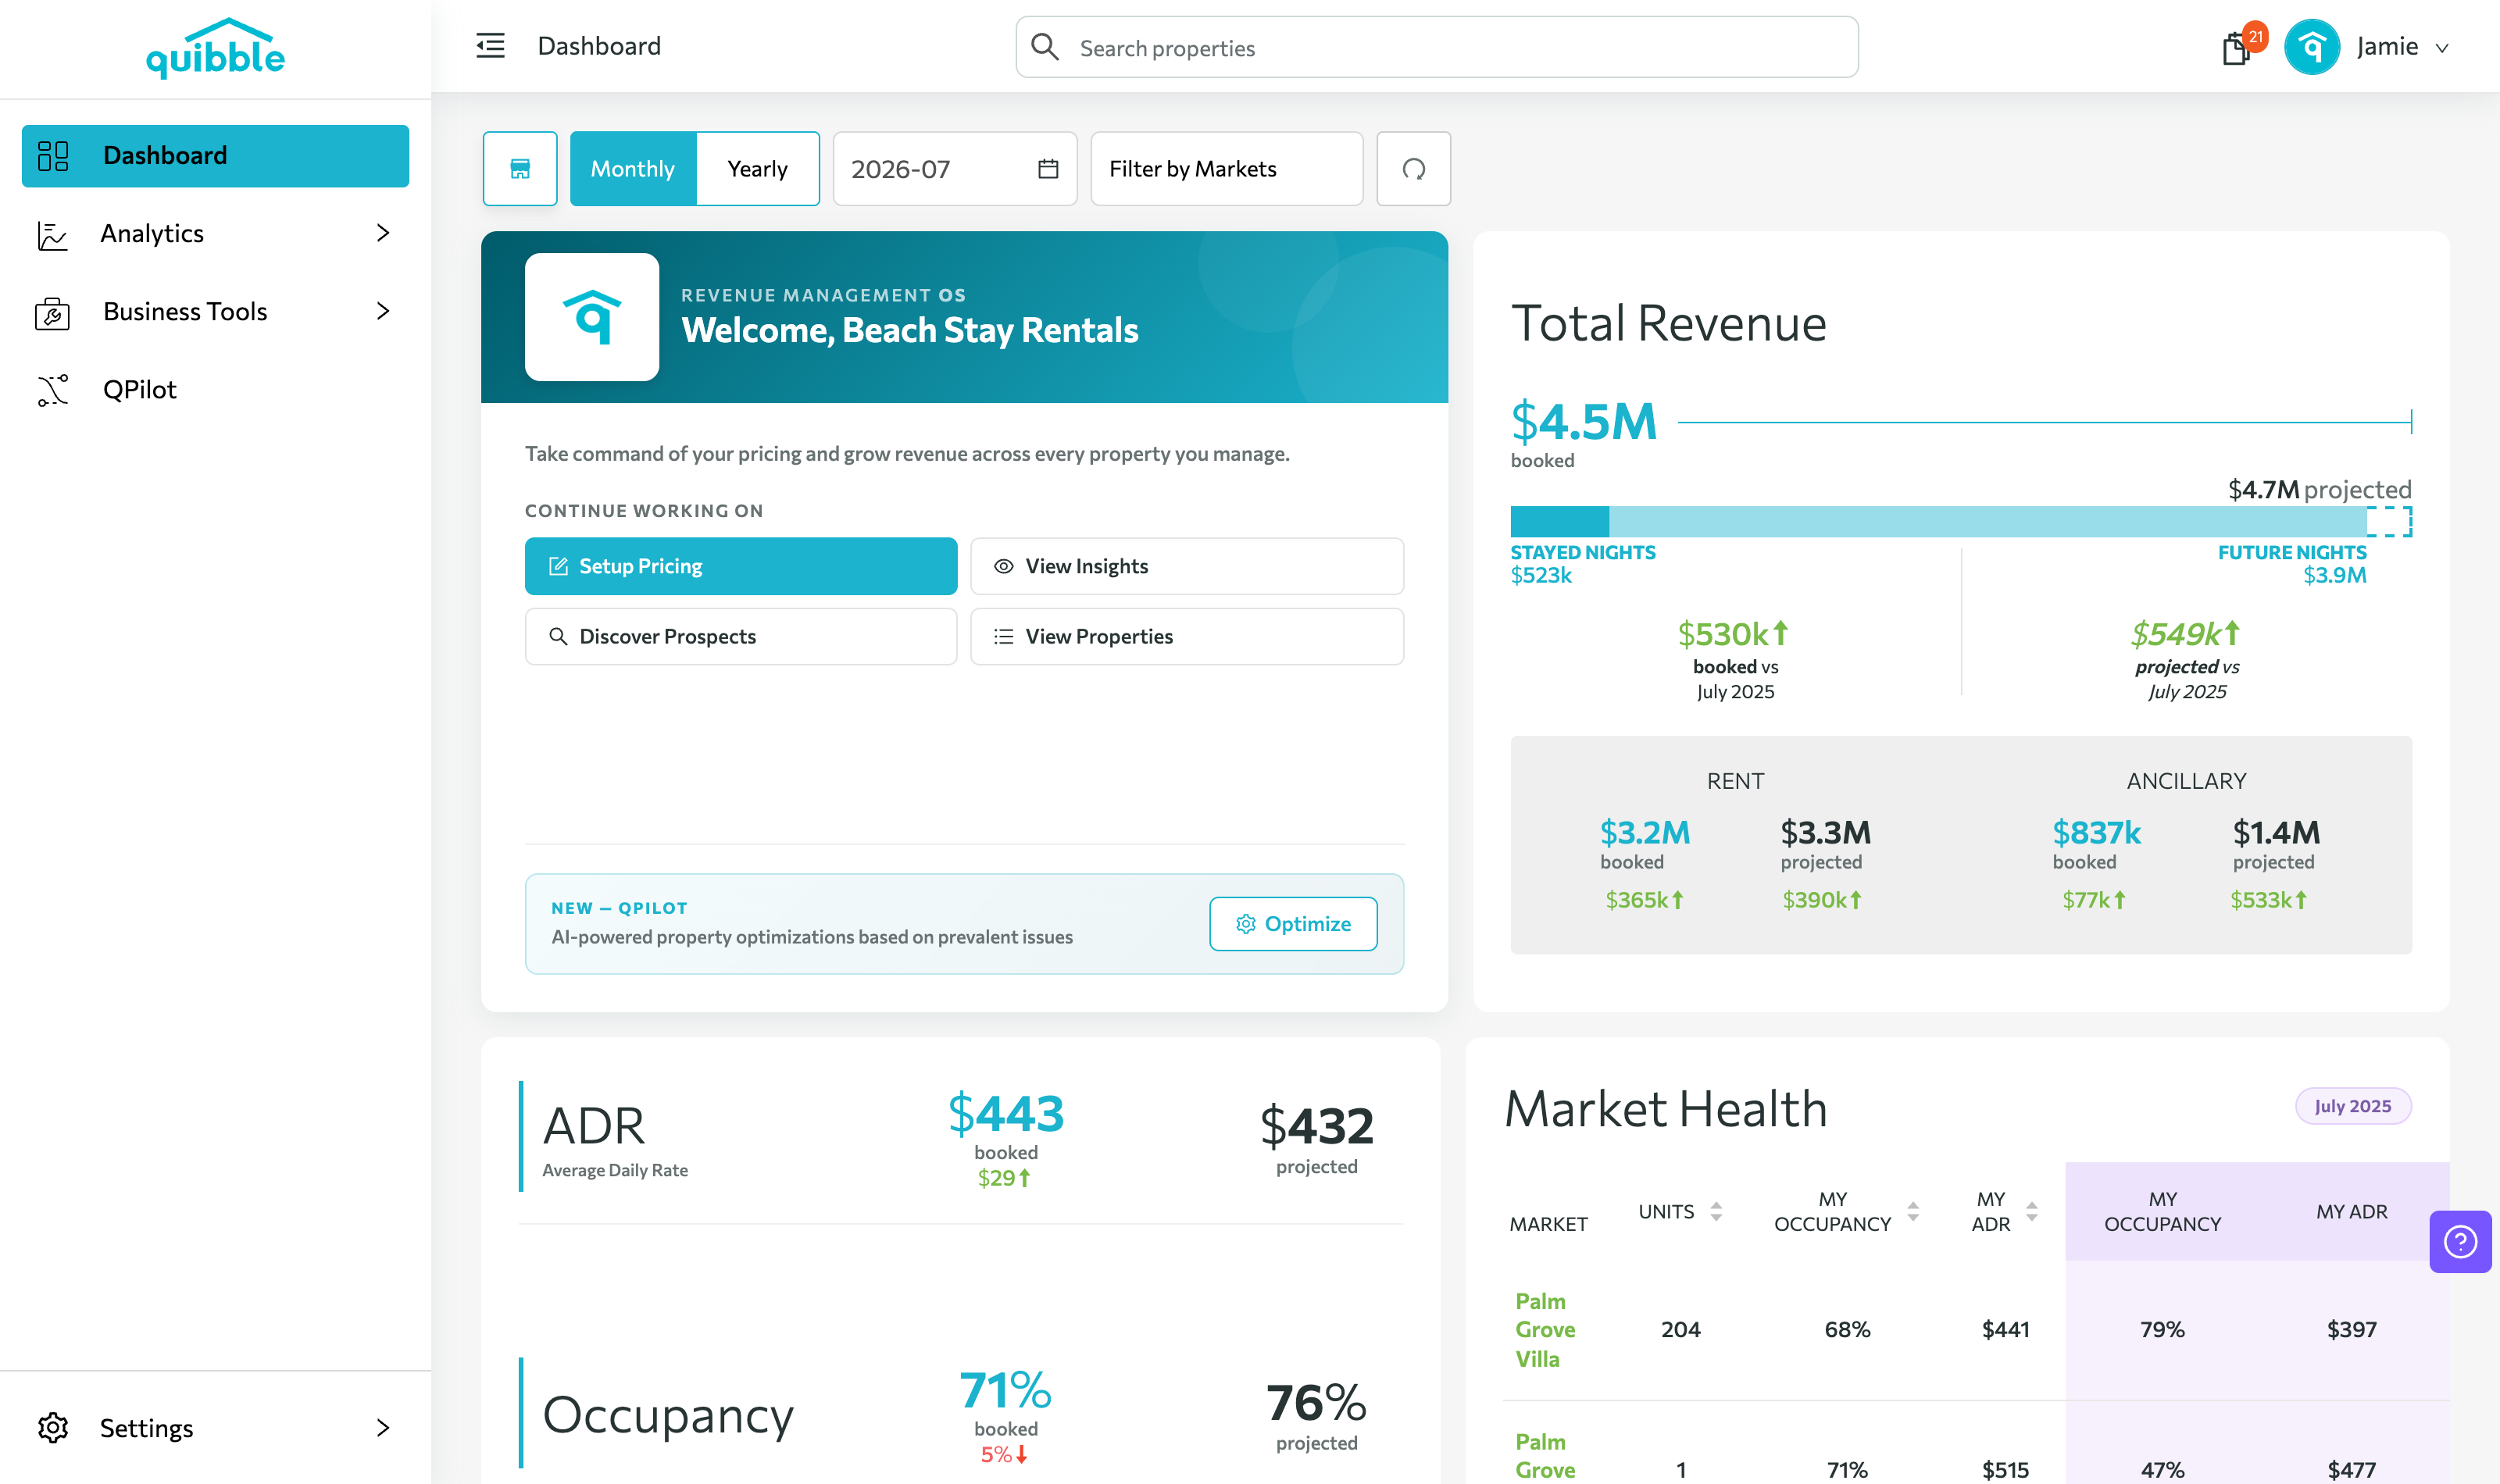
ADR and Occupancy cards compare your actuals against projections.
4
Market Health benchmarks your occupancy and ADR against each market you operate in.
5
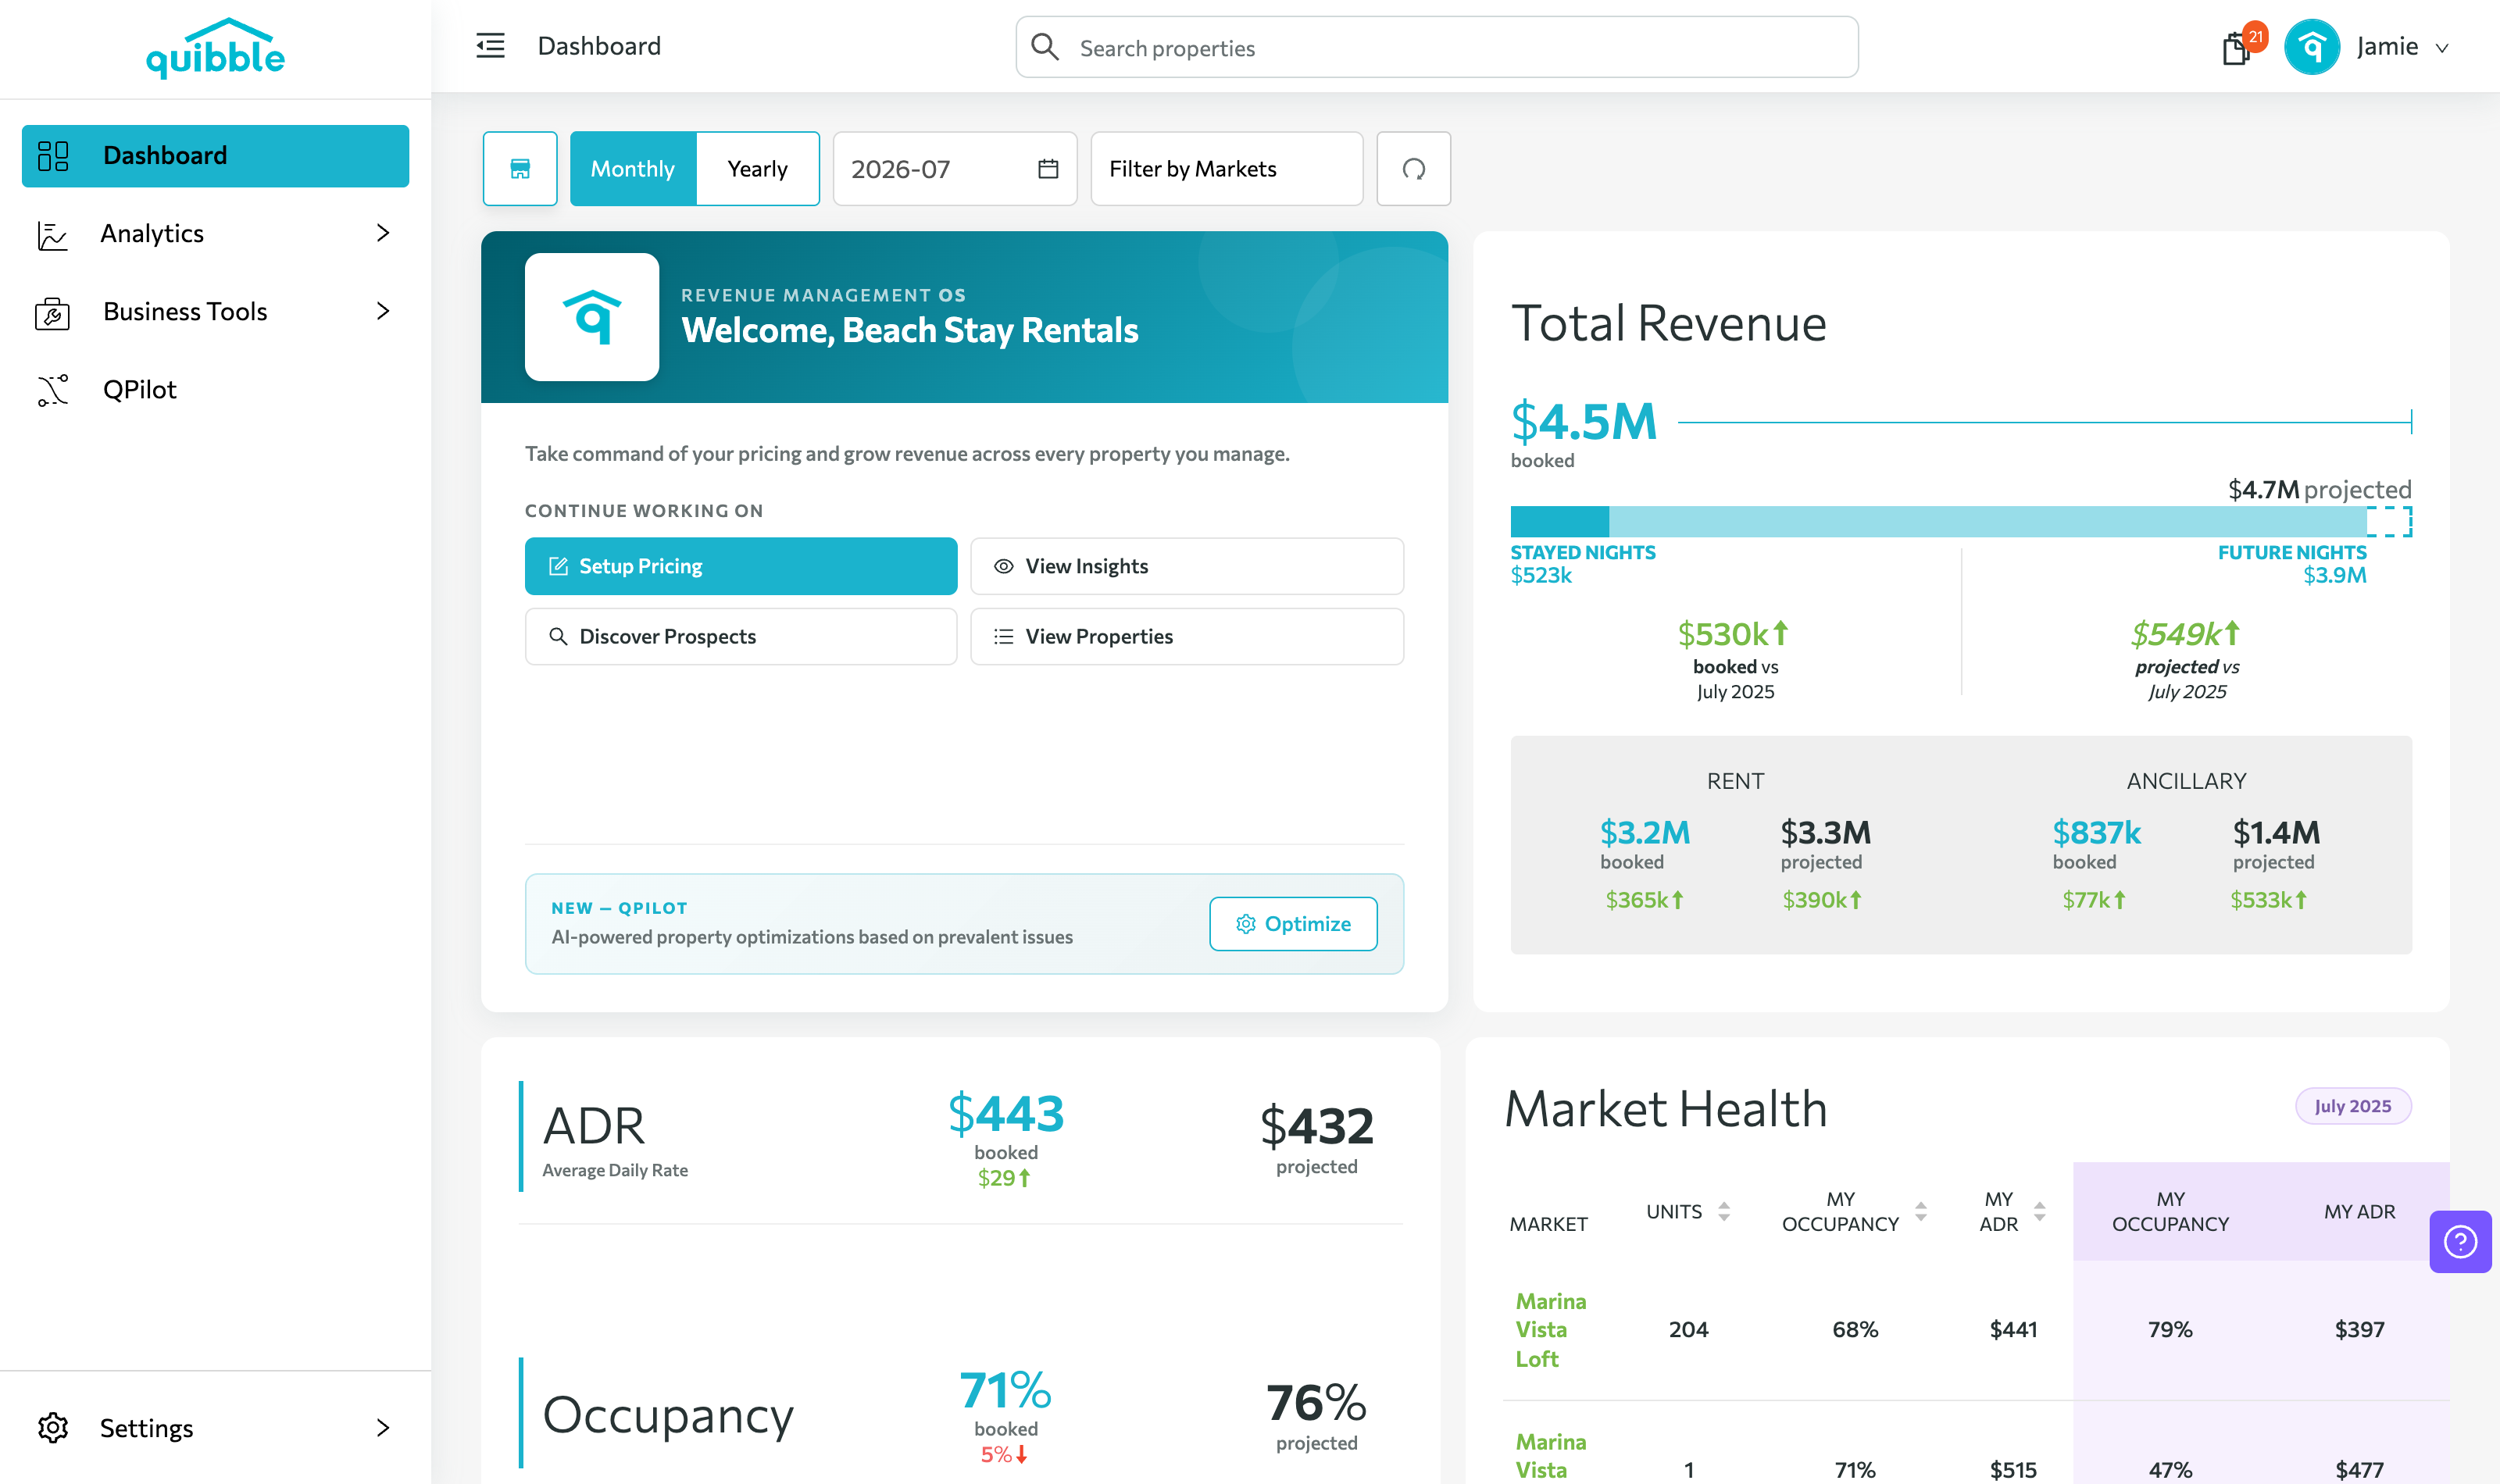
“Continue working on” gives you shortcuts back into pricing setup, insights, and prospecting.
Didn’t find what you needed? Contact us.