Understanding the Market Analytics table
The Market Analytics table lists every market in your portfolio — the second level of data aggregation for price adjustment.
The occupancy gap
1
The occupancy gap compares year-over-year — how full you are versus the same point last year.
2
A purple line shows how your properties in a city compare to the surrounding market.
Other columns
1
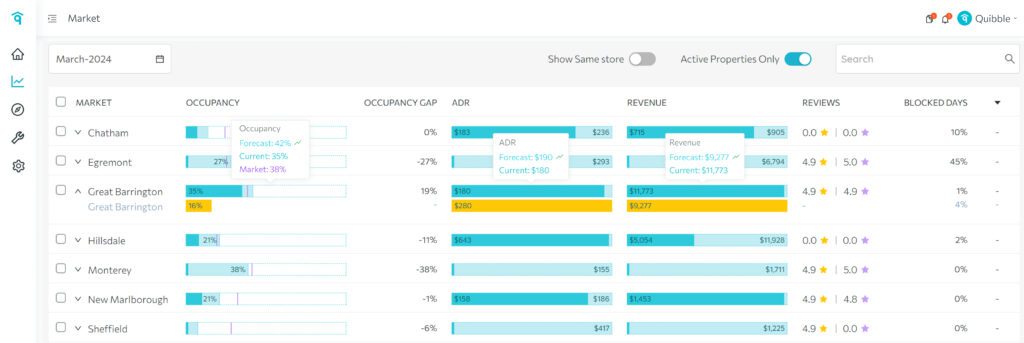
Hover over the graphs to see current values, forecasted projections, and market comparisons for occupancy, ADR, and revenue.
2
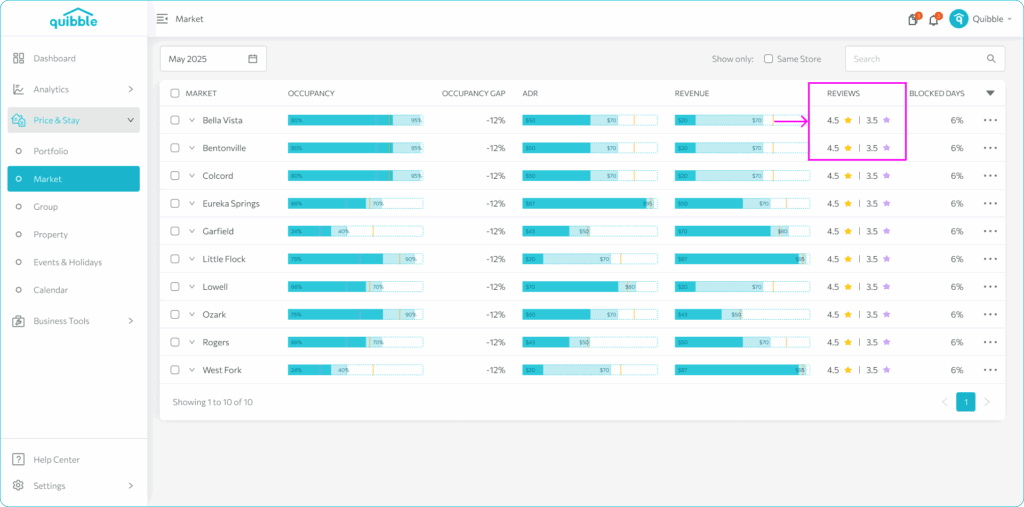
Reviews — OTA review scores comparing your managed properties against the surrounding market.
3
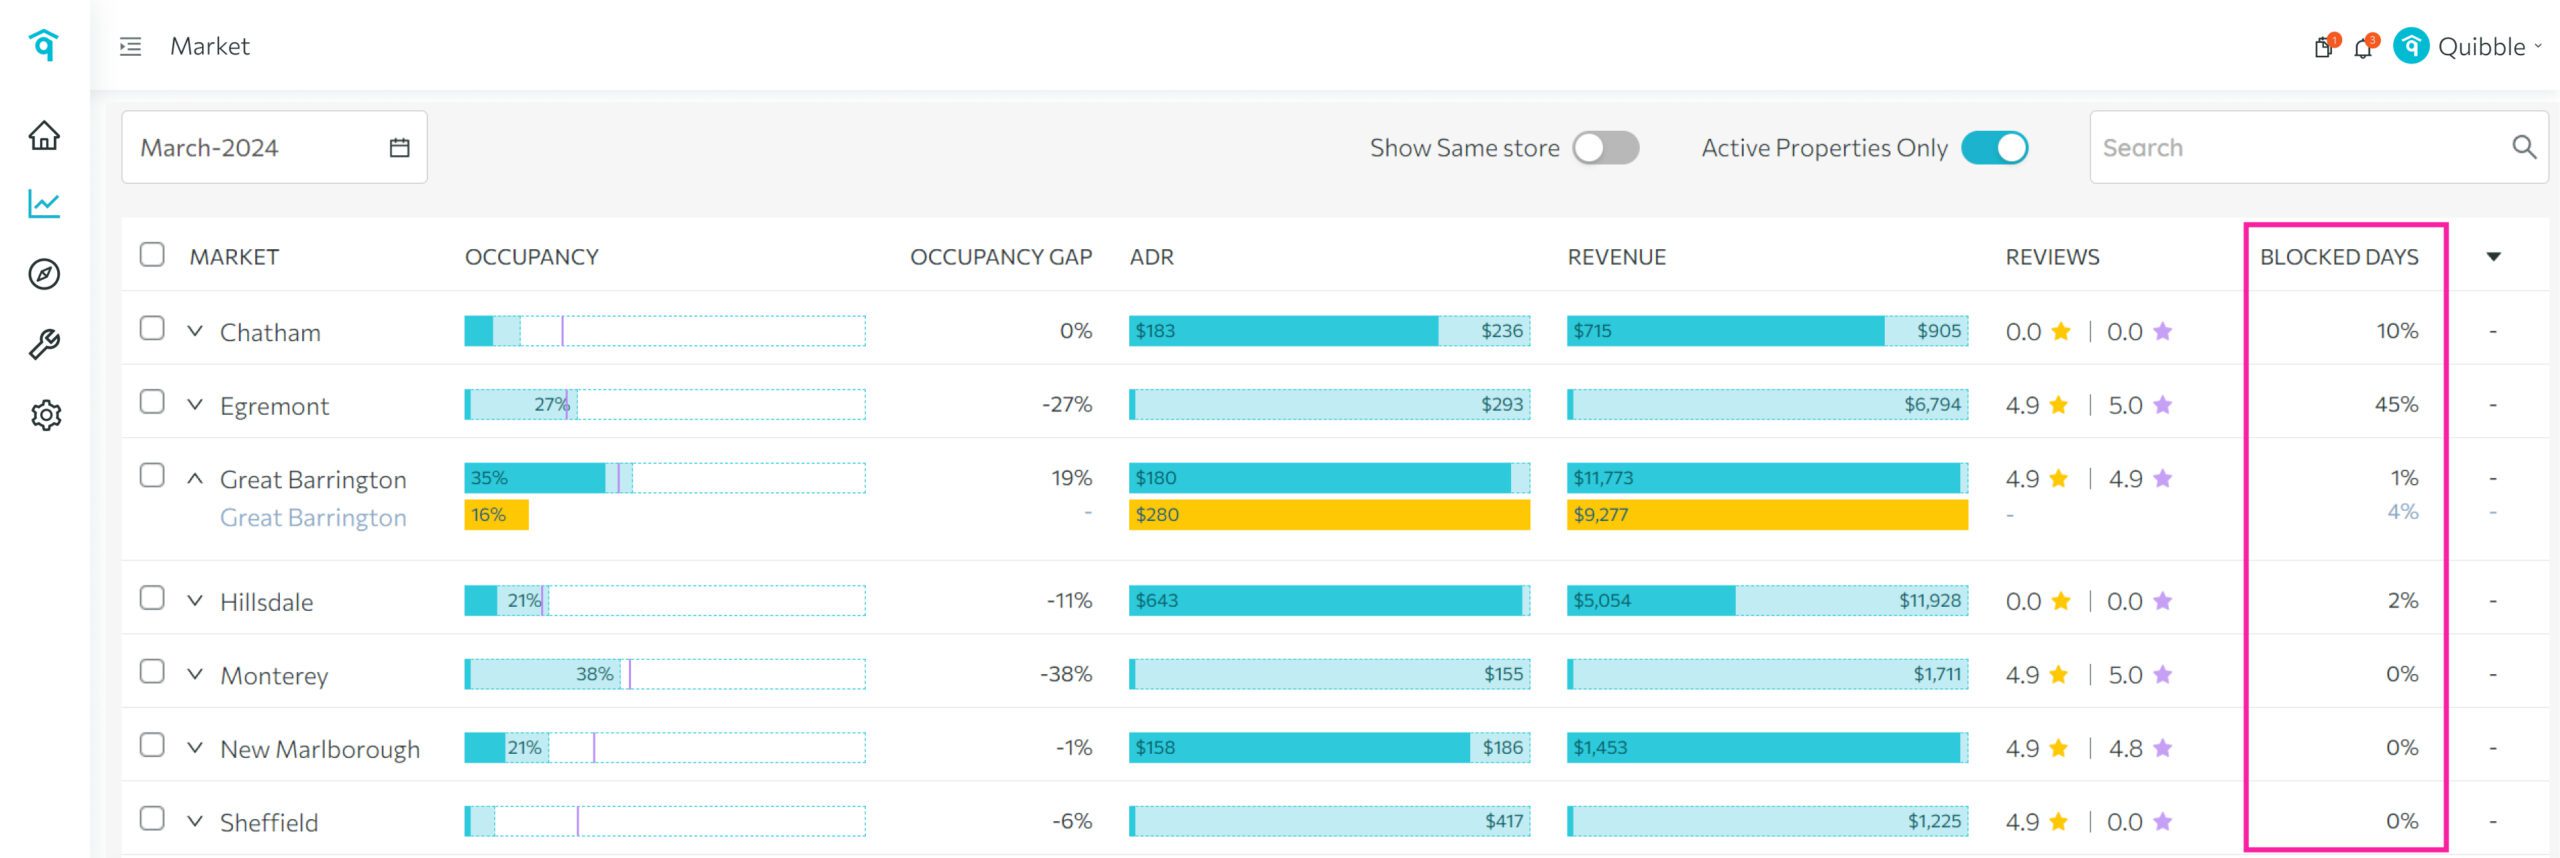
Blocked Days — days that are neither reserved nor available, excluded from occupancy.
4
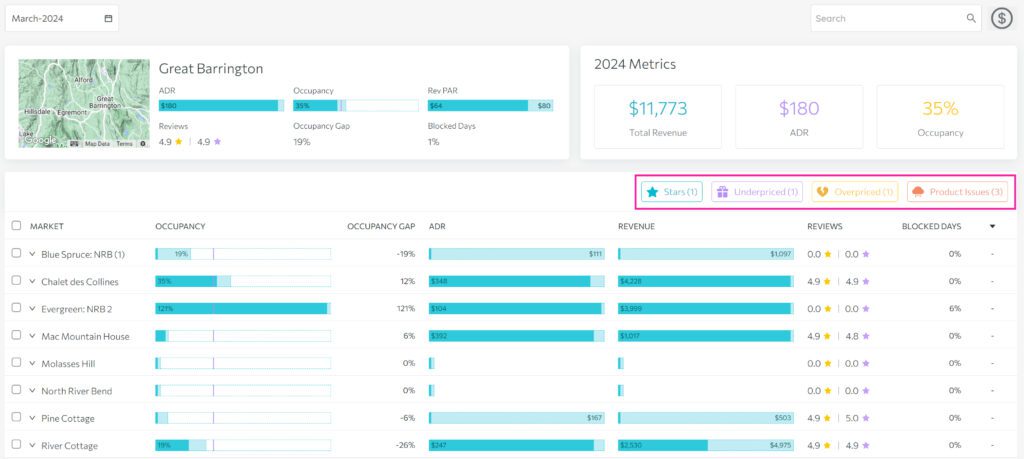
Market Details — filter by Stars, Underpriced, Overpriced, and Product Issues.
Didn’t find what you needed? Contact us.