Using filters on the Insights page
The Insights page gives a snapshot of your portfolio’s performance. These filters control exactly what the charts and graphs display.
1
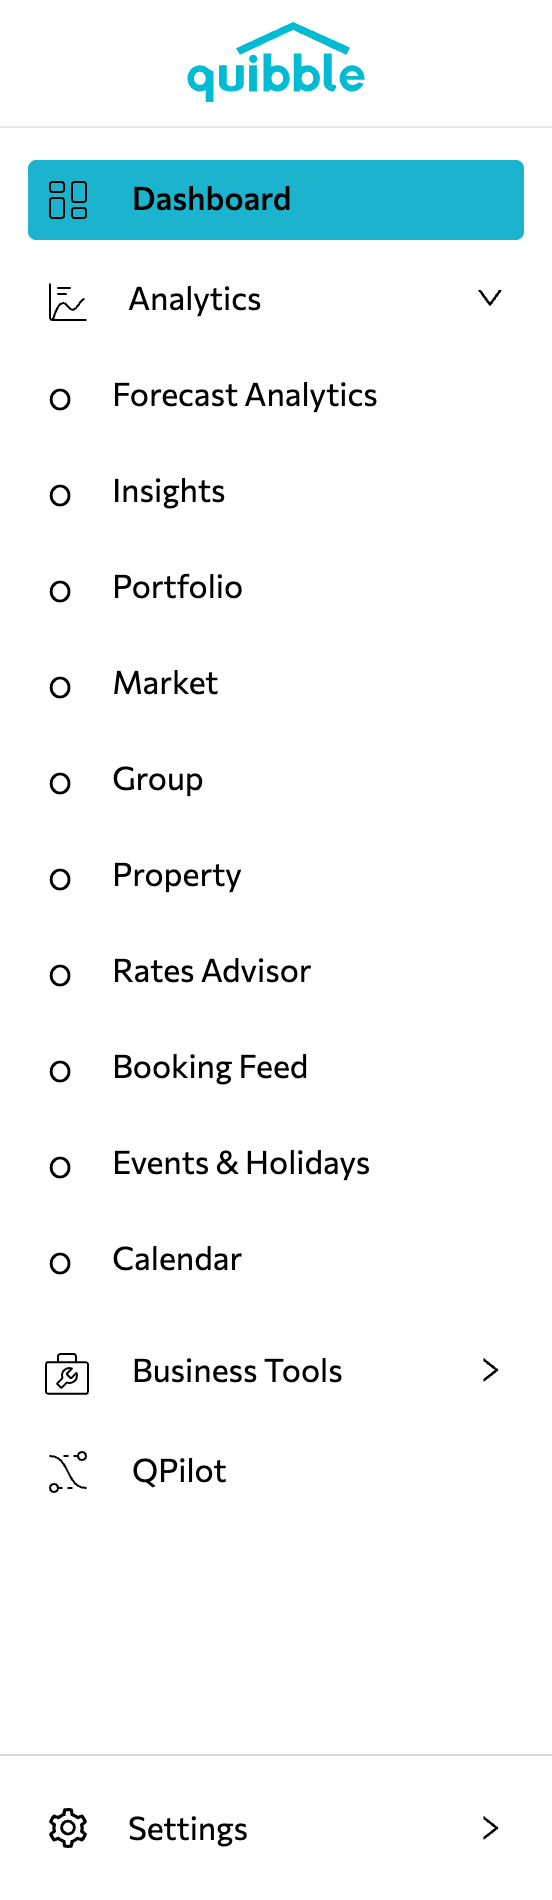
Open the menu bar (upper left), click Analytics, then select Insights.
2
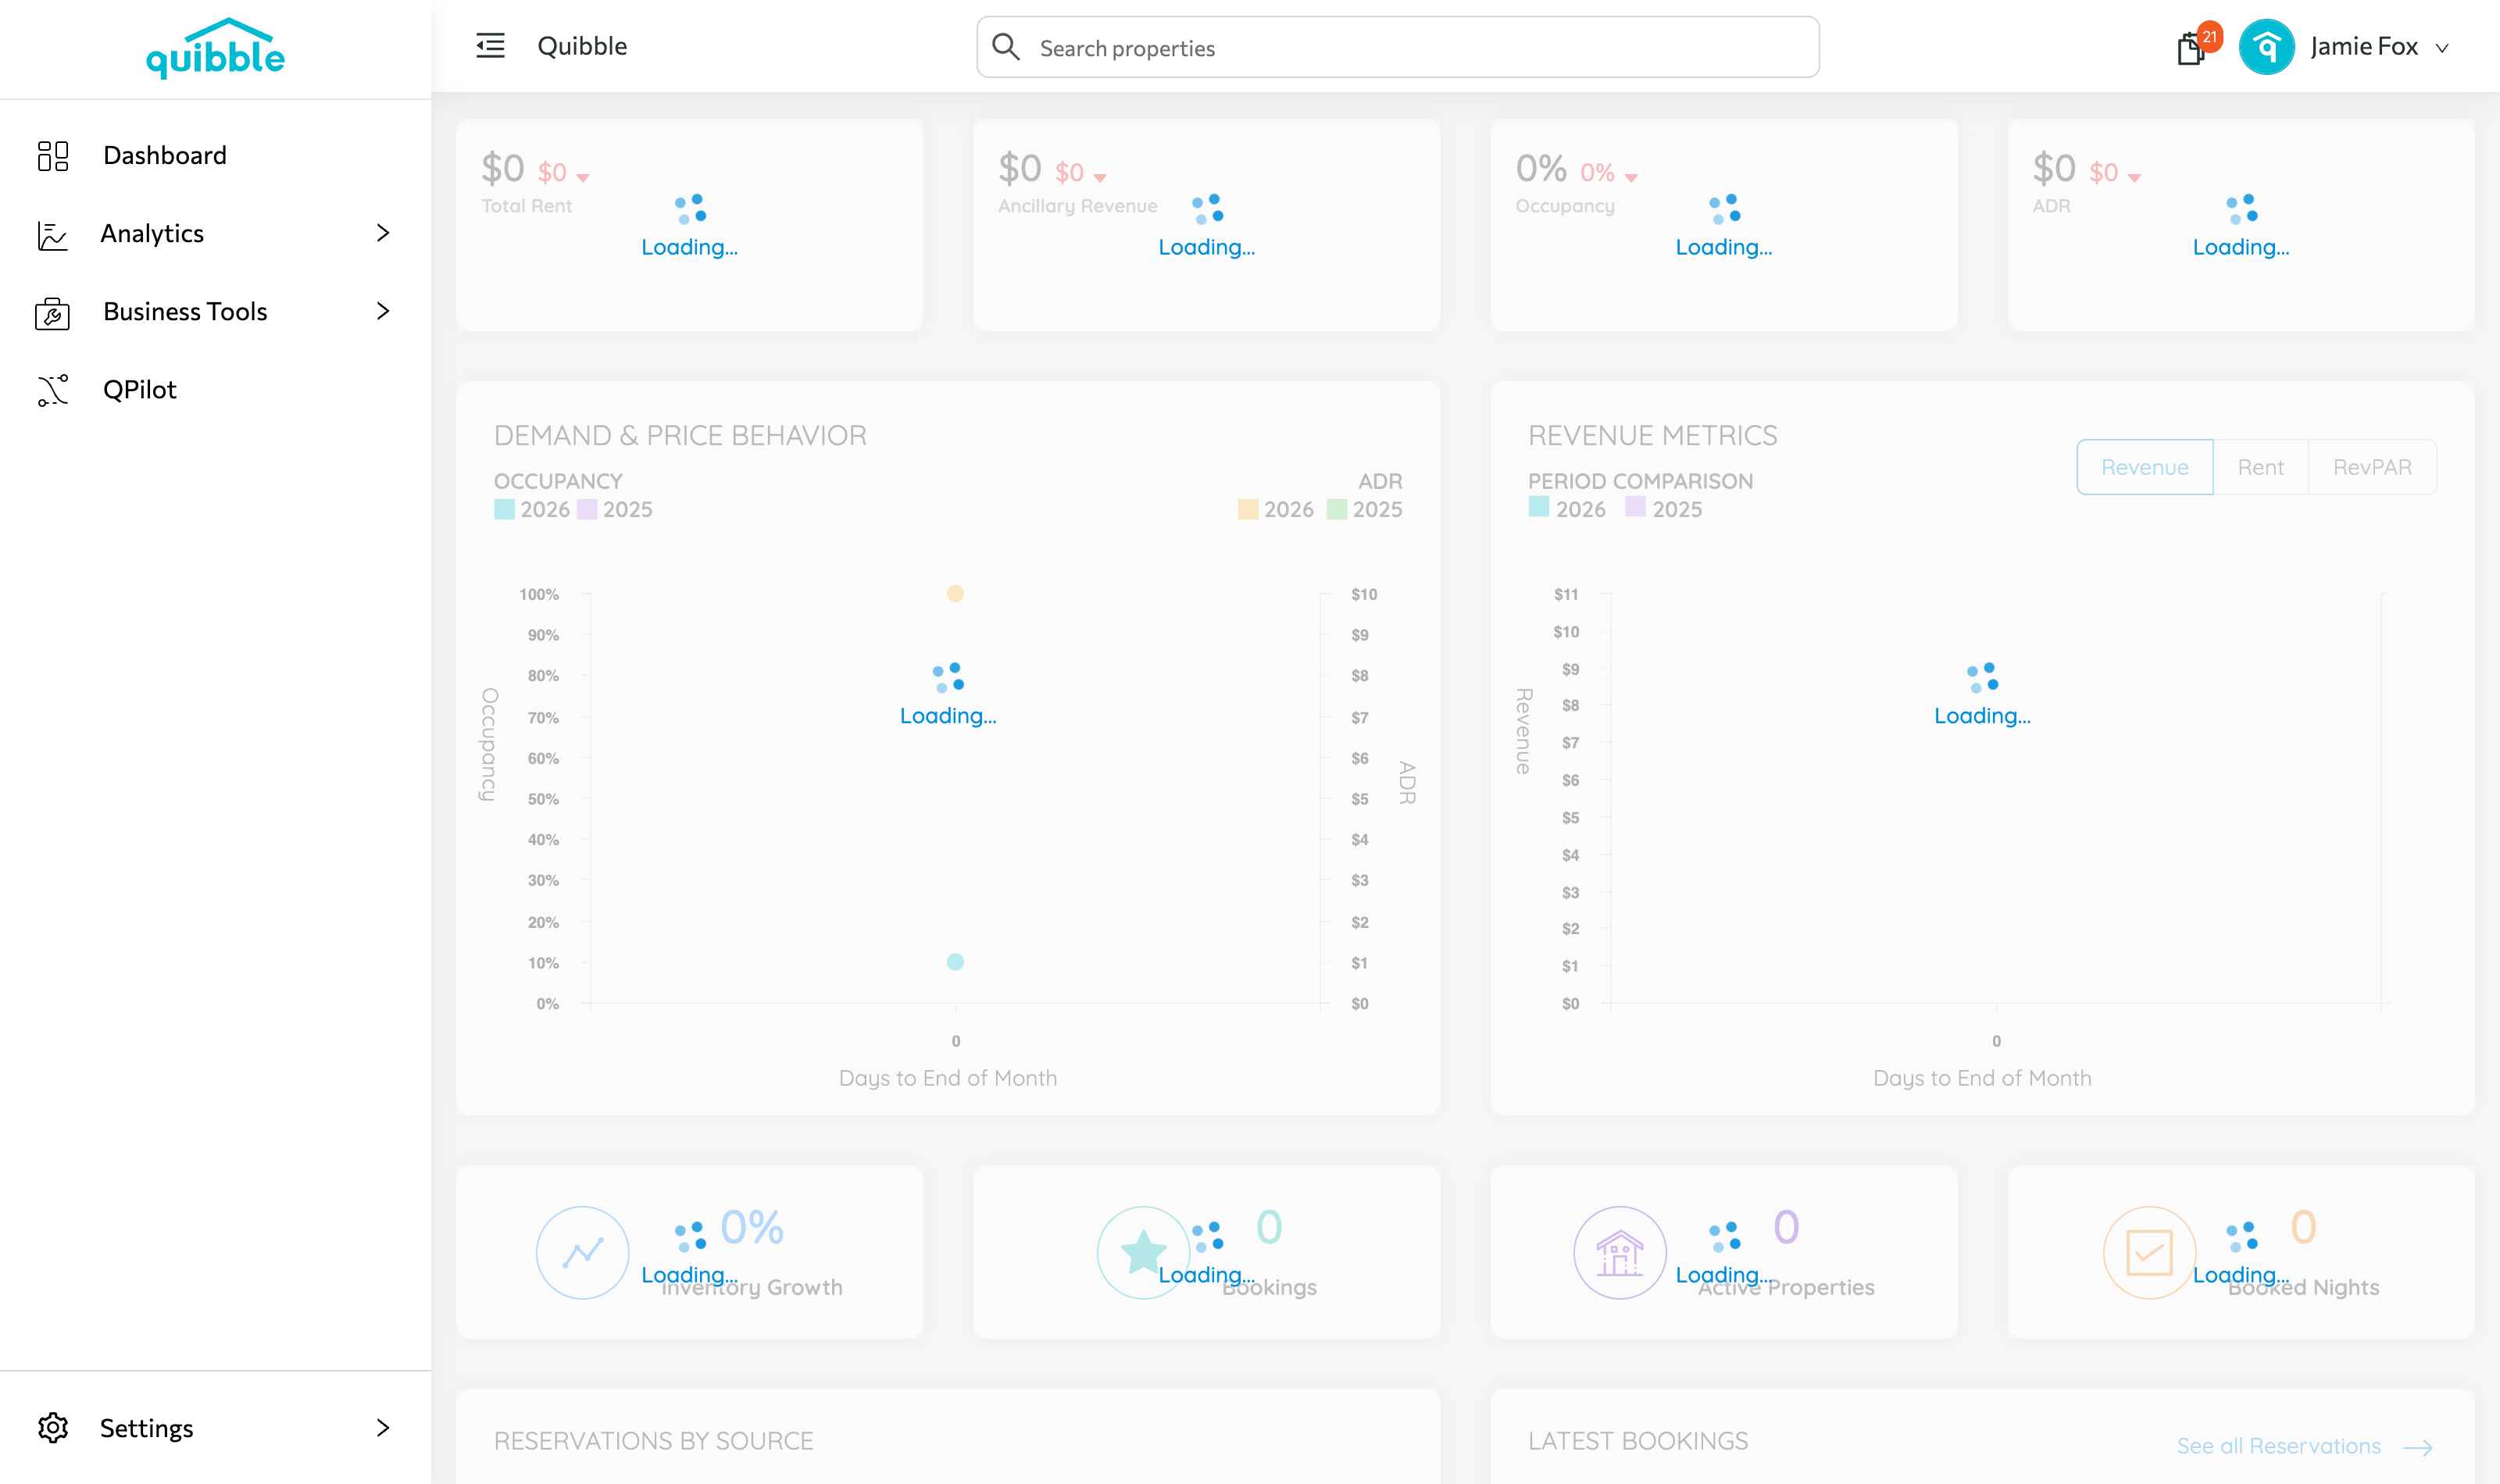
Review the filter controls that manage the chart and graph data.
3
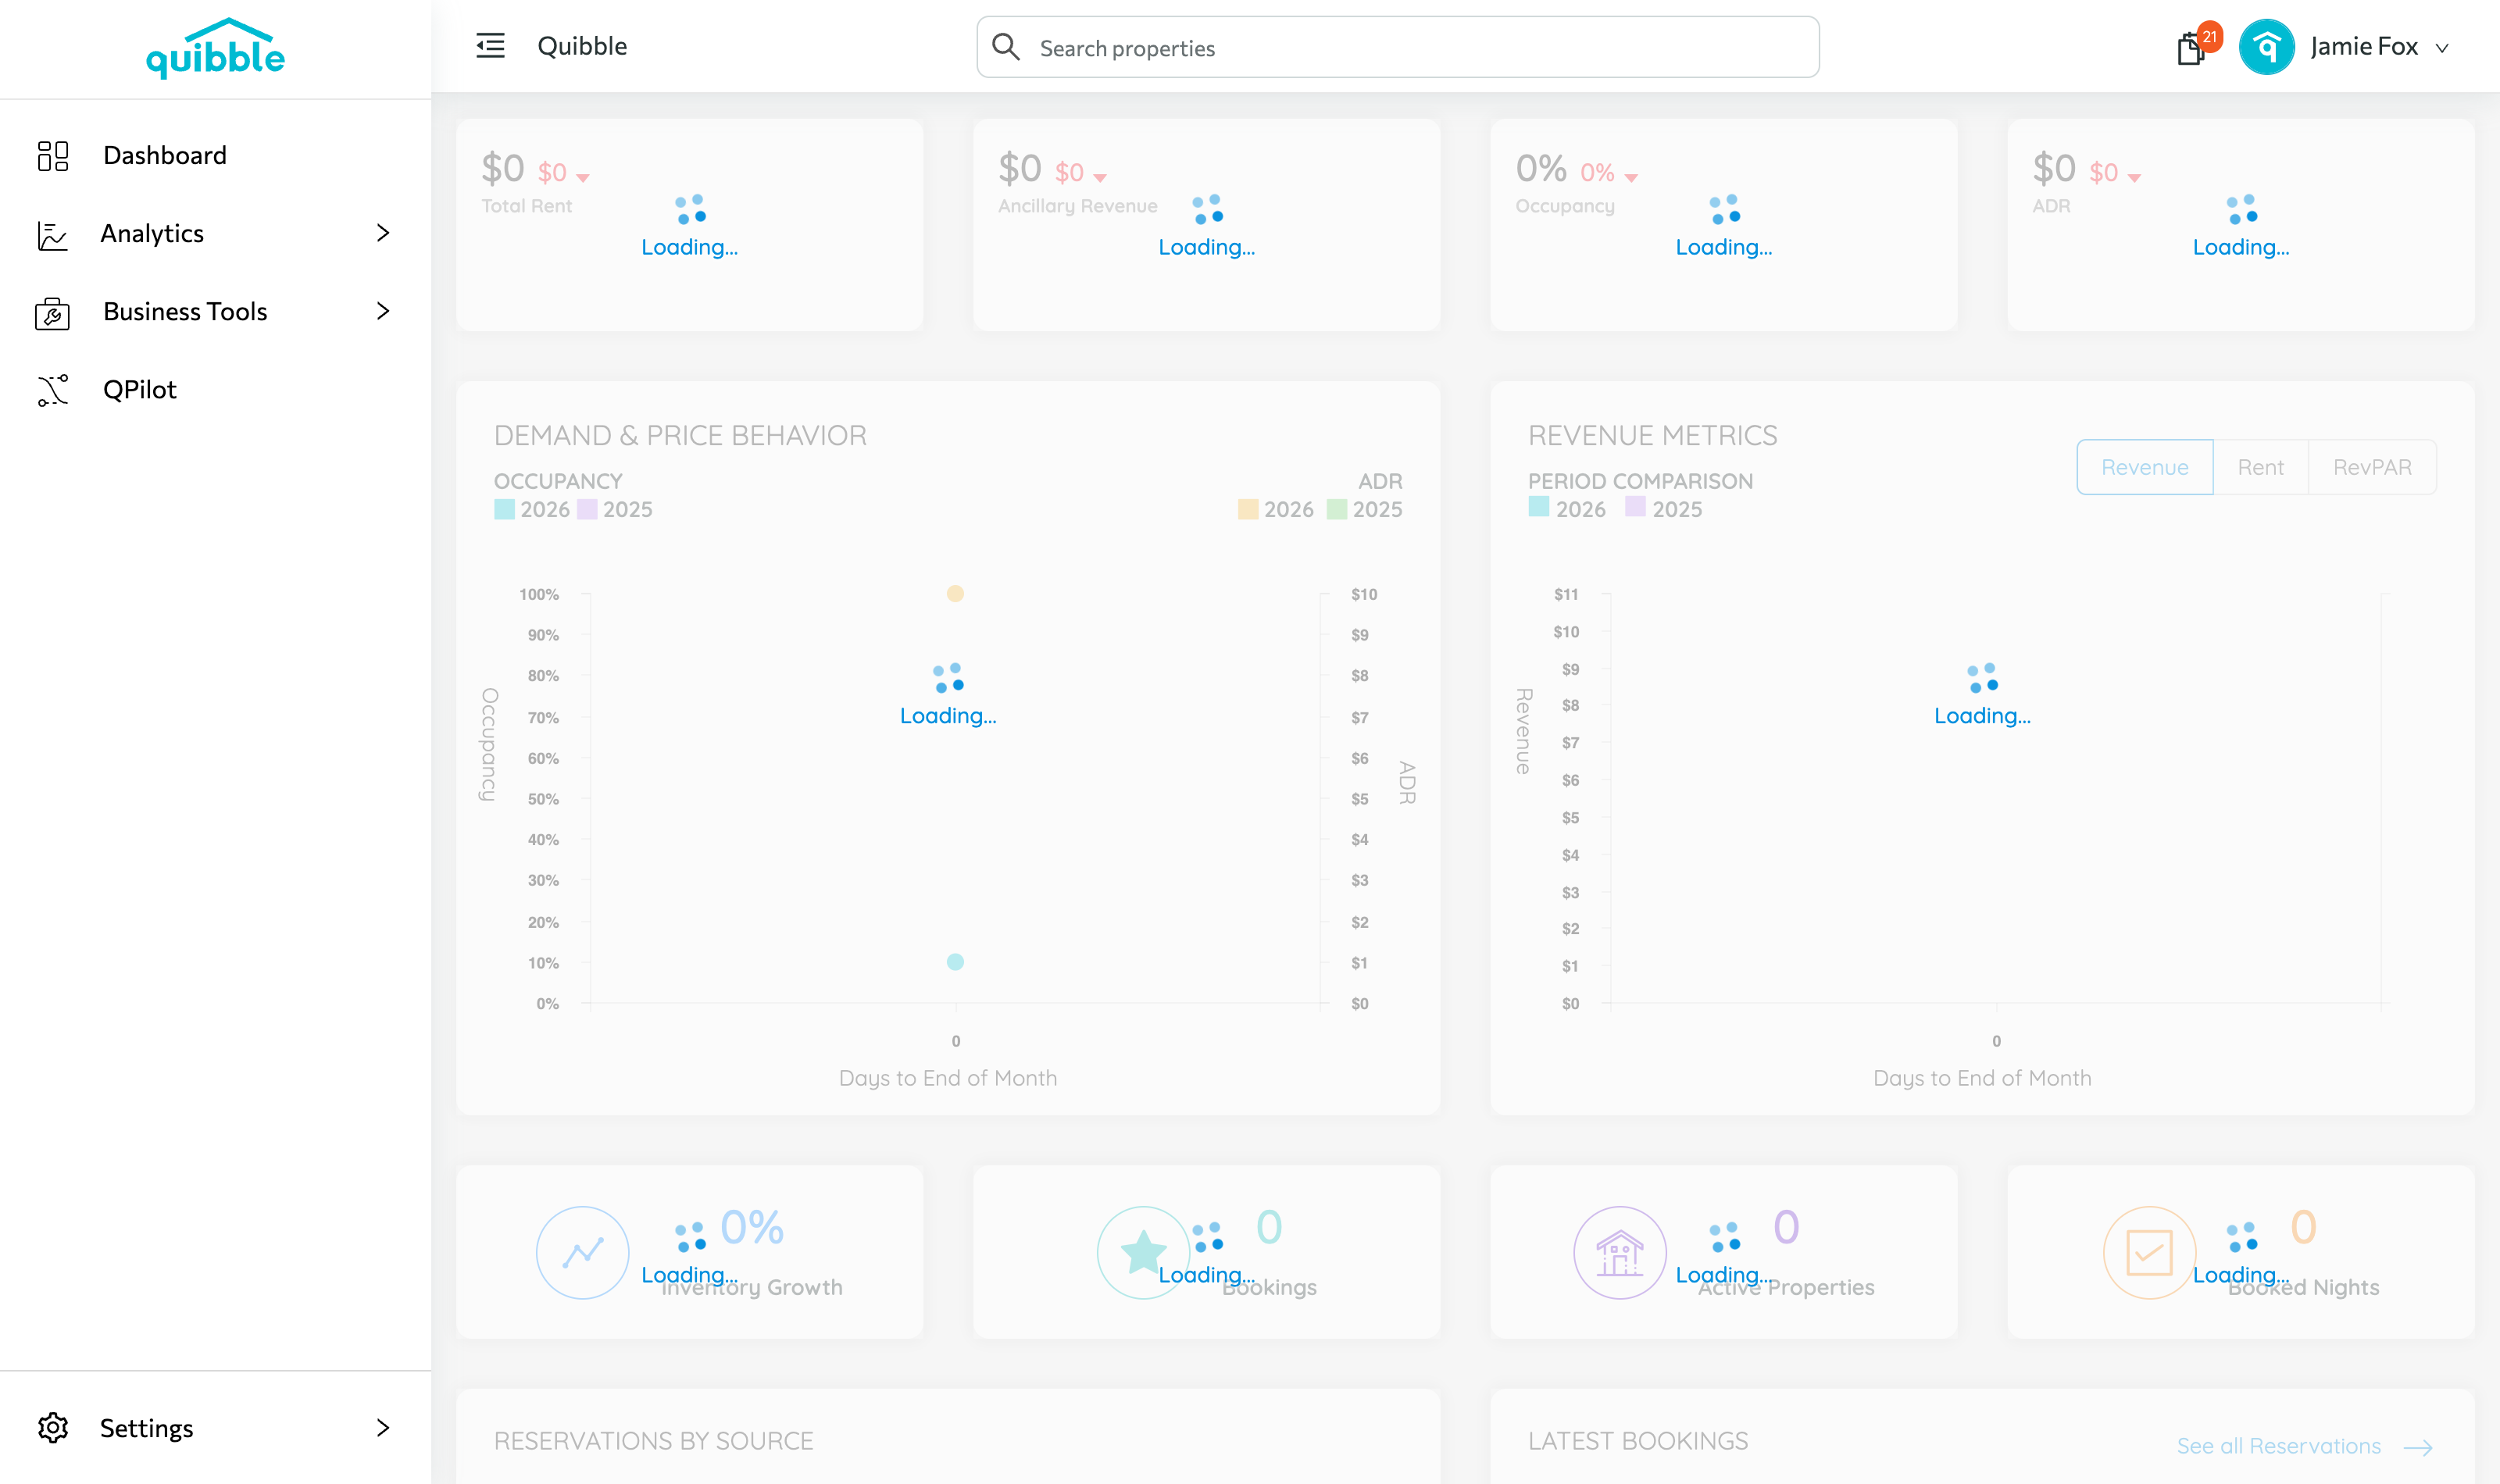
Use the first dropdown to view data monthly or annually.
4
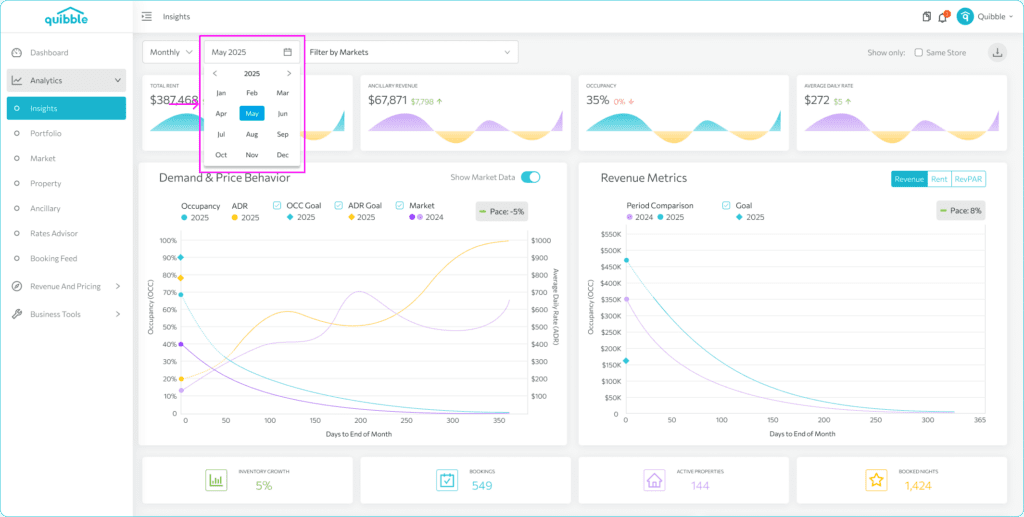
Pick specific months or years in the calendar view.
5
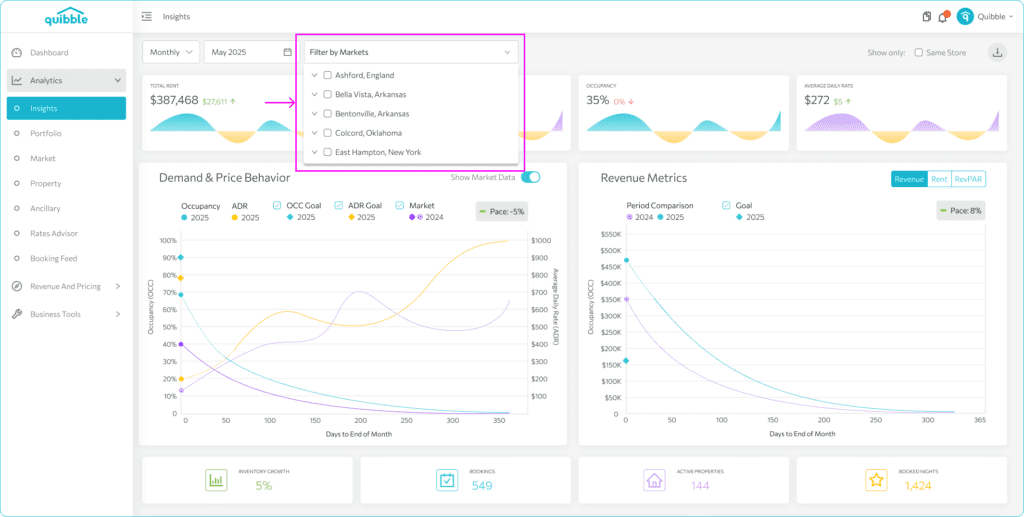
Filter by a specific market or property — leave it blank for the entire portfolio.
6
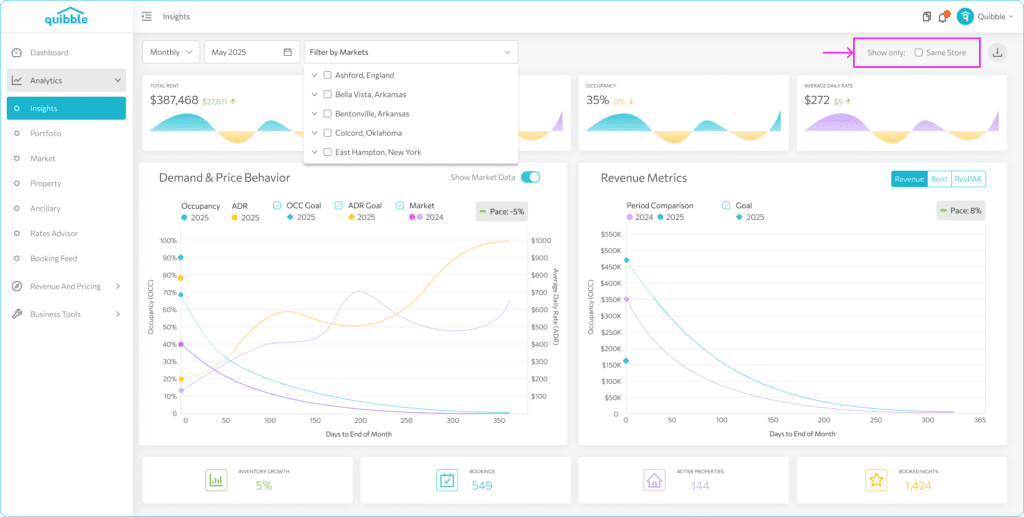
Toggle Show Same Store to limit data to properties active in both the current and previous year.
7
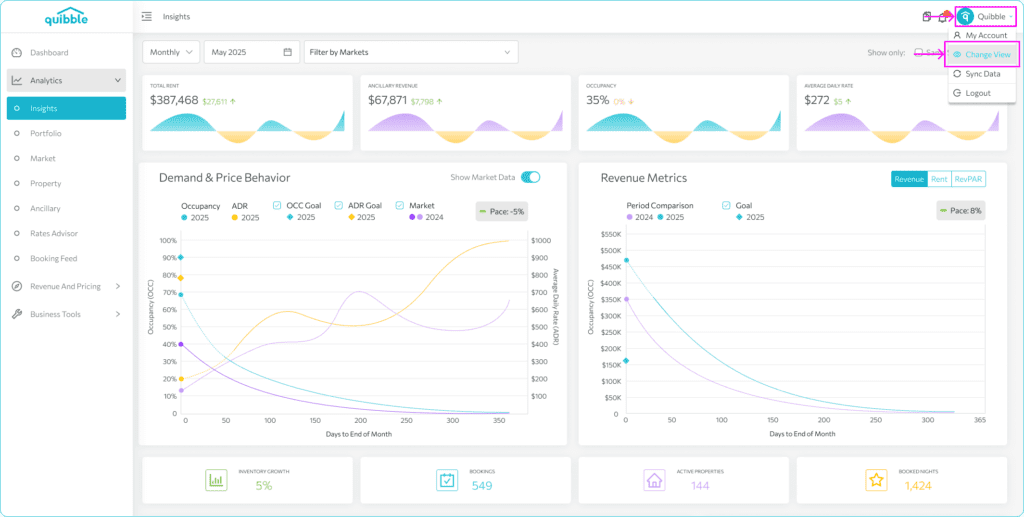
From your profile (upper right), choose Change View for different number-display formats.
8
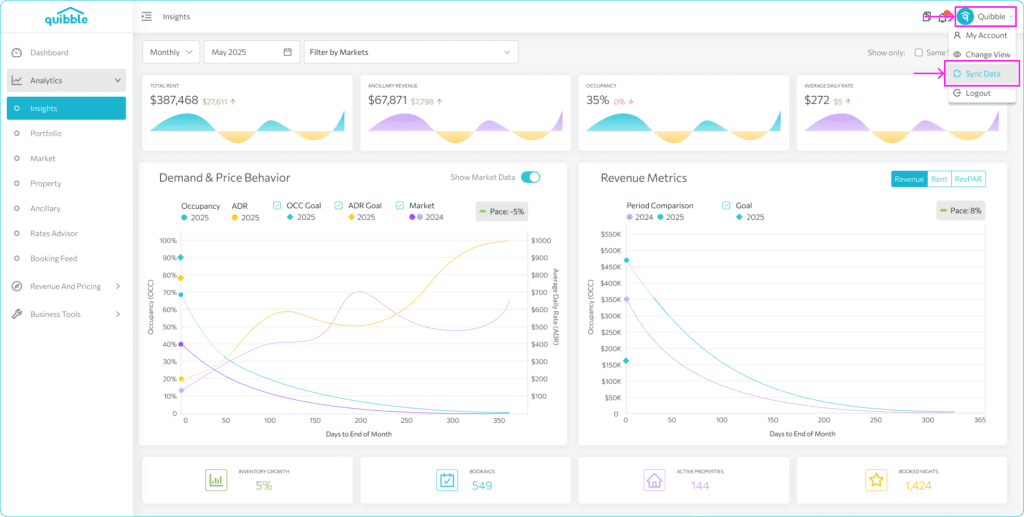
Use Sync Data (under your profile) to manually trigger a PMS-to-Quibble sync.
Didn’t find what you needed? Contact us.