Occupancy (OCC)
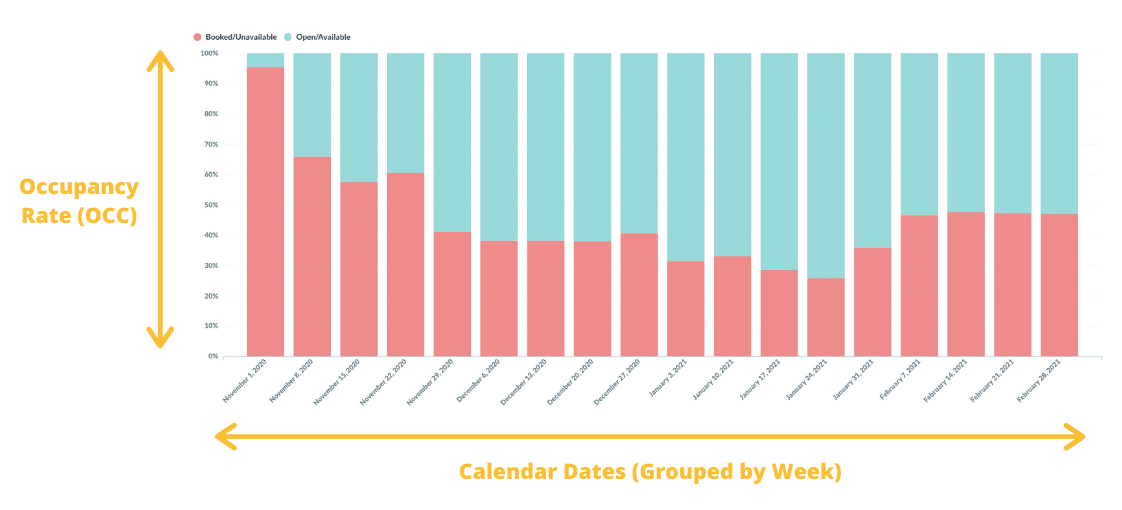
Occupancy is a metric represented as a rate or percentage used by vacation rental managers to describe how full their properties are. A single vacation rental can be 50% occupied for the 4th of July weekend, or an entire portfolio of 45 properties can be 15% occupied for the month of December. It is a handy demand indicator for a property or set of rental properties in a geographical region or portfolio.
As a property manager, it is critical to know the occupancy rates to properly understand and steer the unit’s performance. In the vacation rental industry, it is standard procedure to compare your unit’s occupancy rate or portfolio of properties to the industry at large. This standard is a good benchmark but should be a secondary comparison to the property’s historical data. In most cases, a comparison of the property’s occupancy rate from a different period is a much better guide to steering performance, and this is the best data to rely on to guide decisions.
What affects occupancy rates?
Demand shocks like COVID19 or the Olympics have dramatic impacts on occupancy rates. An event like COVID19 is incredibly hard to forecast. Even the few that were publicly concerned about the risks could not know when it would happen. Special events like the Olympics happen on a predictable schedule but not in the same location. The lucky city (or unlucky) enough to be chosen can expect a temporary rise in occupancy. Some changes in demand are not in the form of shocks like the above examples but are trends that happen in a few percentage points each year.
Now there is a trend away from urban areas and into more rural areas for vacation home rentals. What drives these changes in occupancy gets treated as a demand-side measurement. But since it is a calculation as a percentage, it is equally affected by supply as well. Doubling the supply of vacation homes available in Steamboat Springs will drive down the occupancy rate. This increment is valid unless demand doubles at the same time. The market signals are generally not that clear or easy to respond to, allowing the property owners in Steamboat to react with that level of accuracy.
In underserved markets, where demand far exceeds supply, government policies often encourage that scarcity. This scarcity drives a supply constraint that keeps occupancy rates higher than they would be in the absence of the regulation.
Occupancy Calculation
The calculation for the occupancy rate requires the reservation data and the inventory data. The reservations make up the numerator, and the inventory makes up the denominator. Property A is available for 31 days in December and booked for 20 room nights; therefore, the occupancy is (20/31) 0.70 or 70%.
In the vacation rental space, there is an added layer that can confuse this calculation. Part of the problem is that property owners use the properties for their leisure. Even once in a while, they will make a reservation outside of their PMS (Property Management System). This perk is one great benefit of owning a rental property, but it is not ideal for calculating occupancy.
These dates used by the property owners end up blocked and should not to be confused nor aggregated with booked or vacant. Removing those days from the occupancy calculation, which is the most accurate method, tends to overinflate the occupancy rate. The problem is that the blocked days are not recognized as blocked in the data since they get treated as vacant. In turn, this problem causes the opposite pain as well, whereas the occupancy rate is understated.
Understating Occupancy
When occupancy is understated, it harms revenue management algorithms to forecast demand. This effect is particularly true in the short-term rental market because the methodologies currently used rely heavily on industry scraped data from Airbnb and VRBO. There are ways to correct the error introduced by understated demand, and this is one of the primary reasons why relying on scraped data to set prices or forecasts is so dangerous. The most accurate models are biased strongly towards host data, which is directly from the property’s reservations and produces a far more reliable forecast.
Occupancy Biased Strategy
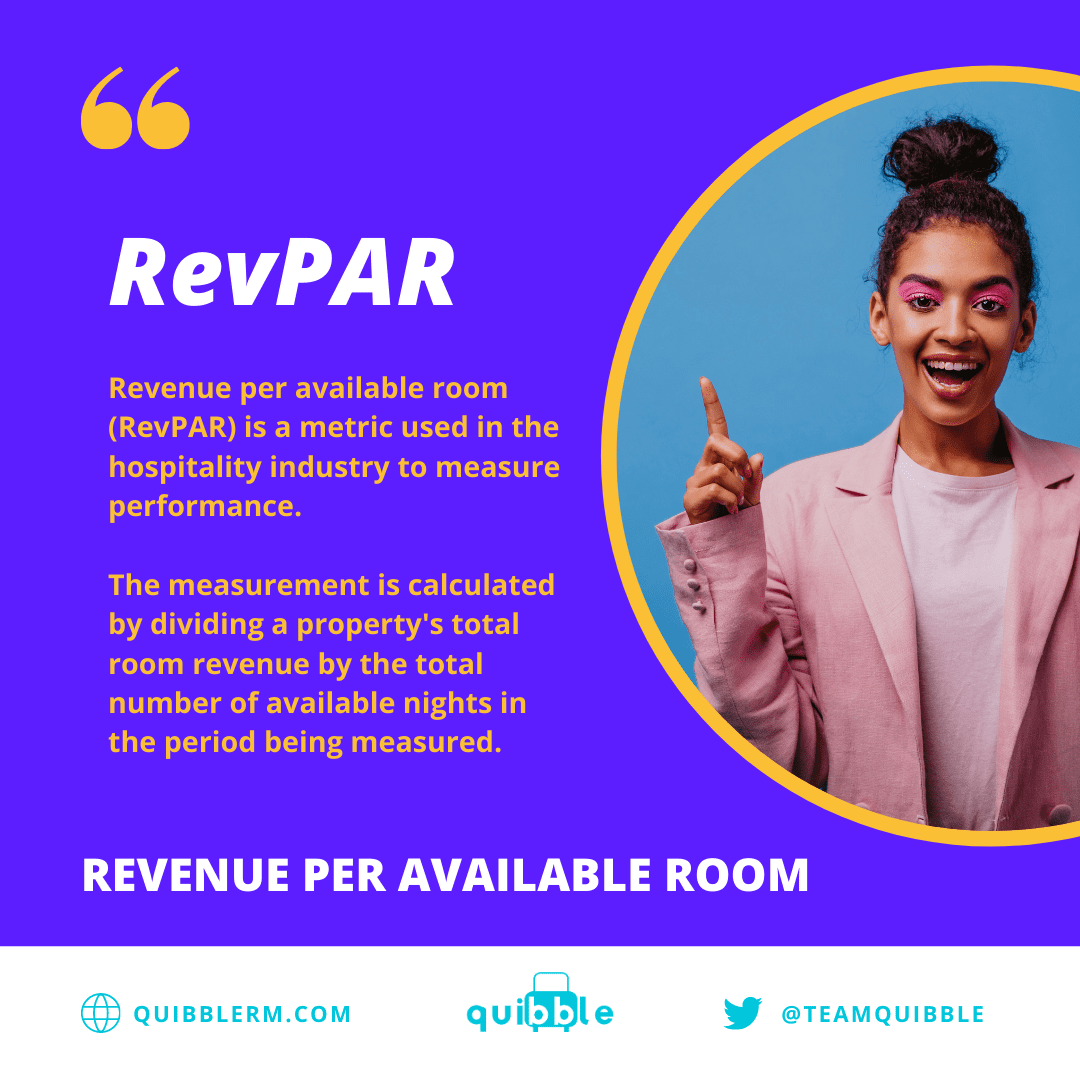
In revenue management, there are two ways a strategy can have a bias. The first is occupancy bias, and the second is the yield (ADR – Average Daily Rate) bias. An occupancy biased approach prefers to take more reservations, and a yield-based biased approach tends to higher prices. An experienced revenue manager generally has only one strategy, which has no bias. It is to maximize unit revenue RevPAR (Revenue Per Available Room).
Individual scenarios can justify a bias in one direction or the other. It is rational to bias towards occupancy when the listing has limited historical data, and there is no reliable forecast. New listings have no historical data to support an occupancy forecast, so the uncertainty is high. Favoring reservations over price in the early stages of a new listing allows revenue management algorithms to learn where demand exists. After the system is aware of the demand, it is better equipped to optimize the next period’s price.
Bias Towards Occupancy
There are specific scenarios where a bias towards occupancy is not rational, and that is when demand is inelastic (less affected by price). The vacation rental market price will reliably decrease as fewer days are left to book a listing. This tendency may be a rational strategy for the single property manager operating without a reliable forecast to undercut the competition to maximize occupancy. But the plan starts to fall apart when ALL property managers start to decrease prices when there are fewer days left to book. Most of the demand that arrives late is inelastic, and this is precisely when the industry has decided to start dropping the price.
Solving the Occupancy Bias
Property managers are not irrational when they drop the price at the worst possible time. They respond to the first condition where the occupancy strategy is rational. They do not have a reliable forecast. The systems available to the industry do not forecast demand. They only dynamically change prices. To solve the occupancy bias, the property managers need a reliable forecast at a very granular level.
In revenue management, last-minute discounting is the telltale sign that there is a lack of accurate forecasting. The reasoning for this is quite simple, if the property manager discounts the nightly rate close in, one is forced to ask why did they not put that rate available further out? They did not have an accurate demand forecast to tell them if and when that demand would arrive. At Quibble, this is the problem we solve for our clients by building detailed and accurate occupancy forecasts.
Occupancy Forecasting
Revenue Management (excluding rules-based systems) as a process splits into two separate modules: A Forecasting Module and a Price Optimization Module. The forecasting module has the primary function of forecasting the occupancy at the most granular level possible. This function translates to a demand forecast for every single calendar date at the property level. That forecast data feeds into the Price Optimization Module to generate the statistically optimal price for the listing.
The forecast and optimization modules must generate demand estimates and prices for the entire set of inventories once the listing becomes available. In some cases, the vacation rental property inventory becomes available as much as a year in advance. The revenue management system’s job is to predict, however far in advance, if the property will be booked or vacant. The forecast built on the initial uploading of the inventory is not static. As the system runs and learns more about booking patterns, it will continue to update the forecast.
Different industries use different methods to achieve forecasts, and revenue management forecasting has used a method called time-series forecasting for over 40 years. This type of forecasting looks exclusively at trends that have happened in the past and try to map them to future events.
There are distinct advantages and disadvantages to this type of forecasting.
Using Historical Data
The significant benefits of using your historical data to build a forecast are that the data is highly reliable (compared to scraped data) and that you can have a high degree of confidence that the method will keep your prices moving towards the theoretical optimal price. The major disadvantage is when the forecast can learn about new trends and update seasonality can be too slow. Other methods have been experimented with to forecast demand in revenue management systems, but none have produced a level of accuracy acceptable by the industry to replace time series forecasting.
To overcome the slow learning rates of time-series forecasting, revenue management practitioners have looked for reliable ways to increase the occupancy forecasting module’s reactivity. The biggest challenge with increased reactivity in the model is the potential to increase error simultaneously. Revenue Management systems are looking for repeatable trends from historical data. If a recent trend starts to develop, the system will not know if that is a trend or just a blip in the incoming data set for several months.
Exponential Smoothing
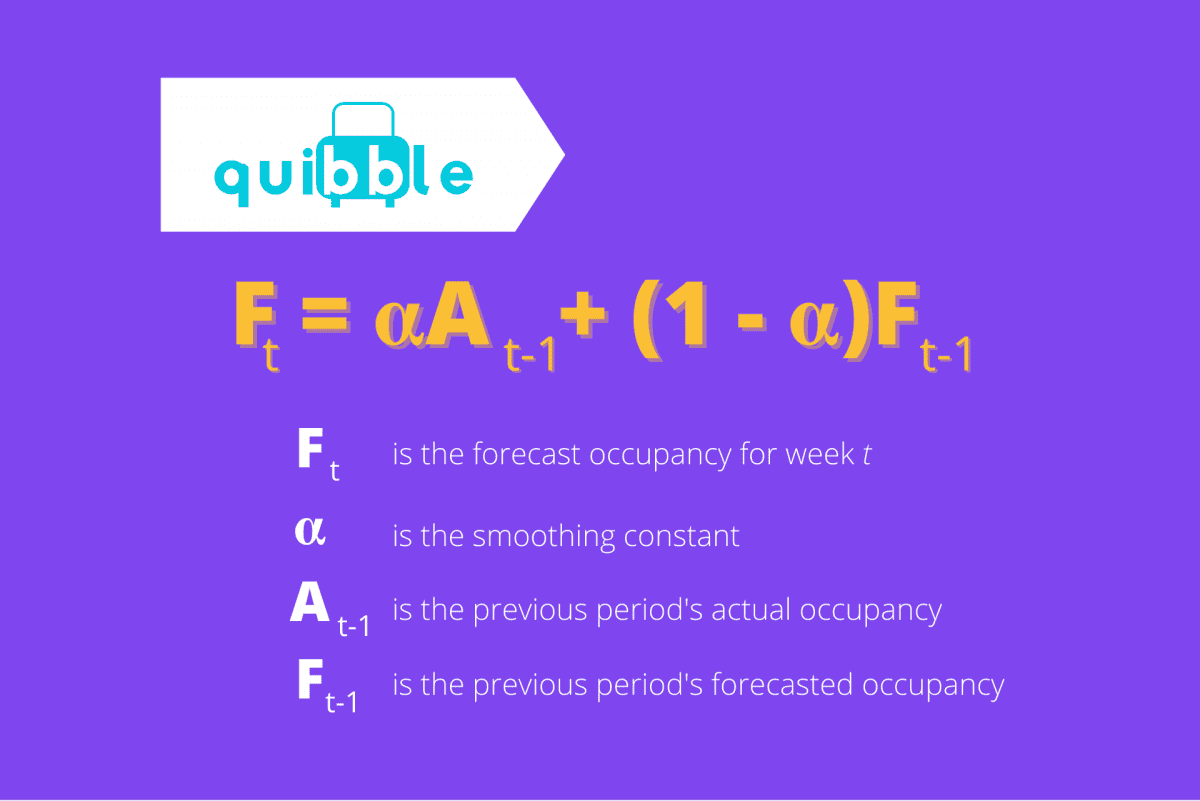
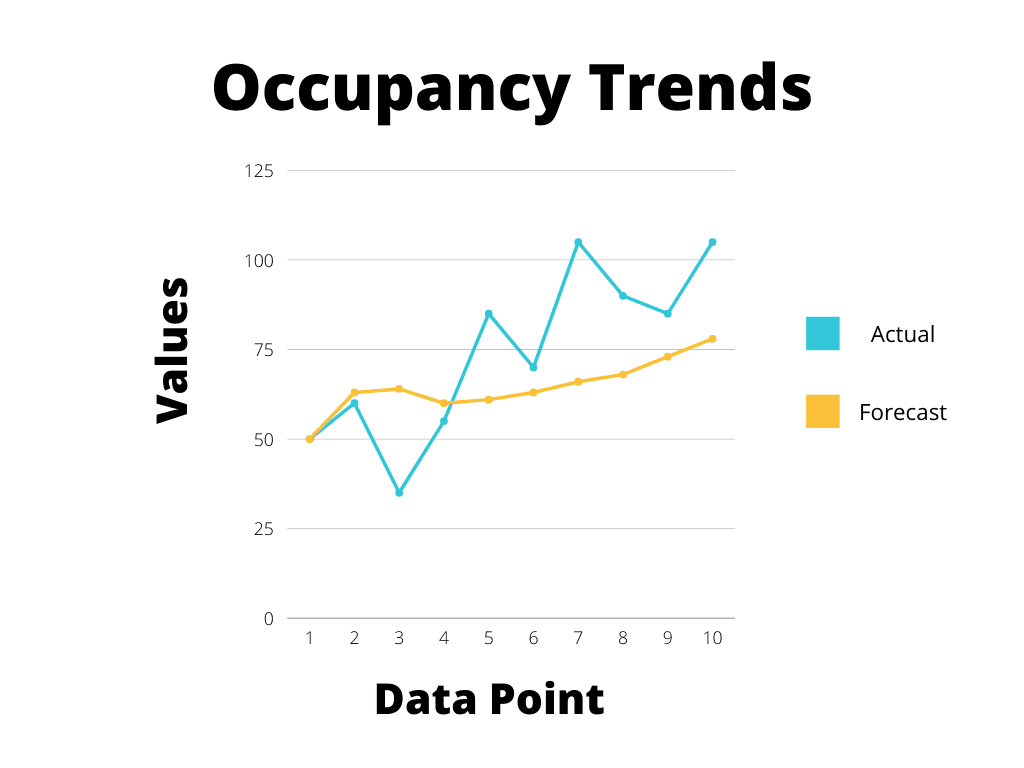
One method to address the slow learning rates in time-series forecasting is called exponential smoothing. This method increases the weighting of the newer reservation data as it comes into the model. Its purpose is to help the model learn faster than otherwise while not overreacting to significant variations that are not predictive of a trend change. An alpha parameter is set by the user to determine how strongly the new data is biased in the forecast. Choosing the right alpha is the most decisive determining factor of this forecasting model’s success. In the example below, it is clear that the forecast is following the trend of increasing values. It is still somewhat conservative in its estimate.
Recent Methodologies
A more recent method used to correct the slow learning rates relies on industry data scraped from websites like Airbnb and VRBO. This methodology is a departure from traditional time-series forecasting as it now relies on aggregate data collected on competitors. The benefits of this data are that it gives the revenue management system a constant feed of pricing and inventory data on its competitors to make decisions. This data is a powerful signal for how the market is trending and how property managers should update their forecasts. This data is so essential that the short-term rental (STR) software vendors have foregone time-series forecasting altogether and rely solely on data scraped from these websites to run their entire models (both Forecasting and Pricing Modules).
There are two significant struggles for these types of systems. The first is the notorious unreliability of scraped data from websites, specifically on Airbnb and VRBO. The second is that the forecast becomes utterly reliant on the competitors’ decisions, a dangerous place to be. If a significant enough portion of your competitors makes a mistake in their pricing, you are sure to follow. The most reliable forecasting process includes both time-series forecasting as the base and using industry scraped data as a signal to react quicker to market changes as we do at Quibble.
Occupancy Metrics
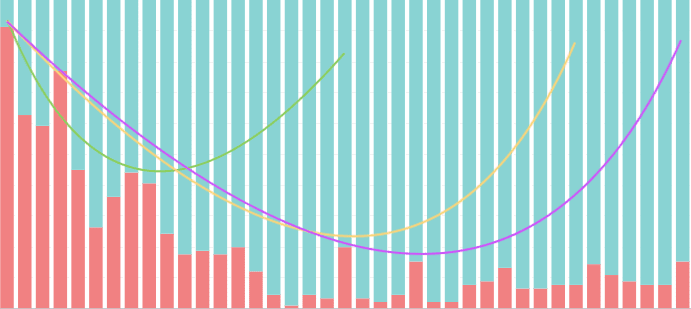
The most effective way to look at occupancy rates is not as a static number but as a trend. It is essential to know where the rates end up, but the most crucial thing for revenue managers is understanding how the rates are trending. That is because we want time to affect the outcome by changing pricing and minimum stay restrictions.
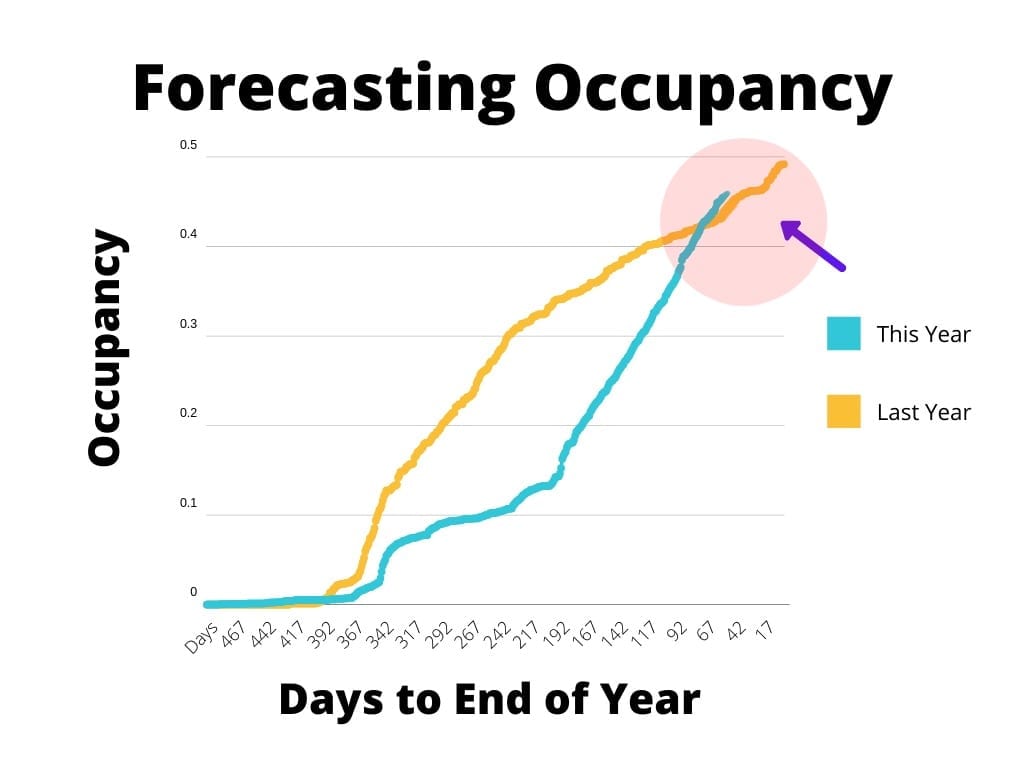
The first step in making the data useful is by trending it and compared it to a benchmarking set of data. The chart below shows an occupancy trendline for the current month (the solid yellow line). This graph is an occupancy chart for all inventory available for the current month. What is evident in this chart is that the current month is not over. There are still more days left to take reservations and build the occupancy rate. When a revenue manager looks at this chart, they are trying to evaluate the trend that led to the current position and what is possible to achieve for the remainder of the month by modifying the current pricing.
Benchmarks
A benchmark is critical to answering these questions. The benchmark data is the previous year’s occupancy curve for the same month in the chart above. Under normal conditions, year over year data is an excellent benchmark. This data sample is affected by COVID19 but is still very informative as to occupancy rate performance. This month’s booking pace was slower than the previous year in the early days of this curve. It is the revenue manager’s job to understand what the market conditions are that are driving that change. If the revenue manager has recently increased prices, this data would be a good signal for how the market is reacting to the change.
It is possible that competitors have increased inventory in the market, and market share is shifting away from their units. Whatever the reason, the revenue manager needs to know, so they react appropriately. In this case, the change was due to COVID19, which dramatically changed the occupancy curve slope. The most recent trend in the booking pace is strongly positive in comparison to last year’s data. It is booking so much faster now that it has overtaken in the previous year’s position for the same point in time. The revenue manager must then evaluate the system forecast and ensure the booking pace will maximize unit revenue or RevPAR.
The Trinity of Metrics
RevPAR = Occupancy (OCC) * Average Daily Rate (ADR)
The occupancy rate does not matter in isolation. It is a useful metric to understand demand and to know how full your properties are. But it only matters because it makes up one half of the equation that is RevPAR. Revenue per available room is the most important of all metrics.
Revenue management is a maximization function where the goal is to maximize Revenue with different possible combinations of Occupancy and Daily Rate. If a process were to maximize occupancy alone, it would be much easier to solve. Keep reducing rates until the reservations are equal to the inventory. Similarly, maximizing the Average Daily Rate is easy if there is no concern about occupancy. The challenge is much more formidable than that, and occupancy is an essential part of the Holy Trinity of Revenue Management metrics.
What we do at Quibble is continuously solve this RevPAR equation for our clients. The combination of Occupancy and ADR that maximizes revenue today will undoubtedly change by tomorrow. Like everything else in your short-term rental, revenue management is a never-ending project.

Pricing
Ease of Mind
Revenue Management Experts and Pricing Optimization for your Short-Term Vacation Rental are one click away!
Receive more information via email by fill-up the form below.
Join our newsletter
Dominate the short-term rental market with cutting-edge trends

