Insights: the portfolio over time
Open Insights under Performance. Filters run from weekly to yearly, across markets, groups, and properties, plus two slices the Dashboard does not have: bedrooms and day of week.
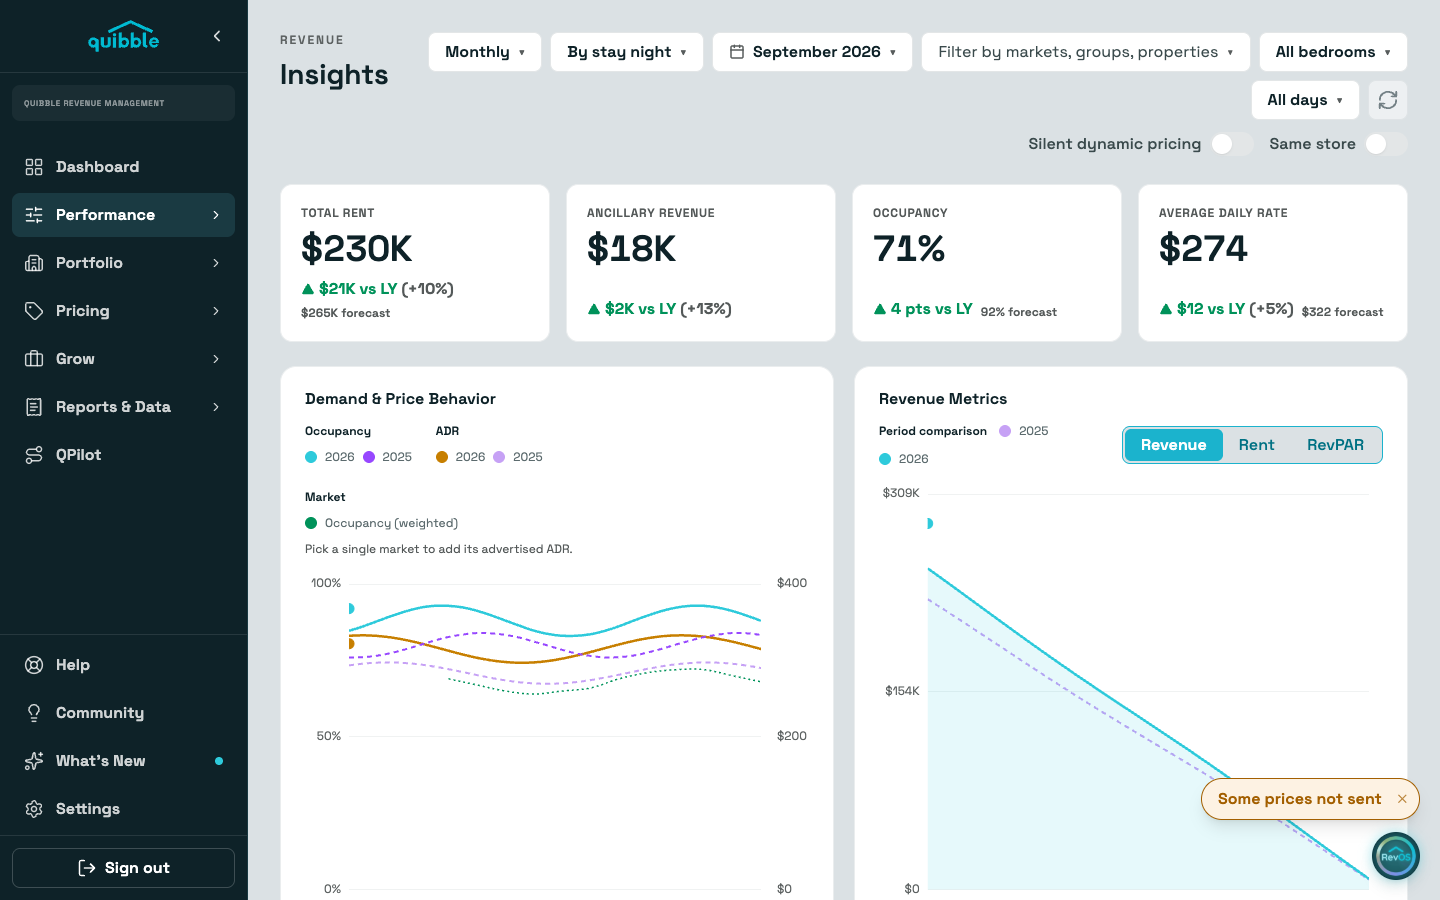
The KPI cards track total rent, ancillary revenue, occupancy, and average daily rate for the period, each against last year and, where one exists, against where the metric is forecast to land by period end.
Demand & Price Behavior overlays occupancy and ADR for this year and last, so you can see whether your rate is following demand or fighting it. With one market picked it also draws the tracked market’s occupancy and its Advertised ADR (dotted): what the market is asking for open nights, not what it booked.
Revenue Metrics is the cumulative build through the period, switchable between revenue, rent, and RevPAR. On completed periods, the MPE menu overlays the most probable estimate as it stood 15 to 90 days out. Secondary metrics beneath it count inventory growth, bookings, active properties, and booked nights, and Portfolio charts show the full year for the selected year and Same store setting, ignoring the market, group, property, and bedroom filters.
Revenue by channel ranks where the money comes from. Market health then ranks your markets on occupancy and ADR against last year.
Revenue by channel and Market health report by month, quarter or year. Under a week, day-of-week or bedroom filter they say so rather than showing the wider period’s figures.
- The day-of-week filter answers weekend questions: pick Friday and Saturday and the stay-night metrics re-slice.
- Same store keeps a comparison honest when listings joined or left during the year.