Reading a property’s Overview
The rent card shows the month’s booked rent and the forecast to close, with the change against the same month last year.
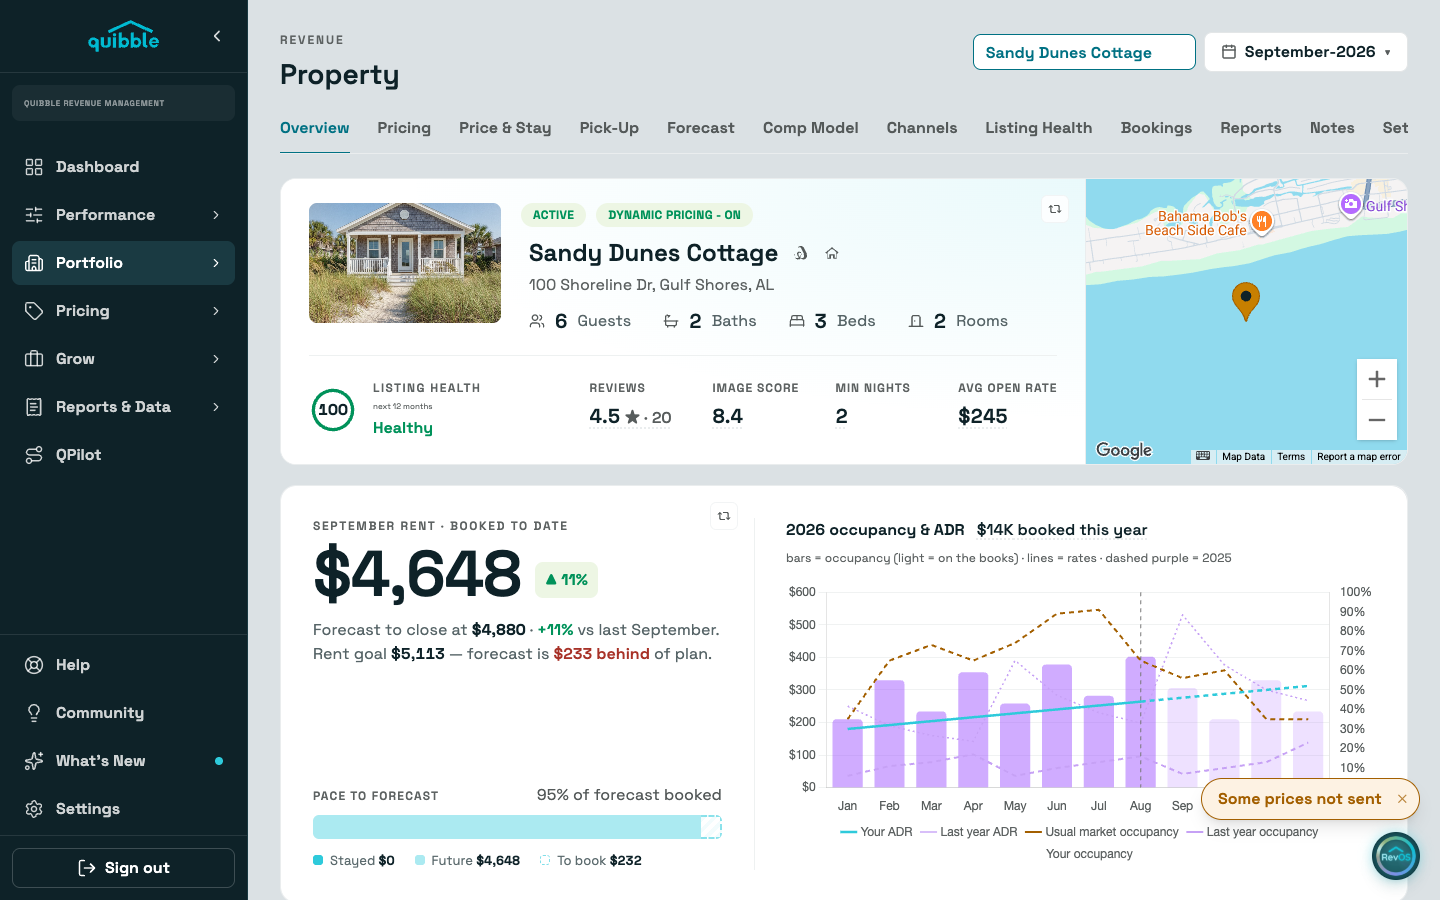
The pace strip beneath splits booked rent into stayed and still-to-come, with the dashed tail showing what the forecast expects you still to book.
The chart to the right is the year: occupancy as bars (light bars are on the books), your ADR as the teal line, and the market’s rate and fullness overlaid where we track nearby listings.
Below, the KPI row carries ADR, occupancy, RevPAR, and ancillary against forecast; Needs attention lists what is off for this listing; Upcoming bookings lists the month’s remaining stays; and the summary table at the bottom carries the month-by-month figures.
Figures on this card are rent — what pricing controls. Cleaning and other fees sit separately under Ancillary. From the Properties list, each row’s menu jumps straight to a listing’s Pricing, Comp set, Health, or Bookings, or adds it to the Working Queue.