The Dashboard: your daily read
The header filters drive nearly everything: granularity (monthly, quarterly, yearly), the period, a market, group, or property filter, a Same store toggle for comparable listings only, and a Silent dynamic pricing toggle that keeps to listings with pricing on.
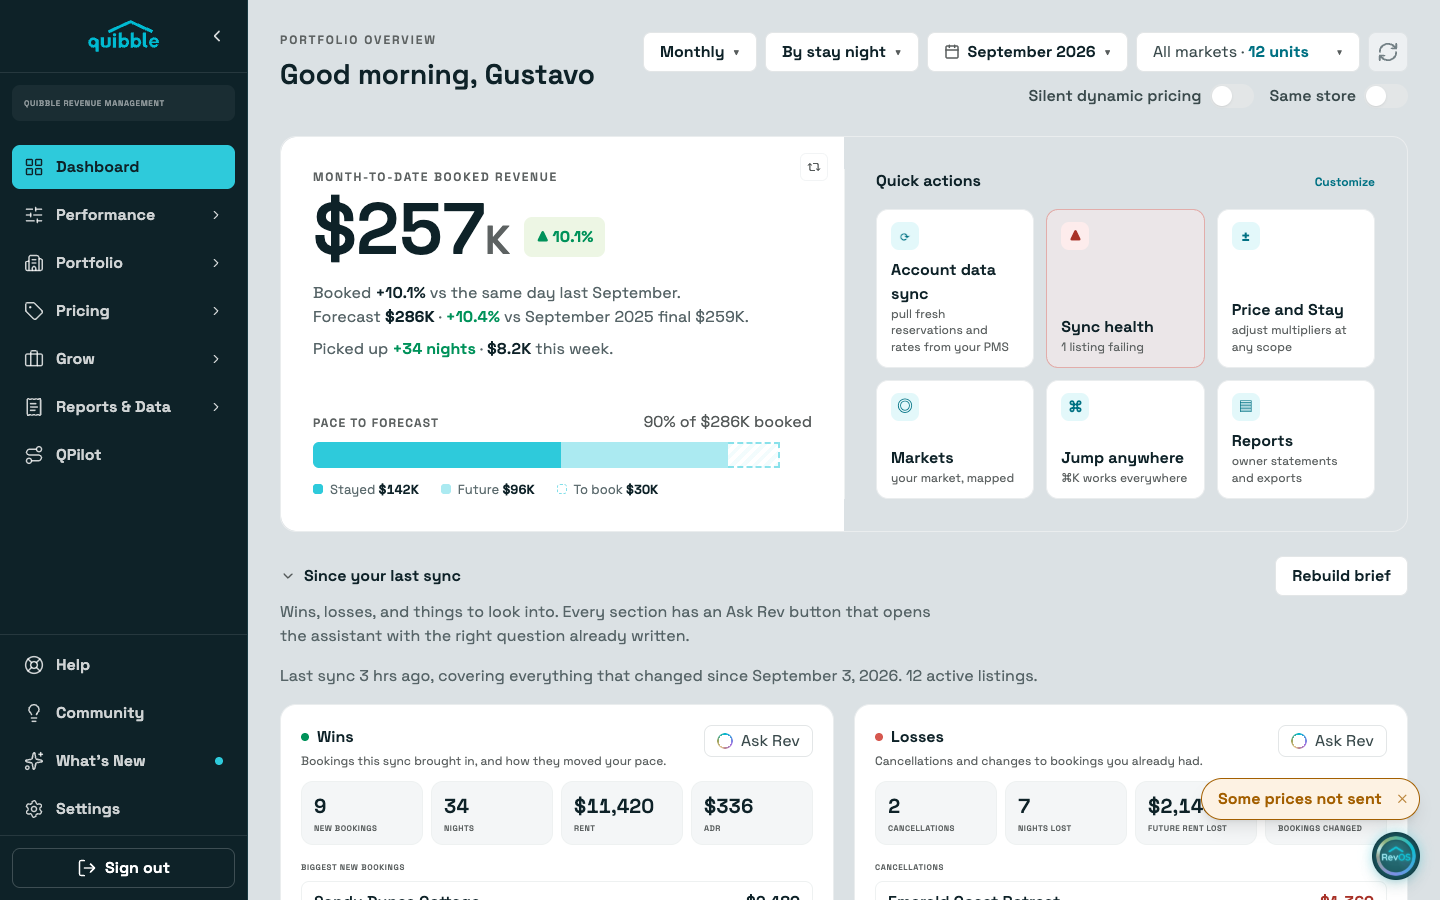
The booked-revenue card leads: what is on the books for the period, how it compares with the same day last year, and the pace bar splitting stayed, future, and still-to-book against forecast. Directly under it sits the daily brief (Since your last sync), then the Cumulative rent pace chart. Every section below the hero collapses and remembers your choice.
The four KPI cards carry ADR, occupancy, RevPAR, and ancillary, each against forecast and last year, with a twelve-month strip showing where the period sits in the year.
Click any card, or its flip button in the corner, to turn it over: the back holds exact figures, the basis note, and a link deeper into the app. Esc flips back.
Needs attention counts listings that look underpriced, overpriced, or off in some other way, with the estimated revenue at stake. Recent activity lists the latest bookings to land and links to the full Booking Feed.
Quick actions is yours to arrange: Customize picks up to six tiles, from pushing prices (armed with a confirming second click) to opening Reports.
Figures are on a stay-nights basis: rent spreads across the nights of a stay, while fees count once per stay and sit under ancillary, never in ADR or RevPAR.